Effect of Austempering Temperature on
Properties, Microstructure and Formation of
Ausferrite in CADI (CarbidicAustempered
Ductile Iron)
Gopal. S. Tiwari1, Dr. Sunil. A. Patil2
P.G. Student, Department of Mechanical Engineering, GECA, Aurangabad, India1
Associate Professor, Department of Mechanical Engineering, GECA, Aurangabad, India2
ABSTRACT:Austempered Ductile Iron (ADI) results from a special heat treatment of ductile cast iron. Using this process, a phenomenal increase is observed in abrasion resistance and strength as well as toughness of the ductile iron. Proper heat treatment gives desirable mechanical properties if high quality ductile iron is used as raw material of the ADI. Different choice of heat treatment parameters result in different grades of ADI which have different physical properties and behavior. The major responsible factor in the material for its physical strength, toughness and wear resistance and hardness is its carbon content in various forms either free graphitized or combined with some other constituent element like Cu, Ni, Cr, Mg or Si etc. The equivalent carbon percentage decides the nature of the obtained material. This ranges from 4.3% to 4.6% in ADI. Due to combination of carbon with non-Fe constituents, carbidic ADI is formed. The objective of current research is to analyze the effect of austenitizing temperature of 9750C on hardness, micro-hardness, wear resistance and impact toughness properties of a specific combination of carbidicaustempered ductile iron treated at different austempering temperatures and time duration.
KEYWORDS:ADI, austenitization, ausferrite, CADI, wear resistance
I. INTRODUCTION
properties studied include hardness, micro-hardness, wear resistance and impact toughness by notchlessCharpy test. The microstructure is determined by SEM and results of X-Ray diffraction test are also included to observe peaks of various phases present in the composition on the microstructure surface.
II. RELATEDWORK
As the current research is focused to check the effect of austenitization temperature on CADI, it is necessary to take cognizance of earlier research work and available literature regarding the austempering process parameters and their effect on the properties of austempered ductile iron. Austempering process parameters involve austenitizing temperature, austempering temperature and time duration for both the steps involved, i.e. austenitization and austempering.
Austenitization Temperature:The austenitization involves the heating of ductile iron to austenitization temperature of 840°C to 960°C. The material held at this temperature for sufficient time to allow for homogeneous temperature distribution and uniform distribution of carbon in austenite and transfer the phases to austenite, before cooling rapidly to the austempering temperature in salt bath. The temperature of 815°C to 940°C be chosen when good machinability and better mechanical properties are required after machining [4].Theaustenitization temperature range of 840°C to 960°Chas been found to produce consistent result [5]. The austenitization temperature defines the carbon content of the austenite at the beginning of the isothermal transformation.As the austenitization temperature increases, the carbon content thereof also increases in austenite, which results in a decrease in the driving force for transformation to ausferrite. Hence, higher austenitizing temperature results in coarser microstructure ADI [6].
Austenitizing temperature has an effect over mechanical properties [7] [8]. The selection of austenitizing temperature depends on the composition, section size, and microstructure of the castings, austenitizing temperature and duration for reaching peak toughness[9][10].Austenitizing temperature in the range 810°C-960°C is commonly employed [11]. The isothermal reaction which is responsible for ausferritic structure can be divided into two stages.First is upper critical temperature during which casting is transformed into completely austenite phase and second is quenching to austempering temperature [12] [13] [14].Austenite rejects the carbon and nucleation of ferrite around the grain boundaries of austenite starts and rejected carbon enrich the carbon content of retain austenite, thus ferrite and high carbon austenite (ausferrite)phase is formed [5].
Austempering Temperature:It is well established that austempering temperature is another principle variable governing the microstructure and mechanical properties resulting from the austempering. Austempering consists of heating to a suitable austenitizing temperature followed by quenching into a medium maintained at a constant austempering temperature in the bainitic transformation range (205°C to 400°C), and holding at that temperature for the time required for transformation to take place[15][16] [17]. The, quenching to the austempering temperature must be fast enough to avoid pearlitic or ferritic transformation, if the maximum attainable toughness or ductility is to be realized.
Austempering duration: The austempering duration variable is important. The range of austempering time 1h to 4h is chosen for producing ADI for good properties [10] [18]. A correct austempering time must lead to structure free from martensite (characteristics of too short holding time) and precipitated carbides (characteristics of too long holding times). Austempering duration has influence on the properties of ADI castings. Austempering duration in the range 0.5h to 6h, affect the mechanical properties namely impact strength, fatigue strength, ductility etc. [11]. The austempering duration depends on the composition, alloy segregation and austenitizing temperature. Especially for unalloyed ductile irons, the selection of austempering time plays a major role to achieve peak toughness. Austempering duration 1h to 4h is good for ADI castings [18].
III.EXPERIMENTAL PROCEDURE
Material and Sample Preparation:
Carbidic ductile iron was produced in a metal casting foundry. The capacity of the 3 kHz induction furnace used for this was 100 kg. The pattern used for casting is as shown in the following figure.
Fig. 1. Pattern used for casting
Fig.1 shows the pattern used for casting. It was made of wood. Standard allowances and good finishing were ensured while making the pattern. Using this pattern, a mould was prepared with specific sand. A finished mould was obtained after removing the pattern from the sand.
Fig. 2. Test bars obtained from casting
Fig. 2 shows the test bars obtained from the castings. The dimensions (in mm) of the casting thus obtained by this mould are 15x15x200. Scrap steel and foundry rejections were used as charge material. The percentages of other ingredients of the composition are tabulated in table 1.
Element C Si Mn S P Cr Cu Ni Ti Mg Carbon Equivalent
Percentage 3.6 1.9 0.64 0.0122 0.0294 4.3 0.610 0.431 0.016 0.044 4.23
Table 1. Composition of material
Table 1 shows the weight percentage of non-ferrous ingredients of the composition. In this way, test bars having above dimensions of as cast carbidic ductile iron (CDI) were obtained. From these test bars, various test samples were prepared after the process of heat treatment (austempering). Six CDI test bars were heated in a muffle furnace at an austenitizing temperature of 9750C for 1hour. After this these test bars were austempered in a salt bath for various austempering
A piece of length 10mm and cross section 15mm x15mm was sliced from each of the test bars for the microstructural characterization. The same microstructure samples were subsequently used for testing the hardness and the micro-hardness of the material. X-Ray diffraction test was performed on the same test samples.
From the remaining length of each of the test bars, samples for wear resistance test and impact toughness test were prepared. Each test bar was cut into two pieces by EDM wire cut machine and from each of the two pieces one sample for wear resistance test and one sample for impact toughness test were prepared. For wear resistance test, pins of length 25mm and diameter 8mm were drawn by using EDM wire cut machine. Impact test samples of length 55mm and cross section 10mm x10mm were also cut by EDM wire cut machine.
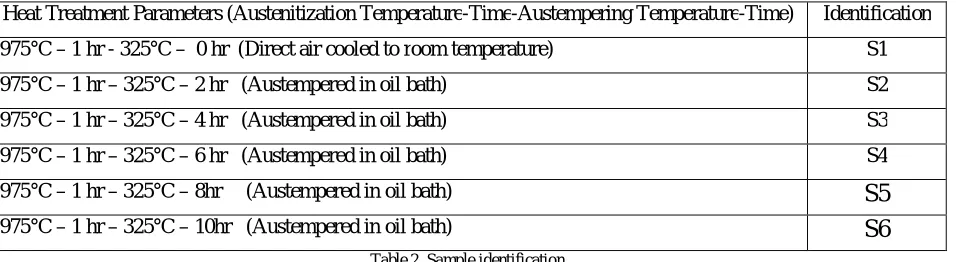
The sample identification depending on the heat treatment parameters is as given in the table 2.
Heat Treatment Parameters (Austenitization Temperature-Time-Austempering Temperature-Time) Identification
975°C – 1 hr - 325°C – 0 hr (Direct air cooled to room temperature) S1
975°C – 1 hr – 325°C – 2 hr (Austempered in oil bath) S2
975°C – 1 hr – 325°C – 4 hr (Austempered in oil bath) S3
975°C – 1 hr – 325°C – 6 hr (Austempered in oil bath) S4
975°C – 1 hr – 325°C – 8hr (Austempered in oil bath)
S5
975°C – 1 hr – 325°C – 10hr (Austempered in oil bath)
S6
Table 2. Sample identification
Table 2 shows the sample identification for CADI samples under test. S1 sample is austenitized at 975°C for 1hour and it is not austempered, but directly air cooled to room temperature. Hence, we say it is austempered for 0 hour at 325°C. All the subsequent samples are also austenitized at 975°C for 1 hour and then they are austempered in an oil bath at 325°C for 2 hours (S2), 4 hours (S3) so on up to 10 hours (S6).
Samples were prepared for optical microscopy and SEM test of the material. Standard cutting and polishing process was incorporated for sample preparation. The surface to be examined was etched by 2% Nital solution.
SEM and XRD test of Samples:Scanning Electron Microscopy of prepared samples was performed by using Jeol JSM-6380A Scanning Electron Microscope. Photographs of samples taken at uniform magnifications are as shown in results. The XRD test of austempered samples is done using copper k-α radiation.
MECHANICAL TESTS:
HARDNESS AND MICRO-HARDNESS TEST: Rockwell hardness was measured at 150 kg load (HRc) on C-scale. A hardness profile was obtained for each alloy. In order to determine the hardness of the carbides and the ausferrite phase matrix separately, micro-hardness was measured by micro indentation. Tests were carried out by using a Vickers indenter at a load of 200g (HV200). The average value of three measurements at different location across the cross
sectional area was considered for the analysis.
WEAR TEST: Wear tests were carried out on the prepared samples as per ASTM G-99 Standard. The abrasion wear resistance was evaluated by performing the “Pin on Disc Abrasion Test”. The disc was having a wear track made of diamond ring having hardness of around 3000HV and width of 10mm. According to the ASTM G-99 standard, and
Fig. 3 (a)
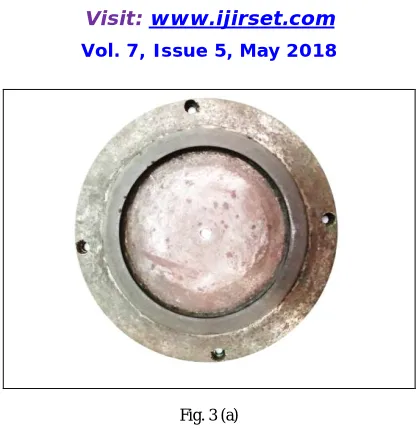
Fig. 3(a) shows the disc used for pin on disc wear test. It shows the wear track made of a diamond coated ring with track radius of 58 mm and track width 10mm.
Fig. 3 (b)
Fig. 3(b) shows a pin of one of the samples for wear test. It is drawn from the test bars by EDM wire cutting.
Fig. 4(a)
Fig. 4(b)
Fig. 4(b) shows the measurement of the pin length on Vernier scale. The length of the pin is 25mm.
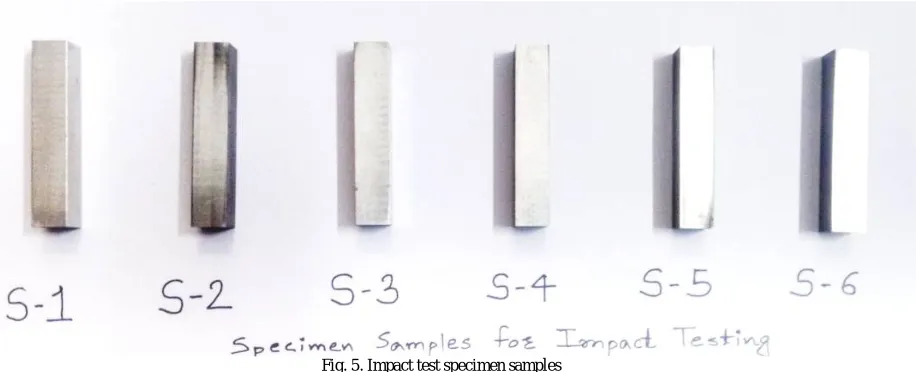
IMPACT TOUGHNESS TEST: The impact toughness tests were carried out on the prepared samples. The impact toughness of samples was obtained by performing notchlesscharpy test on samples of size 55mm of length and 10mm x 10mm cross section. They are as shown in following figure.
Fig. 5. Impact test specimen samples
IV.RESULTS AND DISCUSSIONS
SEM and XRD of Samples: The microstructure of the austempered samples is reported in Fig.6 (a) to Fig.6 (f). The microstructures of austempered samples show a mixture of ferrite and austenite. Photographs of samples are taken at uniform magnification of 1500x.
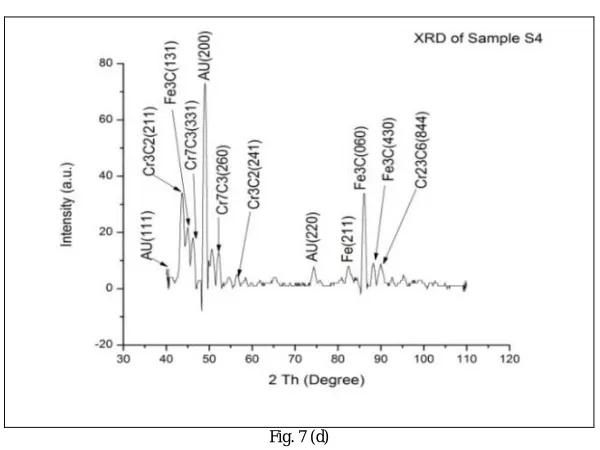
The XRD test of austempered samples revealed the peaks of Austenite, Ferrite, Iron carbide, martensite and Chromium iron carbide in austempered samples. Similar peaks are observed over the selected range of samples; only the variation is the little shift of peaks and the counts (AU) of various elements as observed in XRD, as shown in Fig.7 (a) to Fig.7 (f). Austenite and ferrite are significantly noted in samples S2, S3, S4. As the austempering duration increases pearlitic transformations increase the extent of martensite and carbides (iron carbide and chromium iron carbide).
Fig.6 (a)
Fig.6 (a) is SEM image of sample S1. It shows carbide and martensite in the microstructure.
Fig.6 (b)
Fig.6 (c)
Fig.6 (c) is SEM image of sample S3. It shows carbide phase. Also ausferrite matrix phase is seen in this image. Graphite nodules are also seen in the microstructure.
Fig.6 (d)
Fig.6 (d) is SEM image of sample S4. It shows carbide phase. Also ausferrite matrix phase is seen in the microstructure.
Fig.6 (f)
Fig.6 (f) is SEM image of sample S6. It shows predominantly carbides in the microstructure. Graphite nodule is also seen.
The XRD test results of the samples are as shown in following figures i.e. Fig.7 (a) to Fig.7 (f).
Fig.7 (a)
Fig. 7 (b)
The XRD of sample S2 in Fig.7 (b) shows the peaks of ferrite at 200, 211 and austenite peak at 111, 200 and iron carbide peaks at 221, 300 and chromium carbide peak at 312, 353.
Fig. 7 (c)
Fig. 7 (d)
The XRD of sample S4 in Fig.7 (d) shows the peaks of ferrite at 211 and austenite peak at 111, 200 and iron carbide peaks at 131, 060, 430 and chromium carbide peak at 331, 211, 260, 241, and 844.
Fig. 7 (e)
Fig. 7 (f)
The XRD of sample S6 in Fig.7 (f) shows the peak of ferrite at 200 and austenite peak at 111, 220, 200 and iron carbide peaks at 322 and chromium carbide peaks at 422, 004, 451 and martensite peaks at 110and 220.
HARDNESS TEST:
The Rockwell hardness on C-scale was determined for all samples S1 to S6. Bulk hardness was determined as average of three measurements. The Vickers micro hardness was determined as the average of three measurements in each alloy in the region of carbide and ausferrite. Carbides are randomly precipitated throughout the sample. Therefore it was measured as an average of three readings. The tabulated and graphical representation of both these tests shows the trend of change in the hardness and micro-hardness properties as seen against the change in austempering durations of the samples.
Table 3. Results of Bulk Hardness Test
Table 3 shows the bulk hardness of the samples. It is a gradually decreasing trend of hardness. Sample Rockwell Hardness (HRC)
S1 62
S2 59
S3 57
S4 56
S5 54
Fig. 8. Graphical representation of bulk hardness test results
Fig. 8 shows the graphical representation of the bulk hardness readings in table 3. Hardness shows a decreasing trend as per the increase in austempering duration takes place.
Table 4. Results of Bulk Hardness Test
Table 4 shows the readings of micro hardness of the two phases obtained in the microstructure. Carbide phase is harder than the matrix phase i.e. the ausferrite phase.
Fig. 9. Graphical representation of bulk hardness test results
Micro-hardness bearing value from 850HV200 to1050HV200 in carbide phase shows firstly decreasing and then increasing trend. While in ausferrite phase the micro hardness first increases and then decreases showing a repetitive
Sample Micro-hardness of carbide phase (HV0.2)
Micro-hardness of ausferrite phase (HV0.2)
S1 1031.0 515.3
S2 844.7 581.3
S3 847.1 593.0
S4 962.0 514.0
S5 996.4 589.0
behaviour over the time keeping the range between 500HV200 to 600HV200. The trend of micro hardness may be due to the pearlitic transformation and formation of maretnsite for the sample produced by austempering more than 6 hrs. WEAR TEST: Pin on disc wear test was carried out for all the six samples according to ASTM G-99 standards. An average of three readings was taken for all the samples and the wear was calculated in terms of weight loss. The results of the wear test are as tabulated below.
Table 5. Results of pin on disc wear test
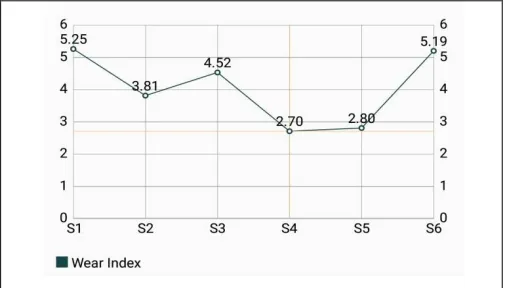
The table 5 shows the wear weight loss in grams for all the six samples and their corresponding wear resistance index.
Fig. 10 (a) Graphical representation of wear weight loss
Fig. 10 (a) shows the graphical representation of the wear weight loss recorded for all the six samples in grams against the austempering duration of the samples.
Sample Wear weight loss of sample WLS (g)
Wear Resistance Index (E) = WLR/WLS
S1 0.0087 5.253
S2 0.0120 3.808
S3 0.0101 4.525
S4 0.0169 2.704
S5 0.0163 2.804
Fig. 10 (b) shows the graphical representation of the wear resistance ratio recorded for all the six samples in grams against the austempering duration of the samples. Wear weight loss of reference material that is as cast CDI sample is 0.0457g.
The wear test observations showed a quick rise firstly and then for few time it was observed a constant wear resistance which further had a quick rise. Sample S2 and S3 which show a decreasing trend of bulk hardness were found to show an increasing trend in wear resistance. After that it lowers towards a near constant reading for S4 and S5. The wear resistance index varies from 2.7 to 5.25.
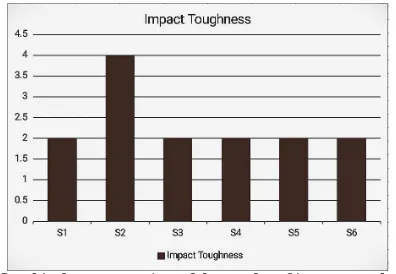
IMPACT TOUGHNESS TEST:The results of notch less charpy test are as tabulated below.
Table 6. Results of impact toughness test
Table 6 shows the results of notchlesscharpy test i.e. the impact toughness test performed on all the six samples of CADI.
Fig. 11.Graphical representation of the results of impact toughness test.
No significant variations were observed in the impact toughness of all the six samples except for sample S2.
OBSERVATIONS:
1. Sample S1 showed peak Rockwell hardness while sample S6 showed the least among all the six samples. 2. Vickers micro-hardness showed values ranging from 850HV200 to 1050HV200 for carbidic phase and the
Vickers hardness for samples S1 and S6 showed peak values. The moderate phase hardness being in samples S2, S3 and S4.
3. Vickers micro-hardness showed values ranging from 500HV200 to 600HV200 for ausferrite matrix phase and the Vickers hardness for samples S2, S3 and S6 showed satisfactory values.
4. Sample S2, S3, S4 and S5 show significantly increased wear resistance as compared to that of as cast sample. 5. Sample S2 has the best impact toughness among all while others show the same value.
Sample Impact Toughness
S1 2 joules
S2 4 joules
S3 2 joules
S4 2 joules
S5 2 joules
V. CONCLUSION
Carbidic ductile iron with 4.3% of Cr in it was austempered to obtain carbidicaustempered ductile iron. The material so obtained shows a trend of various properties which leads to following conclusion.
Selected austenitization temperature 9750C creates a matrix of austenite and ferrite. Hence formation of CADI is seen in samples S2, S3, S4. Carbon rich austenite attributes to form ausferrite matrix.
For austenitization temperature of 9750C, austempering duration of more than 6hrs tends to produce excessive martensite and carbide.
Austempering CADI upto 4 hours gives significant improvement in properties.The hardness shows decreasing trend for samples but at the same time for sample S2 and S3 wear resistance shows increase. Normally it should be a reverse phenomenon that as hardness is showing a decreasing trend so wear resistance should. The increase in wear resistance seen may be due to the presence of ausferrite which attributes to the enhancement of wear resistance and impact properties. At the same time it acts as a lubricant between the two piece wear and due this lubricating medium the material shows less wear. Hence may be the increased wear resistance.
The reinforcement of the carbides may be the cause of improved properties while the presence of ausferrite being a soft phase increases wear resistance as well as impact toughness.
This precisely concludes that austemperingupto 6 hours can increase properties significantly so that we get the material with increased hardness as well as increased impact toughness while austempering more than 6hrs show the martensite and carbides that can be seen in the microstructure and hence can only increase brittleness but no significant rise in impact toughness.
REFERENCES
[1] S. Laino, J.A. Sikora, R.C. Dommarco, Development of wear resistant carbidicaustempered ductile iron (CADI), Wear 265 (2008) 1-7. [2] K.L. Hayrynen, K.R. Brandenberg, Carbidicaustempered ductile iron (CADI) - the new wear material‖, Am. Foundry Soc. 111 (2003) 845–
850.
[3] S. A. Patil, S. U. Pathak, Ajay Likhite, Development and Wear Analysis of CarbidicAustempered Ductile Iron (CADI), International Journal of Innovative Research in Science, Engineering and Technology, Vol. 3, Issue 2, February 2014
[4] J.Race and L. Stott., “Heat Treatment of Metals” (4), P(105-109),1991 [5] K. B. Rundman, AFS Trans. vol.92, 815-40, 1984
[6] Cast Iron Technology by Roy Elliott P142
[7] C.Chengjia, J.J. Vuorinen., Trans. AFS, World Conf. on ADI P319-337, 1991 [8] S. Sheppeserson., C Allen, FWP Journal, Vol. 26, No. 6, P37-44, 1986 [9] R.C Voigt and C.R Loper., 1st Int. Conf. on ADI, P 83, Chicago, 1984 [10] A.G Fuller., Trans. AFS 77-102A, P527-536, 1977
[11] U. Drauglates and H. G. Boese., Trans. I.S.A.F., P 247-256, 1985 [12] J.E. Beven, W.G., Scholz, Trans. AFS 77-70, P271-276, 1977 [13] E. Dorazil, B. Barta., , AFS Int. Cast Metals Journal, P 52-62, 1962 [14] K.B.Rundman., W.J. Dubensky, Trans, 85-64, P389-394, 1985 [15] G. Sutradhar., Trans. IIF, P 17-19, 1994
[16] A Alagarsamy., Trans. AFS, World conf. on ADI, P408-419, 1991 [17] F Defoirdt. Trans. AFS World Conf. on ADI, P113-128, 1991