Western University Western University
Scholarship@Western
Scholarship@Western
Electronic Thesis and Dissertation Repository
4-12-2016 12:00 AM
Machine Learning of Lifestyle Data for Diabetes
Machine Learning of Lifestyle Data for Diabetes
Yan Luo
The University of Western Ontario Supervisor
Dr. Charles Ling
The University of Western Ontario Graduate Program in Computer Science
A thesis submitted in partial fulfillment of the requirements for the degree in Doctor of Philosophy
© Yan Luo 2016
Follow this and additional works at: https://ir.lib.uwo.ca/etd
Part of the Artificial Intelligence and Robotics Commons, and the Health Information Technology Commons
Recommended Citation Recommended Citation
Luo, Yan, "Machine Learning of Lifestyle Data for Diabetes" (2016). Electronic Thesis and Dissertation Repository. 3650.
https://ir.lib.uwo.ca/etd/3650
This Dissertation/Thesis is brought to you for free and open access by Scholarship@Western. It has been accepted for inclusion in Electronic Thesis and Dissertation Repository by an authorized administrator of
Abstract
Self-Monitoring of Blood Glucose (SMBG) for Type-2 Diabetes (T2D) remains highly
challenging for both patients and doctors due to the complexities of diabetic lifestyle data
logging and insufficient short-term and personalized recommendations/advice. The recent
mobile diabetes management systems have been proved clinically effective to facilitate
self-management. However, most such systems have poor usability and are limited in data analytic
functionalities. These two challenges are connected and affected by each other. The ease of
data recording brings better data for applicable data analytic algorithms. On the other hand,
the irrelevant or inaccurate data input will certainly commit errors and noises. The output of
data analysis, as potentially valuable patterns or knowledge, could be the incentives for users
to contribute more data.
We believe that the incorporation of machine learning technologies in mobile diabetes
man-agement could tackle these challenge simultaneously. In this thesis, we propose, build, and
evaluate an intelligent mobile diabetes management system, called GlucoGuide for T2D
pa-tients. GlucoGuide conveniently aggregates varieties of lifestyle data collected via mobile
devices, analyzes the data with machine learning models, and outputs recommendations.
The most complicated part of SMBG is diet management. GlucoGuide aims to address
this crucial issue using classification models and camera-based automatic data logging. The
proposed model classifies each food item into three recommendation classes using its nutrient
and textual features. Empirical studies show that the food classification task is effective.
A lifestyle-data-driven recommendations framework in GlucoGuide can output short-term
and personalized recommendations of lifestyle changes to help patients stabilize their blood
glucose level. To evaluate performance and clinical effectiveness of this framework, we
con-duct a three-month clinical trial on human subjects, in collaboration with Dr. Petrella (MD).
Due to the high cost and complexity of trials on humans, a small but representative subject
group is involved. Two standard laboratory blood tests for diabetes are used before and
af-ter the trial. The results are quite remarkable. Generally speaking, GlucoGuide amounted to
turning an early diabetic patient to be pre-diabetic, and pre-diabetic to non-diabetic, in only
3-months, depending on their before-trial diabetic conditions. cThis clinical dataset has also been
expanded and enhanced to generate scientifically controlled artificial datasets. Such datasets
can be used for varieties of machine learning empirical studies, as our on-going and future
research works.
GlucoGuide now is a university spin-off, allowing us to collect a large scale of practical
diabetic lifestyle data and make potential impact on diabetes treatment and management.
Keywords: machine learning, lifestyle data, T2D management, mobile computing
Acknowlegements
Foremost, I would like to thank my supervisor sincerely, Prof. Charles X Ling, for his
con-tinuous support, guidance, and insightful advice. Next, I want to thank Dr. Petrella and Jody
Schuurman for organizing the clinical trials. Last but not least, my acknowledgement and love
also go to my parents, Yang Luo and Huiyan Zhu, who have brought me to this wonderful
world, taught me to appreciate everything I have, directed me through ups and downs and
stood by me at all time.
My research is supported by NSERC Grants and scholarship from the University’s the
School of Graduate Studies. This thesis would not have been possible without the generous
resources provided by the Department of Computer Science.
Contents
Abstract i
Acknowlegements ii
List of Figures vi
List of Tables viii
List of Appendices ix
1 Introduction 1
1.1 Challenges and Barriers of Diabetes Management . . . 1
1.2 Our Solutions . . . 2
2 Literature Review 6 2.1 Mobile Diabetes Management System . . . 6
2.1.1 Features of Diabetes Lifestyle Data . . . 7
2.2 Diabetes Risk and Diagnosis Using Predictive Modeling . . . 11
3 Overview of the GlucoGuide System 13 3.1 Challenges . . . 13
3.2 Research Questions . . . 14
3.3 The GlucoGuide Solution . . . 15
3.3.1 Food Classification . . . 16
3.3.2 Lifestyle Recommendation . . . 16
4 Food Classification for Diabetes 18 4.1 Design Principle . . . 19
4.2 Textual Feature Extraction . . . 22
4.2.1 Domain Knowledge based Extraction . . . 22
4.2.2 Machine Learning based Extraction . . . 23
4.2.3 Merge Textual Features . . . 23
4.3 Generating the Training Dataset . . . 24
4.3.1 Evaluation Methodology . . . 25
4.4 Model Selection and Evaluation . . . 25
4.5 Food Classification Using RandomForest . . . 27
4.5.1 Model Tuning . . . 27
4.5.2 Feature Importance . . . 30
4.5.3 Prototype . . . 30
4.6 Relationship to Previous Work . . . 31
4.7 Food Classification Future Works . . . 32
4.8 Conclusion . . . 33
5 Lifestyle Recommendation Framework 35 5.0.1 Data Aggregation . . . 35
5.0.2 Data Pre-processing . . . 36
5.0.3 Temporal-Weighted Regression (TWR) . . . 39
Challenges and Contributions . . . 39
TWR Cost Function . . . 40
Cost Function Optimization . . . 42
Online Parameters Tuning . . . 44
5.0.4 TWR Model Evaluation . . . 44
5.0.5 Model Postprocessing . . . 46
5.1 GlucoGuide Clinical Trial . . . 47
5.1.1 Adherence to Recommendations . . . 50
5.2 Relationships to Previous Works . . . 52
5.3 Conclusion . . . 52
6 Predicting Blood Glucose with Data Expansion 54 6.1 Blood Glucose Prediction: State-of-the-Art . . . 54
6.2 Clinical Data Expansion and Enhancement . . . 58
6.3 Artificial Lifestyle Feature Vectors . . . 59
6.3.1 L1 Predictions . . . 59
6.3.2 L2 Predictions . . . 61
6.3.3 L3 Predictions . . . 63
6.3.4 Assemble Predictors and Construct Feature Vector . . . 65
6.3.5 Feature Temporal Re-weighting . . . 65
6.3.6 Blood Glucose Labeling . . . 66
6.4 Empirical Evaluation . . . 66
6.4.1 Statistical Properties . . . 67
6.4.2 Prediction Capabilities Evaluation . . . 68
7 GlucoGuide Spin-off 71 7.1 Current Status . . . 71
7.2 Future Research Objectives . . . 73
8 Conclusions 75
Bibliography 77
A T2D Lifestyle Recommendations List 86
B Rewards and Fundings 97
Curriculum Vitae 98
List of Figures
3.1 GlucoGuide architecture. . . 15
4.1 Patients nowadays can easily use mobile devices to get the detailed information about food items (nutrient and textual information). Then, our classification model can generate recommendation labels on each food item. . . 19
4.2 Scan the barcode on a salad product to get its UPC code, then use the UPC code to retrieve nutrition and textual information from UPC database. Our classification model tries to classify this food item based on the nutrition and textual information. . . 21
4.3 Aggregating the nutrition features and textual features, and calculating the values of textual features using Levenshtein distance. . . 24
4.4 Classification accuracy for each model using 3 different feature vectors . . . 25
4.5 OOB error rate with different tree numbers in the forest . . . 28
4.6 Feature importance with respect to mean accuracy decrease. . . 29
5.1 T2D lifestyle recommendations framework. . . 36
5.2 Medical devices list in clinical trial . . . 37
5.3 Contour plots of Ridge (L2), Lasso (L1), and TWR . . . 43
5.4 MAE of blood glucose prediction for each patient using TWR with linear decay . . . . 46
5.5 Comparison of A1c and fasting blood glucose reduction between two groups, before and after the trial . . . 49
5.6 Estimated 1.23%A1creduction if a patient has 100% ATR . . . 51
6.1 CGM data of a 14-years old T1D patient, sampled every 5 minutes . . . 55
6.2 AR(12) prediction residual on a 14-years old T1D patient demo dataset prediction 56 6.3 ANN architecture for t + PH blood glucose used previous 20 minutes blood glucose readings, cited from the origin paper [1]. . . 57
6.4 The proposed three levels of lifestyle predictors used to predict after-meal blood glu-cose levels . . . 60
6.5 The correlation matrix of hourly step counts recorded in the clinical trial . . . 62
6.6 24 hours blood glucose trend, sampled every 15 minutes . . . 66
6.7 Distributions fitting (Weibull, Gamma, and LogNormal) on the blood glucose
levels of two datasets (the clinical trial sample and the artificial dataset (100
patients)). Two blood glucose histograms have very similar shapes. . . 67
6.8 Solid lines present the models enhanced with temporal weight (TW), dash lines
repre-sent the regular predictive models. We can see that the integration of temporal weights
improves the prediction performance for all models. Also, the prediction performance
increases with more training data for most models. . . 69
7.1 Users can use GlucoGuide mobile clients to conveniently log varieties of lifestyle
data and receive recommendations . . . 72
7.2 Log the diet data by snapping a photo of the meal and auto-estimate the
nutri-tion facts. A overall meal score is also generated to evaluate the whole meal. . . 73
7.3 Users can review and print all their data using GlucoGuide online logbook. . . . 74
List of Tables
4.1 Classification confusion matrix . . . 30
4.2 Food classification prototypes . . . 31
5.1 Health features used in clinical trial . . . 38
5.2 Prediction performance comparison of different regression models . . . 45
6.1 Health features of the 2 hours after-meal blood glucose artificial dataset . . . . 64
6.2 Descriptive percentiles and two fitted LogNormal distributions of blood glu-cose data in clinical trial and artificial dataset. . . 68
A.1 Recommendation List . . . 87
List of Appendices
Appendix A T2D Lifestyle Recommendations List . . . 86
Appendix B Rewards and Fundings . . . 97
Chapter 1
Introduction
Diabetes is a metabolic disease in which patients have abnormally high blood glucose. There
are two main types of diabetes: Type-1 and Type-2 Diabetes. Type-1 Diabetes (T1D) is a
disease in which the pancreas produces little or no insulin. As such, glucose builds up in blood
instead of being used for energy. Individuals with T1D need to inject insulin as prescribed.
Type-2 Diabetes (T2D), on the other hand, is a disease in which the pancreas does not produce
enough insulin, and/or the human body does not properly use the insulin it makes [2, 3]. There
is also a type of diabetes called Prediabetes, which refers to blood glucose levels that are higher
than normal, but not yet high enough to be diagnosed as T2D [2].
Diabetes, if not well-treated, will develop many long-term complications including heart
at-tack, stroke, amputations, and blindness. According to WHO 2013, 347 million people
world-wide have diabetes, and T2D patients comprise more than 90% of them. Thus, improving the
treatments of T2D is significant to patients’ condition and our society [2].
After a person is diagnosed with T2D, usually medications will be prescribed by doctors.
Also, a protocol called Self-Monitoring of Blood Glucose (SMBG) will be advised by
health-care providers to help the patient achieve proper blood glucose targets [2]. In fact, blood
glucose is affected by a large number of lifestyle and clinical factors, including what you ate,
how long ago you ate, your previously blood glucose levels, physical activity, mental stress,
ill-ness, sleep patterns, and so on [2]. Each factor can have different impact on a specific person’s
blood glucose and there could also be complex interactions among these factors.
1.1
Challenges and Barriers of Diabetes Management
Adopting and maintaining healthy lifestyle changes is highly challenging for T2D patients [4].
For example, the overwhelming complexity of carbohydrate or calories counting presents an
2 Chapter1. Introduction
often insurmountable obstacle for most T2D patients. Also, when the patient’s blood glucose
is high, it can be difficult to determine which factor(s) causes it. On the other hand, the
time-constraints for healthcare providers do not allow for 24/7 real-time monitoring and personalized
advice, leaving a patient in a potentially life-threatening situation.
The rapid development of mobile computing starts a new era of diabetes management.
Mobile apps and wearable medical devices have significantly facilitated diabetes management
regarding their usabilities. For example, it is possible now that patients can conveniently sync
their blood glucose readings from Bluetooth-enabled glucometers to their mobile apps and send
them to health providers via the Internet. Their health providers can log-in Web portal to review
and analyze their blood glucose readings. Such ubiquitous procedure is a revolution. However,
there are still two main challenges preventing the current mobile diabetes management systems
from reaching their full potential.
The first challenge is related to the system input, i.e., the complexities of lifestyle data
logging. Even utilizing the modern mobile diabetes system and wearable sensors, data logging
is still troublesome and time-consuming, especially for diet and glucose levels. For example,
most systems use food database searching to help patients record diet information. However,
to record every detail of a meal, patients need to search each food item in the meal and estimate
its serving and portion size, which makes diet recording a very time-consuming process. As
for blood glucose levels, continuous blood glucose monitoring (CGM) devices or finger-prick
based glucometers are mostly used to estimate glucose concentration from real blood samples,
which means testing blood glucose level is painful and costly [20, 59].
The second challenge is related to the system output. More specifically, most systems are
lacking evidence-based, personalized, and instantaneous feedback to patients’ diabetes
man-agement practices. Diabetic lifestyle data now are collected without being adequately
ana-lyzed. Some popular systems such as Glooko TM and Glucose Buddy TM, only log and plot
blood glucose and other lifestyle data, without data analytics on patient data to actively advise
and engage patients. A few others, such as WellDoc [5], do give patients personalized advice
but only prescribed by doctors who need to access the system to review their patients data.
That is in fact not practical when the data volume is huge and data structure becomes complex.
1.2
Our Solutions
A trend in healthcare analytics is taking advantage of machine learning models to discover
patterns from the large scale of clinical data and to aggregate medical domain knowledge from
a variety of sources. Specifically, predictive modeling, as an important component of machine
fore-1.2. OurSolutions 3
casting probabilities and trends. It could be utilized to facilitate the processing of patients’
data and allow patients and their health providers to interact in a more convenient and timely
manner.
To tackle the data input issue. We believe that machine learning technologies can be utilized
to facilitate lifestyle data input. For example, it is possible now that patients can take pictures
of a food item, and that food item can be recognized using predictive models such as deep
neutral networks. Then, we can use the food meta-data learned from machine learning models
to obtain detailed nutrition information from querying food databases.
Machine learning could also be used to enhance the outputs of diabetes management
sys-tem, i.e., learning of lifestyle data and output practical hidden patterns or knowledge.
Numer-ous research works have been proposed to use predictive models in diabetes diagnosis and risk
analysis [6, 7, 8, 9, 10, 11, 12, 13, 14, 15]. They aim to predict diabetes clinical diagnosis and
risk factors based on patients’ profile data. Another challenging research area is blood glucose
prediction. With the help of reliable blood glucose prediction models, patients would be able
to take actions proactively to stabilize their predicted blood glucose levels. Previous studies
have been focusing on the exclusive CGM (Continuous Blood Glucose Monitoring) data, and
achieve remarkable prediction accuracy [16, 17, 18, 19]. To elaborate, CGM is an advanced
way to measure glucose levels in real-time (or short sampling interval like 5 minutes)
through-out the day and night. In particular, glucose sensors are inserted under the skin to measure
glucose levels in tissue fluid. They are also connected to a transmitter that sends the
informa-tion via wireless networks. Such procedure mostly used in clinical treatments for T1D patients,
which are usually costly and publicly inaccessible.
As for T2D patients, we believe that the design principle of blood glucose prediction
frame-work should focus on the lifestyle data and discrete finger-prick blood glucose samples since
they are the essences of T2D self-management. Furthermore, the lifestyle data nowadays can
be collected cost-efficiently (comparing to the clinical data such as CGM data) using modern
mobile devices. The lower of the cost of lifestyle data collection makes it has the potential of
being expanded to big informative data.
In this thesis work, we propose, build, and evaluate an intelligent mobile diabetes
man-agement system, called GlucoGuide for T2D patients. GlucoGuide conveniently aggregates
varieties of lifestyle data collected via mobile devices/sensors, analyzes the data with
predic-tive models, and outputs the model outcomes as recommendations.
The most complicated part of self-management is diet management, and GlucoGuide aims
to address this crucial issue using classification models and mobile-camera-based automatic
data logging. The proposed classification model can categorize any food item into three
4 Chapter1. Introduction
model classification accuracy is around 95%, indicating this method is empirically effective
and reliable for food items recommendations.
A lifestyle-data-driven recommendations framework in GlucoGuide can output short-term
and personalized recommendations for lifestyle changes to help patients stabilize their blood
glucose level. This framework conduct predictive modeling on patients’ lifestyle data to predict
blood glucose levels. Each prediction iteration can also rank lifestyle factors in terms of their
importance or relevance. The data-driven recommendations regarding the important factor(s)
will be sent to patients.
To collect training data from real patients and evaluate the clinical effectiveness of this
framework, we have collaborated with Dr. Petrella’s health team to conduct a three-month
clinical trial on human subjects. Due to the high cost and complexity of trials on human, a
small but representative subject group is involved. Using the lifestyle data collected from this
group, the performance of our blood glucose prediction framework is similar to state-of-the-art
methods [20, 16] using clinical CGM data.
In terms of clinical effectiveness, two standard laboratory blood tests for diabetes are used
before and after the trial. The results are quite remarkable. Generally speaking, GlucoGuide
amounted to turning an early diabetic patient to be pre-diabetic, and pre-diabetic to
non-diabetic, in only 3-months, depending on their diabetic conditions before the trial.
Since the collected clinical dataset is relatively “small“ regarding its volume and
dimen-sions, our blood glucose prediction framework was possibly not converged. Meanwhile, we do
not have large scale of practical diabetic lifestyle datasets to explore the potential of our model
at this point. As such, we have designed an effective mechanism to expand and enhance this
clinical trial dataset. After the data expansion, we have obtained large scientifically controlled
artificial datasets for further studies on blood glucose predictions.
Specifically, we first use parametric statistical inference to find the properties of underlying
distributions and potential dependencies. We have also applied diabetic domain knowledge to
make certain assumptions on the data and determine all the well-known feature dependencies
and parameters. The unlabeled lifestyle datasets will be sent to AIDA (a very popular online
diabetes simulator) to generate blood glucose labels [75, 76]. Our evaluation results show that
this generation process is effective. Such artificial datasets can also be used for varieties of
machine learning empirical studies such as blood glucose warnings, missing value imputation,
data sparsity analysis, transfer learning, etc., as our on-going and future research works.
GlucoGuide now is a university spin-off, allowing us to collect a large scale of practical
diabetic lifestyle data and make potential impact on diabetes treatment and management. As
far as we know, diabetic datasets similar to ours are not publicly available at this point, thus, we
1.2. OurSolutions 5
The remaining chapters of the thesis are presented as follows: We first review the prior
rele-vant research and developments on mobile diabetes management system and diabetes modeling
using predictive models in Chapter 2. Then, our research question is defined in Chapter 3, as
well as the design principle of GlucoGuide system. The diet management sub-system and
food classification of GlucoGuide is explained in Chapter 4. Chapter 5 presents the proposed
diabetic lifestyle analytical framework and its empirical and clinical evaluation results. The
clinical data expansion and enhancement process is presented in Chapter 6.
The current research and development status of GlucoGuide spin-offand its future research
Chapter 2
Literature Review
In this chapter, we will first discuss the features of diabetic lifestyle data and how they can
be collected and managed via mobile diabetes management systems. Next, we will review
relevant machine learning researches on diabetes-related predictive tasks such as diagnosis and
risk analysis.
2.1
Mobile Diabetes Management System
Nowadays, mobile computing has been emerging as an integral part of daily activities. As
for their application in medical informatics, the technological advances could make medical
services and treatment overcome time and location barriers thus provide ubiquitous, real-time,
individualized medical treatments [21, 22, 23]. In fact, researchers have consistently shown that
such ubiquitous healthcare services could be utilized to enhance the quality of life for people
living with chronic illnesses (such as diabetes, heart disease, cancer, and so on.) [24, 22].
It is well known that the healthcare for T2D is mostly focused on lifestyle changes and
self-management, which are typically managed by increasing exercise, diet modification, and/or
medications/insulins adjustments. If blood glucose levels are adequately lower than certain
levels, medications such as metformin or insulin might not be needed.
In fact, self-management is often a challenge for T2D patients since the control is
con-tingent on numerous complex factors and behaviors. One promising solution is to integrate
ubiquitous healthcare services into diabetes self-management, which could bring more eff
ec-tive behavioral changes and continuous health monitoring [25].
2.1. MobileDiabetesManagementSystem 7
2.1.1
Features of Diabetes Lifestyle Data
Health features are aspects of the health conditions that need to be managed and monitored
to best control the chronic illness [26]. Smith and Schatz [26] identify 14 health features,
which are Access to care, Air quality, Blood pressure, Blood glucose levels, Depression, Diet,
Education, Heart rate, Medication, Physical Activity, Respiration, Stress, and Substance abuse
respectively. In terms of diabetes, the most relevant health features of lifestyle data are listed
as follows (other similar health features for diabetes can also be found in [24, 27, 5, 28]):
• Blood Glucose. Blood glucose level is the most important feature and the target variable
for diabetes [25]. This feature is typically collected via either finger-prick
glucome-ter or Continuous Glucose Monitor (CGM) [26, 29].The blood glucose readings can be
transmitted to mobile devices wirelessly or using USB port (some advanced glucometers
follow Bluetooth communication specification made by Continua Health Alliance). To
give an example, Cho et al. [29] employed mobile phone to collect blood glucose
mea-surements. Their results indicated good levels of participants’ satisfaction and adherence
using the mobile technologies to manage blood glucose levels. More conveniently, in the
future, we would image the appearance of wearable sensors measuring glucose levels
without actually taking blood glucose sample, such as Google’s prototype called “Smart
Contact Lens“ for measuring blood glucose levels.
• Diet. Diabetic patients need to delicately monitor carbohydrates intake to avoid
abnor-mal high/low blood glucose level or adjust insulin dosage (mostly for T1D patients).
Other nutrients information such as protein, fat, sodium could also affect their blood
glucose level. Researches have also shown that mobile nutritional support is effective
on diabetes management [26, 29]. Nowadays, diabetes patients could conveniently use
advanced technologies such as barcode scan, Optical Character Recognition (OCR), or
food database searching to conduct diet management. Shortly, with the rapid
develop-ments of advanced machine learning technologies, especially for deep learning, meals
could be recorded via image or voice recognition reliably.
• Physical Activity. Physical activity is typically measured by exercise intensity and
dura-tion [25]. Step counts tracking (pedometer) is another convenient method for estimating
the exercise calories consumption. It is proved that moderate or vigorous exercises could
increase the insulin sensitivity of cells. Thus, keeping track of exercise is important to
T2D patients. Stuckey [30, 31] et al. conducted The Diabetes and Technology for
In-creased Activity (DaTA) study to test the effectiveness of a lifestyle intervention driven
8 Chapter2. LiteratureReview
and weight using the mobile devices and wireless communication technologies. Their
research results showed that self-monitoring of the risk factors for metabolic syndrome
(such as hypertension and dysglycemia) and increased physical activity improved the
participant’s cardiovascular disease risk profile. Furthermore, with the help of hourly
step counts information and aerobic step counts, future systems can make more specific
and intelligent recommendations to improve patient’s self-management.
• Access to Care. Access to care mainly refers to the capabilities of being able to
commu-nicate with the health providers in the case of questions or emergency. This can be done
via voice, messages, E-mails between mobile devices and servers [29, 30, 22, 32, 33, 34].
This feature is important for all chronic self-management systems. Patients are motivated
to upload their data since they know that all data could be carefully taken care by health
providers, and they would receive valuable feedback. The location-awareness mobile
device can also report patient’s location to health provider to deal with the emergent
situations.
• Blood Pressure. Blood pressure can be measured using wireless communication enabled
sphygmomanometer or other wearable devices such as Fitbit.
• Weight. Weight is normally related to BMI measurement. Bluetooth-enabled scales can
conveniently record weight data and communicate with mobile phones.
• Education. Education is important for diabetes patients since self-management involves
many complex factors and most diabetic patients lack such knowledge. Mobile devices
have been proven very useful in this area [26]. However, according to the best of our
knowledge, personalized and real-time education is still a big challenge and largely
un-explored.
• Substance abuse. Substance abuse normally refers to tobacco and alcohol. Mobile
de-vices could use message, reminder, or alert functionality to encourage smoking cessation
and reduction in alcohol.
Current mobile diabetes systems are designed to facilitate the management of these health
features. On their clinical effectiveness, Liang et al. [35] reviewed 22 clinical trials that
as-sessed the effect of mobile phone intervention on blood glucose control of patients with
dia-betes. Most results show that significant reduction in glycosylated hemoglobinA1cvalues and
/or other health outcomes in diabetes patients when comparing the mobile phone intervention
2.1. MobileDiabetesManagementSystem 9
represent the typical research methodologies and evaluation procedure of ubiquitous diabetes
management research:
• Tang et al. [27] evaluated an online disease management system supporting patients with
uncontrolled T2D. It is a randomized controlled trial of 415 patients with T2D. Patients
in the intervention group (INT) need to upload their glucometer, nutrition, exercise logs,
and insulin record. Nurses and physicians remotely provide glucose summary report,
personalized text and video, and diet advice to INT group. Its clinical trial results show
that INT group has significantly reducedA1c at six months compared to usual care (UC)
(-1.32% vs. -0.66%). While for the 12 months duration, the difference was not very
significant (-1.14% INT vs. -0.95% UC). According to their analysis, the main potential
reason is that UC group could have stimulated behavioral changes due to “Hawthorne
effect“ (changes influenced by being observed in a study).
• Quinn et al. [5] conducted a similar 3-month study. The INT group received mobile
phone based software which provides real-time feedback on patients’ blood glucose
level, medication regiments, incorporated hypo- and hyperglycemia treatment algorithm
and other requested additional feedback. The system sent computer-generated logbooks
with suggested treatment plans to INT group. They claim that adults with T2D achieved
statistically significant improvements inA1cas well as satisfaction levels.
• Noh et al. [36] designed and developed a web-based ubiquitous information system for
diabetes education. They compared the INT group using this system with conventional
education for diabetes patients. Their results show that blood glucose level andA1c are
significantly decreased over time in the INT group but not in the control group.
• Spring et al. [37] argued that some patients exhibit multiple chronic disease risk
behav-iors. They believe that the current literature provides little information about advice that
can maximize simultaneous health behavior changes. They randomized 204 adults with
observed unhealthy behaviors such as saturated fat and low fruit and vegetable, high
sedentary leisure time, and low physical activity. They were requested to use mobile
devices to record and upload their daily activities. The increase fruits/vegetables and
de-crease sedentary leisure treatments improved more than the other three type of treatments
(P ≤0.001). Specifically, daily fruit/vegetable intake increased from 1.2 servings to 5.5
servings, sedentary leisure decreased from 219.2 minutes to 89.3 minutes and saturated
fat decreased from 12.0% to 9.5% of calories consumed.
• In the pilot-controlled clinical trial conducted by Katz and Nordwall [34], they utilized
pro-10 Chapter2. LiteratureReview
cess. More importantly, their system translated scientifically supported knowledge for
chronic disease management into action by providing easily followed daily coaching
using the patients’ data. It is a data-driven system because the feedback messages are
selected by the system based on the patient’s historical data. However, their feedback
is simply generated using domain knowledge and needed human involvement to review
the data and provide personalized feedbacks. We argue that such process is not feasible
when the data scale become large.
We have surveyed state-of-the-art products and applications in the industry. By reviewing their
product specifications, we can conclude that all thehealth featuresmentioned above are
man-ageable via nowadays’ mobile technologies and Web technologies. Most recently, IT giants
such as Google, Apple, and Microsoft have also released their mobile health platforms for
fit-ness and chronic diseases managements. Take ResearchKit for an example, which is an open
source framework introduced by Apple to enable efficient lifestyle and clinical data
collec-tion and aggregacollec-tion. Researchers can easily create visual consent flows, conduct real-time
dynamic active tasks and survey using a variety of customizable modules provided by
Re-searchKit. Also, since ResearchKit works seamlessly with HealthKit, allowing iOS apps that
provide health and fitness services to share their data with each others. Researchers thus can
access even more relevant lifestyle data for their studies, such as daily step counts, calorie use,
and heart rate, etc.
Although the clinical trials and products mentioned above show that it is technically
feasi-ble to improve diabetes self-management using mobile devices and Web technologies.
How-ever, most systems are very similar in their functionalities and implementations, and there
are obvious gaps between the evidence-based recommendations and their current implemented
functionalities. Furthermore, in spite of the effectiveness of these clinical trials, most of them
are not cost-effective. Participants in the clinical trials still take large efforts to synchronize
their lifestyle data. Health providers on the server-side need to routinely check and review
pa-tients’ data and provide feedback. As such, we believe it is still very challenging to design and
develop an intuitive, intelligent, and interactively ubiquitous diabetes management system.
Predictive models, as an important component of machine learning, could be utilized to
facilitate the data processing and allow patients and their health providers interact in a more
convenient and timely manner. Researchers have been exploring the application of predictive
models in diabetes domain for nearly two decades. In the next section, we will discuss how
2.2. DiabetesRisk andDiagnosisUsingPredictiveModeling 11
2.2
Diabetes Risk and Diagnosis Using Predictive Modeling
Predictive modeling, also can be called supervised learning, is a process used in predictive
analytics to create one or multiple models with forecasting probabilities and trends. It has
two main components: Classification and Regression. Classification aims to categorize data
entries into discrete class labels (e.g., Spam vs.Non-Spam), with minimum classification errors
subject to applicable constraints. Regression tries to predict continuous values such as stock
price, temperature, etc. The overall performance of regression is usually measured by mean
absolute error or mean squared error.
Diabetes risk and diagnosis prediction are typically considered as classification tasks,
clas-sic classification framework such as Support Vector Machine (SVM) [6, 10, 15], Decision
Tree [12], RandomForest [14], Neural Networks [9], Na¨ıve Bayes [11] are widely employed.
Training datasets are focused on clinical diagnoses and patient’s profile data, including
pa-tients’ family history, age, race and ethnicity, weight, height, waist circumference, body mass
index (BMI), hypertension, diagnosis code, etc. Once classification models are well-built, it is
clearly to predict and identify the important rules and features causing diabetes disease.
Yu et al. [10] built SVM models on patient data from the 1999-2004 National Health and
Nutrition Examination Survey (NHANES). They designed two classification schemes:
Clas-sification Scheme I (diagnosed or undiagnosed diabetes vs. pre-diabetes or no diabetes) and
Classification Scheme II (undiagnosed diabetes or prediabetes vs. no diabetes), and achieved
receiver operating characteristic (ROC) curve, were 83.5% and 73.2%, respectively. Nahla et
al. [15] used an additional explanation module, turning the “black box“ model of an SVM into
an intelligible representation (ruleset). Evaluation results on a real-life diabetes dataset show
that their intelligible SVMs achieve with the prediction accuracy of 94%. Polat et al. [6] have
used Generalized Discriminant Analysis to discriminant features between healthy individuals
and patients (diabetes). Then, they built LS-SVM to classify diabetes dataset. The proposed
system called GDALS-SVM and obtained 82.05% classification accuracy using 10-fold cross
validation. Similar research classification works have also been found in the literature using
Decision Tree [12], Artificial Neural Network (ANN) [9], and Na¨ıve Bayes [11].
Li and Zhou in [14] argued that if we can learn models in the presence of a large amount of
undiagnosed samples, the heavy labeling burden on the medical experts could be released.
They proposed a semi-supervised learning algorithm named Co-Forest. It extends the
co-training paradigm by using a well-known ensemble method named Random Forest, which
enables Co-Forest to estimate the labeling confidence of undiagnosed samples and produce
the final hypothesis easily. Their diabetes case studies show that undiagnosed samples were
12 Chapter2. LiteratureReview
performance via learning only a small amount of diagnosed samples by utilizing the available
undiagnosed samples.
Although the diabetes diagnosis and risk analysis are well-studied using predictive models,
we argue that more short-term and actionable predictive tasks could be performed. For
exam-ple, predictive models could be used to learn the knowledge from dietitians and then provide
food guide for T2D patients. More advanced, given sufficient training data, predictive models
should be able to discover which lifestyle factor has the largest influence on the abnormal blood
glucose level.
In the next chapter, we will further discuss our research questions regarding the challenges
and barriers of current diabetes self-management and how predictive models can be applied to
Chapter 3
Overview of the GlucoGuide System
In this chapter, we will further discuss the main challenges of current mobile diabetes
manage-ment systems. Next, we will compose our research questions regarding the solutions to these
challenges via applying machine learning technologies and mobile computing.
3.1
Challenges
Based on the remarks of literature review and our preliminary studies, we think there are two
main challenges for current mobile diabetes management systems. The first one is the
com-plexities of lifestyle data input. The second one is the lacking of evidence-based lifestyle
recommendation for patients to effectively stabilize their blood glucose. These two issues are
in fact connected and affected by each other. The ease of data recording enables more and
better quality of training data from patients for applicable predictive models to generate better
results. On the other hand, the irrelevant or inaccurate data input will certainly commit errors
and noise to further data analysis. The output of predictive models, as potential personalized
patterns or knowledge, could be incentives for users to record more qualified data.
Most lifestyle data nowadays can be automatically captured via a variety of sensors (such
as glucometers, pedometers, blood pressure monitors, etc.). Smart wearable sensors like Fitbit
products can also collect comprehensive health data about your body, especially for your
phys-ical activities. However, for diabetes patients, logging diet and glucose level are still relatively
difficult. As discussed before, machine learning technologies such as most recent deep learning
can be utilized to help patients with diet and blood glucose input. For example, it is possible
now that patients can take pictures of a food item, and that food item can be recognized
us-ing deep neutral networks. Then, we can query the meta-data about that food item in a food
database to get its nutrition information.
14 Chapter3. Overview of theGlucoGuideSystem
How to tackle the second challenge is the focus of this thesis work. We aim to collect
and analyze lifestyle data using predictive models. Based on the model outcomes,
evidence-based, personalized, and timely recommendations could be generated to guide patients’
self-management practices. Such recommendations are closely related to patients’ data, thus can
effectively evaluate their performance and help patients creating more specific and personalized
action plans. On the other hand, recommendations can also be viewed as incentives of data
recording and motivate patients to record and upload more qualified data.
3.2
Research Questions
We set the focus of this thesis on T2D patients since it comprises more than 90% of the diabetic
population [25]. Thus, improving the treatments of T2D is significant to patients’ condition
and our society. We believe predictive models could be applied to the two most important and
complex components of T2D self-management: 1) Diet management and 2) Blood glucose
monitoring and predictions. Specifically, predictive models could be used to analyze food
data and categorize each food item into different recommendation levels for patients. More
intelligently, predictive models could also be used to predict blood glucose level and identify
what factor(s) causes abnormal blood glucose levels. Since T2D patients usually do not use
CGM devices, our blood glucose prediction task will focus on lifestyle data and
fingerstick-based blood glucose samples.
As such, we propose three research questions or hypotheses as follows:
• Can we use classification models to generate real-time food guideline to help
pa-tients proactively manage their diet?
• Can we predict T2D patients’ blood glucose level merely based on lifestyle data and
discrete fingerstick-based blood glucose samples?
• Can we provide clinically effective lifestyle recommendations based on the outcomes
of blood glucose prediction?
To answer these research questions, we propose, build, and evaluate an intelligent mobile
di-abetes management system, called GlucoGuide for T2D patients. GlucoGuide conveniently
aggregates varieties of lifestyle data collected via mobile devices, analyzes the data with
pre-dictive models, and outputs recommendations.
3.3. TheGlucoGuideSolution 15
3.3
The GlucoGuide Solution
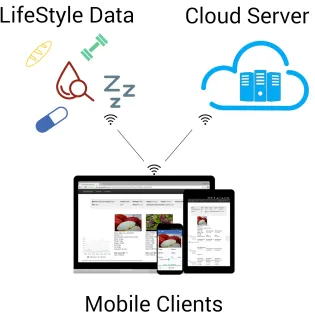
GlucoGuide contains three sub-systems, as shown in Figure 3.1, including the 1) Lifestyle data
collection and preprocessing, 2) GlucoGuide mobile clients, and 3) GlucoGuide Engine. Their
design and development processes involve many up-to-date technologies.
The GlucoGuide mobile clients has been designed and built on the latest Google Android
and Apple iOS systems, aiming to provide excellent user experience powered by our
well-designed user interface and information visualization technologies. One design goal here is to
reduce the burden of lifestyle data input in GlucoGuide. For example, we have been designing
and implementing the camera-based auto logging of food items and glucometer readings. It
acts as a bridge connecting patients and GlucoGuide Engine. The mobile clients collect raw
lifestyle data, preprocess and upload them securely to GlucoGuide Engine where data analysis
takes place. Patients can also use the mobile clients to receive and review recommendations,
setup different kinds of reminders, etc.
Figure 3.1:GlucoGuide architecture
16 Chapter3. Overview of theGlucoGuideSystem
a computer cloud. It consists of a centralized database, machine learning engines, and a web
portal, which allows patients and our health teams to log-in to review the visualized health data
and online logbook. The core function of GlucoGuide Engine is to analyze the uploaded data
and generate recommendations based on patients’ data using predictive models.
3.3.1
Food Classification
The first type of recommendation is proactive diet guideline. Among all the components of
self-management, the most important and complicated part is the diet management, requiring
T2D patients restrict and accurately count the amount of carbohydrates, protein, fat, and so
on [25]. Since there are diverse foods available at various places (supermarket, restaurant,
home-made, etc.), for most T2D patients (especially for prediabetic patients) often feel
frus-trated and troublesome in composing effective and diabetic-friendly meal plans to achieve their
daily carbohydrates goals. They do need assistance to help them determine what kinds of food
items are suitable for their diabetic conditions or not. Ideally, patients should be able to query
concerning the recommendation of any food items in nearly real-time.
We model this problem as a binary or multinomial classification problem, predictive models
for classification thus can be employed to categorize any food items into its corresponding
recommendation level (such as this food item should be chosen more often or chosen less
often).
To achieve this goal, we first construct a comprehensive food feature vector via extracting
nutrient and textual features from training food datasets. Then, three food recommendation
labels: “Choose More Often“, “In Moderate“, and “Choose Less Often“ are designed as class
labels. Next, we explore and evaluate several state-of-art predictive models with different
bi-ases and structures for the food classification task. According to the results of our empirical
study, we find that tree-based classification models outperform others in this practical problem
context. The best prediction accuracy of tree-based models could reach to around 95%, which
is a very promising result indicating the proposed idea of using classification model for diabetic
food classification is empirical effective. See Chapter 4 for details.
3.3.2
Lifestyle Recommendation
The second type of recommendation is related to lifestyle activities (such as diet, exercise, etc.)
and derived from the outcomes of blood glucose prediction.
If the updated lifestyle data indicate that a patient is in emergent or dangerous situations,
such as abnormally high or low blood glucose levels for longer period of times, GlucoGuide
3.3. TheGlucoGuideSolution 17
If patients’ lifestyle data do not present emergent or dangerous situations as above, those
data will be accumulated. A few times in a week, a proposed predictive framework called
temporal-weighted regression (TWR) will be deployed on our server to discover correlations
between the recent lifestyle data and the blood glucose levels for each patient. Such
correla-tions will be framed in natural language templates (aligned with CDA guidelines) and sent to
patients’ mobile devices as recommendations. As patients’ data are different, the
recommen-dations are also personalized.
To evaluate the performance and the clinical effectiveness of this framework, we conducted
a three-month clinical trial on human subjects. Due to the high cost and complexity of trials on
human, a small but representative subject group was involved. We empirically evaluated the
TWR framework and showed that the prediction performance of TWR is similar to the
state-of-the-art [16], using the collected lifestyle data and discrete blood glucose samples. Furthermore,
two standard laboratory blood tests for diabetes were conducted on patients before and after
the trial. The results were quite remarkable with over 90% confidence levels in the significance
test. In sum, GlucoGuide could be amounted to turning an early diabetic patient to be
Chapter 4
Food Classification for Diabetes
Effective diet management requires T2D patients restrict and accurately count the amount of
carbohydrates, protein, fat, and so on. T2D patients (especially for prediabetic) often feel
frustrated and troublesome in composing efficient and diabetic-friendly meal plans to achieve
their daily carbohydrates goals.
Most diet management tools for T2D patients only provide basic meal recording and
nutri-ent visualization functionalities, such as food database searching, calories counting, etc. The
primary barrier of these tools is the lack of diet guideline/assistance for T2D patients, which
is typically provided by dietitians with a costly (either patients’ own time costs and/or
gov-ernment/insurance company medical costs) and time-consuming consultation process. In fact,
T2D patients do need such assistance in a more convenient and timely manner to help them
decide what kinds of food items are suitable for their diabetic conditions or not, especially for
those home-made food items.
As far as we are concerned, predictive models can be utilized to overcome this challenge
and proactively guide patients in their food selection. More specifically, they can be employed
to determine whether a food item should be chosen more often or less more.
We define this problem as a multinomial classification task. As for this problem, we first
construct a comprehensive food feature vector and extract nutrient and textual information from
two different training food databases. Then, three food recommendation labels: “Choose More
Often“, “In Moderate“, and “Choose Less Often“ are designed as class labels.
Next, we explore and evaluate several state-of-art predictive models with different biases
and structures for the food classification task. According to the results of our empirical study,
we find that tree-based models outperform others in this practical problem context. The best
prediction accuracy of RandomForest reaches around 95%, which is a very positive result
indi-cating the proposed idea of using classification models is promising. Furthermore, we have also
explored the feature importance and instance proximity matrix of generated RandomForest.
4.1. DesignPrinciple 19
More details about this empirical study can be found in Section 4.3.
We have deployed the fine-tuned classification model in the GlucoGuide mobile clients,
along with a comprehensive food database and food UPC scanning technologies. As such,
T2D patients could ubiquitously and conveniently access any food items in the database with
the help of model-generating food recommendation labels.
The rest of this chapter is organized as follows: Section 4.1 describes the design principle
of the proposed food classification tool, Section 4.2 presents the construction of food feature
vector, Section 4.3 describes the classification models selection, evaluation methodology, and
its results. The last two sections discuss the relationships to previous works and conclusions.
4.1
Design Principle
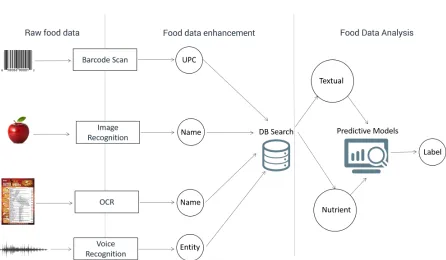
Figure 4.1: Patients nowadays can easily use mobile devices to get the detailed information
about food items (nutrient and textual information). Then, our classification model can
gener-ate recommendation labels on each food item.
The design principle of our food classification tool is shown in Figure 4.1. With the
assis-tance of many advanced HCI technologies, patients nowadays can use their mobile devices to
first obtain the meta-data of food items (UPC code, entities, keyphrases, categories, etc). Then,
20 Chapter4. FoodClassification forDiabetes
information about the food items. By utilizing well-trained classification models, our tool can
output recommendation labels for users.
Numerous food databases are available in the health and nutrition industry. They
typi-cally have different characteristics and scales in terms of dimension and volume. For example,
Canadian Diabetes Association (CDA) maintains a food database with only three nutrition
fea-tures while a large scientific food database provided by Canadian Nutrition File (CNF) has
more than 150 nutrition features. However, most of these food databases do not provide food
recommendation to T2D patients.
The food database used in our tool contains 65,000+popular North-American food items
(a commercialized food database), and it is a very comprehensive database with each item
has its food name, category, sub-category, and 18 nutrient attributes. Also, this is the target
dataset for the food classification task. Patients can search this food database to record detailed
information about their diet. To facilitate the database search, we designed several interactions
for users to input food keyword. They can type the keywords (such as “bagel“ or “starbucks
coffee“) using a soft keyboard or using the voice dictation to speak out the keywords. More
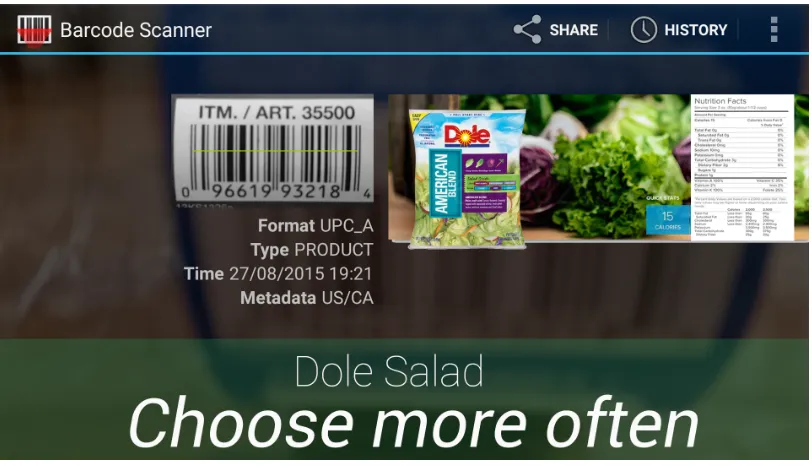
conveniently, we employed barcode scan technologies to help patients scan the food UPC code
(Figure 4.2) and retrieve food nutrition and textual information.
Our training datasets are two diabetic food databases, each food item in the databases has
been labeled by dietitians and nutrition experts. In particular, one training dataset is provided
by CDA [2] containing around 500 most common food items in Canada. CDA classifies each
food item to be “Choose More Often“ or “Choose Less Often“ (e.g., binary labels) as a food
guidance for diabetic patients. Another one is provided by Food PickerTMcontaining more than
13,000 food items. Each food item has three class labels: “Choose More Often“ , “In
Mod-eration“, or “Choose Less Often“ (e.g., muti-nominal labels). Note that these two databases
are collected from two different data sources, with different features, food items, and
label-ing strategies. Thus, the classification model to be learned could absorb more comprehensive
domain knowledge via such data aggregation.
Next, we construct the food feature vector for classification. Ideally, a large feature vector
is desirable to characterize food items comprehensively. Based on the properties of food, we
defined two types of features: nutrition features and textual features.
In particular, nutrient features characterize a food item via its nutrition attributes, such as
carbohydrate, fat, protein, sodium, etc., which are costly but accurately calculated by numerous
nutrition laboratories worldwide. Most food databases provide nutrient information by default.
The second feature is related to a food item’s textual information, such as category, subcategory,
name, etc. This kind of feature can also be very useful for classification especially when the
4.1. DesignPrinciple 21
will be described in Section 4.2.
Once the training datasets are prepared, we then need to select the classification model(s)
for the classification task via empirical evaluations. The best fit model will be deployed on
GlucoGuide mobile clients to classify food items.
Figure 4.2: Scan the barcode on a salad product to get its UPC code, then use the UPC code to
retrieve nutrition and textual information from UPC database. Our classification model tries to
classify this food item based on the nutrition and textual information.
With this tool, patients can conveniently track and review their daily nutrition intakes. More
intelligently, the embedded model can guide patients in their food selection. Here is an example
illustrating how T2D patients could use this tool. Suppose a patient is purchasing groceries in
a supermarket and having difficulties in choosing a food product. He/she can then open our
tool to scan the barcode of the product (such as Dole Salad) and get its nutrient and textual
information. Then, our model can output the color-coded class label to guide the patient about
22 Chapter4. FoodClassification forDiabetes
4.2
Textual Feature Extraction
We believe that a food item can not only be classified by its the nutrient features but also by its
textual features as supportive information. As such, we define the full feature vector of a food
data instance as:
F =[N,T]
where N represents the nutrition feature vector and T represents the textual feature vector.
Since the values of nutrition featureN are already known in both training food databases, how
to extract textual features and generateT is the main component of our feature extraction task.
In particular, nutrition features are obtained straightforward from the nutrition label. Once
we have obtained the nutrition features of food items, we can utilize some state-of-art
clas-sification models without taking any domain knowledge into consideration. On the contrary,
constructing the textual features do require domain knowledge and specifically-designed
fea-ture extraction strategies.
We choose to extract textual features mainly from the CDA food database since it is an
official food database [2]. In other words, it provides the most authoritative textual information.
Given the food vocabulary vector V of CDA’s training food database, each dimension
cor-responds to phrasewt fromV. Typically, the dimension of the vocabulary is large. To reduce
the dimension size, we replace it with a subset of keyphrases vectorK. Note that we only use
1-word or 2-word keyphrases such as “whole wheat“, “low fat“, and “sweeten“, etc., appear in
the food name.
The next step becomes how to extract the important keyphrases existing in the food
vocab-ulary vectorV. We proposed two approaches to generate the keyphrases vectorK to achieve
this goal.
4.2.1
Domain Knowledge based Extraction
Human labeling is an effective approach to extract keyphrases, although it could be very
time-consuming and expensive. Thus, with the assistance of our medical team, we identified a
human-labeled keyphrase list kh,h ∈ {1, . . . ,H} via thoroughly and delicately searching in
CDA literature and its official diet guideline [2].
However, the human extracted keyphrase list could not be comprehensive enough. To
en-rich the human-labelled keyphrase listKh, machine learning based feature extraction will also
4.2. TextualFeatureExtraction 23
4.2.2
Machine Learning based Extraction
We have employed the Na¨ıveBayes learning to extract the keyphrases, which is widely used
in document classification. The influence of each phrase in a food item was measured with
respect to its class to discover the most important/informative keyphrases.
The training food items in CDA database provide binary class labels. To simplify the
format, we define the class “Choose More Often“ as c0 and “Choose Less Often“ as c1. We
treat each food itemias a documentdi, which is a binary vector over the vocabularyV. Then,
we characterize the probability of food item with its class using multi-variate Bernoulli event
model [38, 39] (following the Na¨ıve Bayes assumption):
P(di|cj)=
|V|
Y
t=1
(BitP(wt|cj)+(1−Bit)(1−P(wt|cj))). (4.1)
whereBit ∈ {0,1}indicates whether phrasewt appears at the dimensiontof food itemdi. Then,
we build a Na¨ıveBayes classifier attempting to find the classcj that maximize the probability
P(di|cj).
Given the CDA training dataD={d1,d2, . . . ,d|D|}, we calculate the binary-class conditional
phrase probability as:
P(wt|cj)=
1+P|D|
i=1BitP(cj|di)
2+P|D|
i=1P(cj|di)
. (4.2)
Note that a Laplacean prior in Equation 4.2 is calculated in case some phrase counts are zero.
Having such phrase probability, we define a keyphrase selection metricQt as:
Qt =
P(wt|c0)
P(wt|c1)
. (4.3)
By intuition,Qtindicates how likely the phrasewtassociated with classc0compared to classc1.
In another phrase, any phrase with a largeQt value means it is a class discriminative keyphrase
with respect to classification. We thus choose phrasewt as a candidate keyphrasekm(note that
each keyphrase here contains only one phrase) if its Qt is beyond a predefined threshold (5th
quintile was chosen in this experiment). By iteratively performing the above calculations, we
can build a machine-generated keyphrase listkm,m∈ {0, . . . ,M}.
4.2.3
Merge Textual Features
The last step is to append the extracted keyphrase vectorKmlist to the existing human labeled
keyphrase list Kh. We first compare each keyphrasekm with all human labeled keyphrase Kh.
24 Chapter4. FoodClassification forDiabetes
and move to the next one on the list. Here we employ a metricQ(km,kh) defining such similarity
betweenkmand keyphrasekh:
Q(km,kh)=1−
L(km,kh)
lmax(km,kh)
,0≤ Q(km,kh)≤ 1. (4.4)
where L(w,k) is the Levensthein distance [40, 41] betweenkm and kh. The lmax(km,kh) is the
maximum string length between km and kh. As such, for each phrase km, we calculate the
maximal similarityQ(km,kh)max,h∈ {1, . . . ,H}. IfQ(km,kh)maxis below a predefined threshold,
we will consider km as a newly discovered keyphrase and append it to the human-labelled
keyphrase listKh.
4.3
Generating the Training Dataset
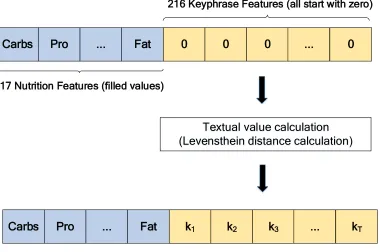
Carbs Pro ... Fat 0 0 0 ... 0
17 Nutrition Features (filled values)
216 Keyphrase Features (all start with zero)
Textual value calculation (Levensthein distance calculation)
Carbs Pro ... Fat k1 k2 k3 ... kT
Figure 4.3:Aggregating the nutrition features and textual features, and calculating the values of textual
features using Levenshtein distance.
After merging the two keyphrase listsKhandKm, we can generate the textual feature vector
4.4. ModelSelection andEvaluation 25
0.6 0.65 0.7 0.75 0.8 0.85 0.9 0.95 1
J48 RandomForest LibSVM LogisticRegressionNaiveBayes
Classification Accuracy
Food classification using 3 type features T N T+N
Figure 4.4:Classification accuracy for each model using 3 different feature vectors
nutrition feature vectorN and obtain the complete structure of feature vectorF, as shown in
Figure 4.3.
The complete feature vector F has 17 nutrient features and 216 textual features; each
nu-trition feature Ni represents a nutrient element and each textual feature Tj, (0 ≤ Tj ≤ 1)
represents the keyphrase similarity. The value of Tj is calculated by measuring the maximal
similarity between each keyphrase featureTj and all the subsequences whose length less than
three words of the food name. Such calculation process is similar to Equation 4.4.
After the feature extraction and data preprocessing, the training dataset (including 233
fea-tures and 13,260 data instances) is ready for the classification task.
In this section, we will discuss the classification model selection and evaluation.
4.3.1
Evaluation Methodology
4.4
Model Selection and Evaluation
Different classification models have different cost functions, structures, and biases. As far as
26 Chapter4. FoodClassification forDiabetes
and experimental process. Given the characteristics of this food classification problem, we
have chosen five popular classification models as candidates: J48 [42], RandomForest [43],
LibSVM[44],Na¨ıveBayes[45], andLogisticRegression[45].
Next we will describe the experimental settings for these classification models. Finding
the optimal parameters for each model is a necessary but time-consuming process. For each
model, we conduct ten fold cross-validation first with different parameter settings to ensure it
could reach the potential on this dataset. For example, all tree-based models were pruned with
confidence level set to 0.25 [42], the number of trees in the RandomForest was set to 10, the
kernel of LibSVM was set to the RBF kernel, the standard classificationaccuracywas selected
as the main performance measurement. etc.
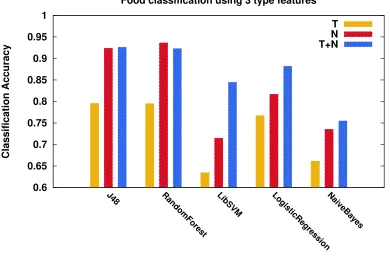
In addition, we evaluate each model using three different feature sets (i.e., textual features
T, nutrition featuresN, and comprehensive features (T + N)). As such, we can empirically
evaluate the different combinations of feature vectors and classification models then find the
best one.
After the ten folder cross-validation with optimal parameter tuning, we obtain the model
accuracies, as shown in Figure 4.4. We can see that all models have the worst classification
accuracy using only the textual feature vector (yellow bars) and have much better accuracy
using the nutrition feature vector (red bars). Furthermore, by integrating the textual and
nu-trition feature vectors, the accuracy is significantly improved for almost all models except for
RandomForest (blue bars). The classification precision and recall have the similar trend as the
overall accuracy thus we do not depict them in here.
Note that J48 and RandomForest outstand from other candidates on this dataset. They are
able to obtain around 95% prediction accuracy using the combination of nutrition and textual
features (Figure 4.4). One possible explanation could be that the tree models are the most
suitable model for mimicking the dietitians’ reasoning/classification process. Also according
to Kotsiantis [46], tree models are sequential models, which logically combine a sequence of
simple tests; each test compares a numeric attribute against a threshold value or a nominal
at-tribute against a set of possible values. In that way, they can closely resemble human reasoning
and are easy to understand. As a result, the tree models have been discovered to be the best
model for the food classification task in this problem domain.
Also in this experiment, we find that textual features based food classification is also
promising, as it can obtain about 80% classification accuracy using tree models. Thus, we
believe that textual features based classification could be useful especially when the nutrition
features are not accessible or available. For example, if the nutrition information of a food
item is unknown, patients can still use modern HCI technologies such as barcode scan or OCR
4.5. FoodClassificationUsingRandomForest 27
conduct classification tasks on the text-only test instances with reasonable good prediction
ac-curacy.
In sum, in this empirical study, we find that RandomForest model is the best-fit model
among all the candidates. Thus, we can conduct further empirical studies using the RandomForest
model.
4.5
Food Classification Using RandomForest
RandomForest [43] is a very powerful and comprehensive classification model. It is a
combi-nation of randomly generated classification trees. For each test instance, each tree in the forest
generates a class label and the final class label is the one gets the most “vote“. RandomForest
has many advantages, including the generation of an internal unbiased estimate of
general-ization error (out-of-bag error), feature importance estimation, case proximities, and handling
large scale of data, etc.
4.5.1
Model Tuning
In RandomForest, each tree is generated using a different bootstrap sample from the original
data sample. About one-third of the cases are left out of the bootstrap sample and not used in
the tree construction as the test set. In this way, a test set classification is obtained for each
case in about one-third of the trees. The proportion of times the estimated class is not equal
to the true class averaged over all cases is called the out-of-bag (OOB) error estimate. As
such, RandomForest typically dose not require cross-validation or separate test datasets to get
unbiased performance estimation [43].
RandomForest has two importance parameters to be tuned. The first one is the number of
features randomly sampled as candidates at each split, and the second parameter is the number
of the trees in the forest.
We used grid searching to tune the first parameter, i.e., the number of feature candidates,
started with 15. We set the inflation/deflation rate to 1.5. For each tuning iteration, the OOB
error estimation is compared with the previous iteration until converged (improvement less
than 0.05). In this experimental context, we find that the optimized feature number is 73.
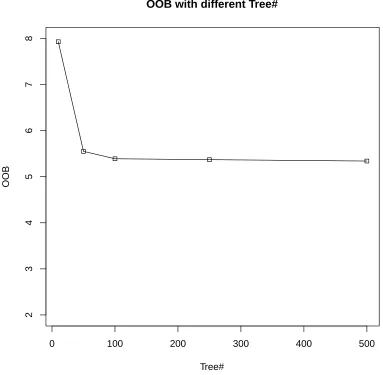
As for tuning the number of trees in the forest, we investigated the OOB with 50, 100,
250, 500, 1000 trees, as shown in Figure 4.5. The feature candidate number was set to 73,
as discussed above. As we can observe from Figure 4.5, the OOB error rate converges at 100