Available online: https://edupediapublications.org/journals/index.php/IJR/ P a g e | 1819
Comparing and Analyzing the Levels and Dimensions of
Emotional Intelligence of Higher Secondary Students of Manipur
Ananta Kumar Jena & Huidrom Debala Devi
Assistant Professor, Department of Education, Assam University, Silchar-788011 Email:akjenaaus@gmail.com
Ph.D. Research Scholar, Department of Education, Assam University, Silchar-788011 Email:debaladevihuidrom@gmail.com
Abstract
Emotional Intelligence is the capacity to perceive emotions, assimilate emotion related feelings, understand the information of those emotions, and manage them. The levels, dimensions and other aspects of Emotional Intelligence are needed to be analyzed; especially among the adolescents. This paper attempted to 1) compare and analyze the overall levels and dimensions of emotional intelligence of higher secondary students, and 2) compare and analyze the socio-demographic characteristics and the levels of emotional intelligence of higher secondary students. It is assumed that there is no significant difference in the overall levels and dimensions of emotional intelligence; and there is no significant difference between the socio-demographic characteristics and the levels of emotional intelligence of higher secondary students. A sample of 380 Higher Secondary Students was selected using two-stage sampling technique. Data were collected through Mangal Emotional Intelligence Inventory (MEII) and analyzed with the help of percentage and chi-square. It resulted that there was statistically significant difference in the levels of emotional intelligence of higher secondary students. However, there were statistically no significant difference in socio-demographic characteristics and the in levels of emotional intelligence among the higher secondary students.
Keywords: Dimensions, Emotional Intelligence, Higher Secondary Students, Levels
Introduction
Education shapes the destiny of any nation. Education is one of the important phases of learning for human beings. It means to improve all the qualities of human being. It enables the individual to raise the quality of physical stamina, intellectual power social upright. It also can keep emotional balance, spiritual consciousness, normally high and culturally empowered. It is perhaps the reason that every
society endeavors to make necessary
Available online: https://edupediapublications.org/journals/index.php/IJR/ P a g e | 1820
condition or perturbation in the mind. In general the term emotion is used to designate a state of consciousness having to do with the aroused of feelings (Webster‟s New World Dictionary). The word emotion is derived from the Greek word “Emovere” which means excitation. It is after noted that when a person acts under emotion, he loses his mental balance. Moreover, defining an emotion precisely is very difficult. There is no clear-cut distinction between emotional and non-emotional behavior, nor there do any sharp lines of demarcation between one emotion and another, for the human emotions blend into one another like the colors of the spectrum. It is distinguished from mental states, from cognition, volition, and awareness of physical sensation. Feeling refers to any of the subjective reactions pleasant or unpleasant, that one may experience in a situation. Emotions consists of a) Physiological changes within the bodies, for example, shifts in the heart beat rate, blood pressure and so on b) subjective cognitive state, for example, the personal experiences me label as emotions and c) expressive behaviors, such as outward signs of these internal reaction (Jain, 1994;Taylor 1999). Misra,2002 and Paranjpe, 1998 argued that in the Indian culture often used term of emotions is „Bhava‟ which considered cognition and emotion as indistinguishable, and has its genesis in aesthetics and the Bhakti (devotional) movement.
Emotional Intelligence (EI)
Emotional Intelligence refers to an ability to recognize the meanings of emotion and their relationships and to reason and problem solve based on them. It is involved in the capacity to perceive emotions, assimilate emotion related feelings, understand the information of those emotions, and manage them. It is the ability to sense, understand, and effectively apply the power and acumen of emotions as a source of human energy, information, and influence. It does not giving free rein to feelings-“letting it all hand out.” Rather it means managing feelings so that they are expressed appropriately and effectively, enabling people
to work together smoothly toward their common goals. It has proved to be a better predictor of future success than I.Q and standardized test scores. The presence of high emotional intelligence may ensure more success and happiness in one‟s life, as well as in professional life, than having only high intelligence or I.Q for a student, as well as for a worker, success can be found out not only by his intelligence quotient rather than he needs a high or moderate level of emotional intelligence also, to be well adjusted in a highly competitive world. Hence, great interest in emotion intelligence on the part of
corporations, universities and schools
worldwide. About 2000 years ago when Plato wrote, “All learning has an emotional base”,
Since then, scientist, educators and
philosophers have worked to prove or disprove the importance of feelings. Emotional Intelligence can also be traced to Darwin‟s (1872/1965) early work on the importance of emotional expression for survival and adaptation. In 1900‟s even though traditional
definitions of intelligence emphasized
Available online: https://edupediapublications.org/journals/index.php/IJR/ P a g e | 1821
„complete‟ measurement. As he referred „intellective‟ as well as „non-intellective‟ elements bys which he meant affective, self and social factors. Furthermore he proposed that the non-intellective abilities i,e emotional abilities are essential to determine one‟s ability to succeed in life. He found emotional intelligence to be an integrated part of an individual‟s personality development. In 1983 Howard Gardner‟s introduced the idea of
multiple intelligences included both
interpersonal intelligence and the capacity to understand the intensions, motivations and desires of other people). In Gardner‟s view, traditional type‟s intelligence such as I.Q, fail to full explain cognitive ability. The first explicit application of the term “Emotional Intelligence” is attributed to Wayne payne‟s doctoral thesis “A study of Emotion: Developing Emotional Intelligence” from 1985. This seems to be the first academic use of the term emotional intelligence. Sternberg (1988) talked about triarchic theory of intelligence that consist of componential intelligence, experiential intelligence and contextual intelligence. The third component
contextual intelligence is very mode
overlapping with emotional intelligence because it manages our ability to handle everyday life affairs in an efficient and practical way. Sarnia (1988) defined emotional competence in terms of skills consisting of the- understanding own emotions, discerning and understanding other‟s emotion using the vocabulary of emotion and expression, the capacity for empathetic involvement, the capacity to differentiate internal subjective emotional experience from external expression, the capacity to adaptive coping with aversive
emotions and distressing circumstance,
understanding of emotional communication within relationships, and the ability for emotional self efficiency. Peter Salovey and John D. Mayer (1990) described emotional intelligence as a set of skills that involve the ability to monitor one‟s own and other‟s feelings and emotions, to discriminate among them, and to use this information to guide one‟s thinking and action. Goleman (1995) viewed
emotional intelligence refers to the capacity for recognizing our own feelings and these of others, for motivating ourselves and for managing emotions well in ourselves and in our relationships. Chapman (2005) stated that emotional intelligence is located somewhere at the intersection of personality and intelligence. It is the ability to accurately perceive, appraise and express emotion, access or generate feelings in facilitating thought, understand emotion and emotional knowledge and regulate emotions (Trinidad, Unger, Chou and Johnson).Thus, emotional intelligence is the function of our conscious mind and differs from cognitive intelligence.
National and international development and importance of emotional intelligence
Available online: https://edupediapublications.org/journals/index.php/IJR/ P a g e | 1822
are considered as the means of discovering the true self. All suffering or Dukkha, according to Indian thought, have suggested gaining correct knowledge of the self as a remedy. The Indian self is constructed around „we‟, „our‟ and „us‟ in contrast to the western „I‟, „my‟, i.e is always in relation to social context people with such others, fulfill obligations and duties and have intimate and lasting friendships. Emotional learning in Indian context needs to be viewed as a life-long process of personal exploration (looking inward) towards the discovery of true self. This process is accompanied by concepts such as: yoga; Karma (deeds), Jitendriya (person who is able to manage and regulate one‟s emotions), dharma (duty), vratas (ordinances), caring, benevolence, though not empirically tested, but existence of these cannot be denied since they have found expression in literature, folklore, popular songs, idioms and other Indian expressions. The Indian tradition has also from time to time and through different religious and health customs emphasized some independent but interrelated concepts in relation to stress and suffering. These are: Detachment, Impulse control, and Transcendence (pal sane & lam 1996). The principal of detachment involves one viewing pleasures as well as suffering with equanimity. The concept of impulse control is related to the desires. Yoigic and religious practices „vratas‟ (ordinances) like fasting and abstentions help one to develop this oneself. The Bhagvadgita combines these virtues of detachment and impulse control in a personality type called Shitaprajna implying one whose intellect is stable (Naidu 1986,
Srivastava, Naidu & Misra, 1986).
Transcendence means consideration of
something beyond oneself of other people, other things, and the world.
Significance of the study in our everyday life Emotions are hypothesized to enhance decision making under certain conditions. They lead to
fast and adaptive behavior responses
(Muramatsu & Hanoch 2005) Sayegh Anthony and Perrewe (2004) describe underscores the role of emotions is an intuitive decision process
under certain conditions. Malek (2000) found positive relationship between scores on the
emotional intelligence, the scores on
collaborative conflict management style. Rosenthal (1977) reported that the ability to identify people‟s emotions (i,e empathy) significantly contributed to one‟s professional and social success Barsade (1988) indicate that people with high EQ understand that the appropriate expression of emotion is as important as the control of impulsive responding. It seems and attempt has been made to establish direct link between emotional intelligence and life success in home, school or work place. Goleman (1995) made a provocative claim that if I.Q contributed up to 20% of life success, the remaining has to be filled in by emotional intelligence. Emotional intelligence may be the best predictor of success in life, redefining what it means to be smart Chibbs, 1995. Goleman (1995) further said that less rudeness or aggressiveness will be seen more among youth with high emotional intelligence. Mayer Salovey (1997) feel that more emotionally intelligent individuals might succeed at making their workers feel better, at communicating in interesting ways, and at designing projects that involve infusing products with feeling and aesthetics. Emotional intelligence also contributes to feelings of life satisfaction. Gannon and Ranjin (2005) found that IQ showed no vicariate relationship with life satisfaction personality accounted for an additional 34.2% of the variance in life
satisfaction and emotional intelligence
Available online: https://edupediapublications.org/journals/index.php/IJR/ P a g e | 1823
team members. The present students feel stress and conflict because of high expectation of parents for better performance. It is imperative to learn how to effectively handle conflict, to understand their own feelings and use them to make good decisions while having empathy for others developing the competencies of emotional intelligence and understanding how to handle conflict effectively is necessary (Morrison, 2005). Jeanne (2005) reported that positive relationship exists between the conflict handling style and emotional intelligence. This study supports the view that conflict and stress may affect the emotional intelligence. Reker and Parker (1999) found that mother‟s level of emotional intelligence was significantly related to the child‟s emotional intelligence. Stubbs (2005) found that emotional intelligence of team leaders was significantly related to the presence of emotionally competent group norms on the teams they lead, and that emotionally competent group norms are related to team performance. Leader‟s emotional intelligence affects the teams they lead and that team level emotional intelligence affects team performance. Austin, Saklofske and Egan (2005) found that emotional intelligence was positively associated life satisfaction .Social network size are predicted better by trait emotional intelligence .Emotional intelligence was found to be negatively associated with
alexithymia and alcohol consumption.
Emotional intelligence is more strongly associated with social network size. Emotional intelligence is held to explain how emotions advance life goals. Relevance of emotional intelligence depends on its being able to predict significant life outcomes. Life satisfaction decides the upliftment of person in totality approach. Higher emotional intelligence was correlated with higher life satisfaction. In other words, emotional intelligence is positively correlated with life satisfaction (Bastian, Burns and Nettelbeck, 2005). Elfnebein (2006) examined the accuracy of judging emotion in facial expressions through training and feedback. Feedback provides greater novel information for participant. Training via feedback can improve emotion perception
skills. Ciarrochi, Forgas and Mayer (2006) reported that the field of emotional intelligence has grown in sophistication and importance. In the above literature, it is difficult to determine the levels and dimensions of emotional intelligence among the higher secondary students. No such study compares and analyzes the overall levels, and dimensions of emotional intelligence of higher secondary students. Not only that but also no such literature found where socio-demographic characteristics and the levels of emotional intelligence of higher secondary students were compared. Are there any differences in the levels and dimensions of emotional intelligence among the higher secondary students with respect to their gender, socio-demographic characteristics, levels of learning, types of family, religion, habitation, family income, and school management, choice of stream, academic achievement, and parental education?
Objectives of the Study
1. To compare and analyze the overall levels, and dimensions of emotional intelligence of higher secondary students.
2. To compare and analyze the socio-demographic characteristics and the levels of emotional intelligence of higher secondary students.
Hypotheses
1. There is no significant difference in the overall levels and dimensions of
emotional intelligence of higher
secondary students.
2. There is no significant difference
between the socio-demographic
characteristics and the levels of
emotional intelligence of higher
secondary students.
Methodology
Participants
Available online: https://edupediapublications.org/journals/index.php/IJR/ P a g e | 1824
procedure. In the first stage, out of the total nine districts of Manipur; a sample of two districts were selected through simple random sampling technique (Viz. Imphal west and east districts of Manipur). Secondly, stratified random sampling method was adopted. In this procedure, the entire schools in Imphal west and east district were divided into two strata i.e. Government and Private Higher Secondary Schools. In Imphalwest and east districts, there are 22 Government Higher Secondary Schools and 82 Private Higher Secondary Schools registered under council of higher secondary education, Manipur (COSEM). From each stratum, 5 schools were selected randomly. Then, a list of students residing only in Imphal East-West districts from each of the selected schools in each stratum were prepared
(sampling frame) and selected 200 students from each stratum i.e. 40 students per school through simple random sampling technique. Finally, it had come 400 samples, which was excess than the required sample size. Out of these samples selected, 20 samples were rejected, as they were not fulfilling the inclusion criteria and information provided were not sufficient for analysis. Thus, 400 samples were involved in the study. Stratified random sampling technique was adopted in this present study as it had the likelihood of inclusion of each individual in the sample, reduces selection bias, accurately reflects the population being studied, and it ensures each subgroup receives proper representation within the sample. The details of the sample design is given table 1-
Table 1 sample design Sl.
No.
Type of
School
No. of School
Selected
No. of Student
selected
No. of Student Selected per School
1 Government 5 200 40 Student each
2 Private 5 200 40 Student each
Total 10 400
Design of the study
In this comparative case study, the researcher examined and compared two (or more) variables to know their differences and similarities. For that purpose, statistical techniques used to analyze the data to drawing inferences for its generalization. This design provided information about the presence and strength of associations between variables, and permitted the testing of hypothesis about variables. Primary data collected from higher secondary students of Imphal east and west districts of Manipur through questionnaires. The theoretical issues explored and tested the small n through comparative case study approach (Lijphart, 1971, 1975). Keeping in mind the benefits, in terms of internal validity, the research strategy optimized control and effectively isolated the relationships of interest, given the constraints created by the need to observe the phenomenon contextually. The researcher tried to articulate such a method by
relying on a logic of case selection that, within the limits inherent in the well-designed small-n
comparative case-study (Verba, 1967;
Eckstein, 1975; Yin, 1984), allowed the researcher to maximize the internal and external validity possible given his/her contextual interests, thus increasing the confidence and generalizability of the causal explanations.
Tool
Available online: https://edupediapublications.org/journals/index.php/IJR/ P a g e | 1825
Intelligence Inventory (MEII) is given in table 2
Table 2 Areas or aspects of Mangal Emotional Intelligence Inventory (MEII)
Sl No. Area/Aspect No. of Items
1 Intra – personal awareness (knowing about one‟s own emotions) 25
2 Inter – personal awareness (knowing about others emotions) 25
3 Intra – personal management ( managing one‟s own emotions) 25
4 Inter – personal management (managing other‟s emotions). 25
Total 100
Scoring Procedure: Scoring can be done by hand or with the help of stencil. The mode of responses to each item of the inventory is in the form of a forced choice i.e. either yes or no, indicating complete agreement or disagreement with the proposed statement respectively.It has 100 items, 25 each from the four areas to be answered as yes or no. These were responded by the students either in “Yes” or “No”. A score of one was awarded to each “Yes” response, which is indicative of Emotional Intelligence and “Zero” to “No” The higher score in the test indicates the higher level of Emotional Intelligence and low score, reveal slow Emotional Intelligence. The possible range of score on the test is 0 to 100. The obtained scores can be classified into five different categories. They were a) Very Good b) Good c) Average d) Poor – and e) Very Poor. Emotional intelligence inventory can also be analyzed in four different areas i.e. a) Intra personal awareness b) Inter personal awareness c) Intra personal management and d) Inter
personal Management. The reliability
coefficient based on split half test was 0.89 and that of test – retest after 4 week was 0.92. The validity for the inventory has been established by adopting two different approaches, namely factorial and criterion related approach.
Data Collection Procedure
To proceed with the study, necessary permission was sought from the school authority and they were explained thoroughly
about the aim and procedures of the study that the research was mainly taken up to study the emotional intelligence of students studying in higher secondary school of Imphal west and east districts of Manipur. After this, thorough information was again shared to all the students who were willing to participate in the study. Study aims, interviewing procedures and methods for maintaining confidentiality were explained to each potential student. They also informed that their identifications like names will not be appeared in any part of the study; they have the right to seek clarification and information about the aspect of the research work; they have the freedom to refuse answer to particular question and can withdraw the test at any point of time. Once the assent was obtained from the student, an interview was conducted using a self-developed semi structure proforma for collecting the socio-demographic data. Then, emotional intelligence inventory was administered to assess the different levels of emotional intelligence among students studying in higher secondary schools. These processes were continued until the reasonable numbers of samples were collected.
Analysis and interpretation of results
Available online: https://edupediapublications.org/journals/index.php/IJR/ P a g e | 1826
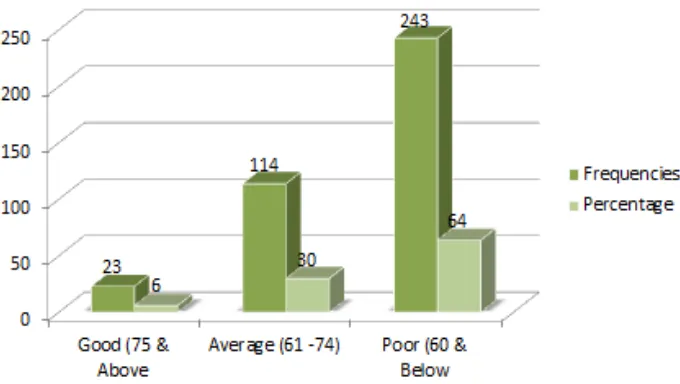
Table 3 Distribution of levels of emotional intelligence of higher secondary students of Manipur
Levels of Emotional Intelligence Frequency Percentage (%)
Good (75 and Above) 23 6
Average (61 -74) 114 30
Poor (60 and Below) 243 64
Total 380 100
Chi-Square = 3.892; df = 2 p-value = 0.040
Table 3 depicts the frequencies and percentage of good, average, and poor levels of emotional intelligence of higher secondary students of Manipur. Out of the 380 students, 23 students were having good level of emotional intelligence with a percentage of 6%, 114 students were having average emotional intelligence with a percentage of 30%, and 243 students were found to have poor emotional intelligence with a percentage of 64%. It
resulted that the global emotional intelligence of higher secondary school students of Manipur was maximally under the category of poor emotional intelligence with 64%. The Chi-Square value (df = 2 3.892 p-value = 0.040 <.05) was significant. Hence, the null hypothesis was rejected and there was significant difference in the overall levels of emotional intelligence of higher secondary students.
Figure 1.1 levels of emotional intelligence of higher secondary students of Manipur
Figure -1.1 illustrates the frequencies and percentage of good, average, and poor levels of emotional intelligence of higher secondary
Available online: https://edupediapublications.org/journals/index.php/IJR/ P a g e | 1827
X-axis and frequencies and percentage of good, average, and poor levels of emotional intelligence is in Y-axis. It showed that the global emotional intelligence of higher secondary school students of Manipur found maximally under the category of poor emotional intelligence with 64%.
The dimensions of emotional intelligence of higher secondary students of Manipur is described in four tables namely table 1.2 dimension of intra-personal awareness, table 1.3 dimension of inter-personal awareness, table 1.4 dimension of intra-personal management and table 1.5 dimension of inter-personal management.
Table 4 Showing overall percentages of response of the students in the dimension of intra-personal awareness of higher secondary students of Manipur
Intra - Personal
Awareness Frequency Percentage
Good (20 and Above) 24 6
Average (15 -19) 140 37
Poor (14 and Below 216 57
Total 380 100
Chi-Square = 3.692 df = 2 p-value = 0.030
Table 4 shown the frequencies and percentage of good, average, and poor levels of intra-personal awareness of the students. Out of the total 380 students, 24 were having good level of intra-personal awareness with a percentage of 6%, 140 students were having average intra-personal awareness with a percentage of 37% and 216 students were having poor intra-personal awareness with a percentage of 57%. The result revealed that only 6% (good level of intra-personal awareness) of the students of higher secondary schools of Manipur were having knowledge of how they affect the world around them. The Chi-Square value (df = 2 3.692 p-value = 0.030 <.05) was significant. Hence, the null hypothesis was rejected and there was significant difference in the dimension of intra-personal awareness of higher secondary students in Manipur.
Available online: https://edupediapublications.org/journals/index.php/IJR/ P a g e | 1828
Figure -1.2 illustrates the percentages on the levels of intra-personal awareness of higher secondary students of Manipur. Good, average, and poor levels of emotional intelligence of higher secondary students of Manipur is showing in X-axis and the intra – personal awareness of higher secondary students of
Manipur is in Y-axis. It showed that only 6% (good level of intra-personal awareness) of the students of higher secondary schools of Manipur were having knowledge of how they affect the world around them.
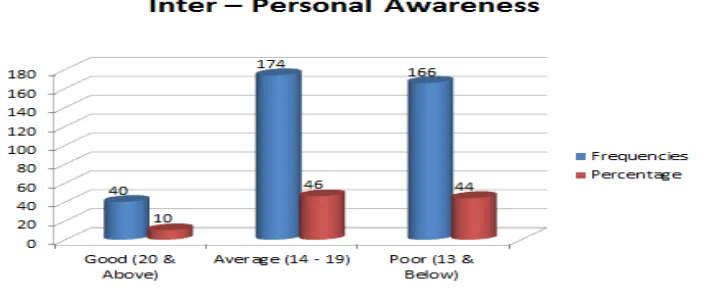
Table 5 Showing overall percentages of response of the students in the dimension of inter-personal awareness of higher secondary students of Manipur
Inter - Personal Awareness Frequency Percentage
Good (20 and Above) 40 10
Average (14 - 19) 174 46
Poor (13 and Below) 166 44
Total 380 100
Chi-Square = 3.782 df = 2 p-value = 0.030
Table 5 reveals the frequencies and percentage of good, average, and poor levels of inter-personal awareness of the study samples. Out of the total 380 samples, 40 students were having good level of inter-personal awareness with a percentage of 10%, 174 students were having average inter-personal awareness with a percentage of 46% and 166 students were having poor inter-personal awareness with a percentage of 44%. It resulted that only 10% (good level of inter personal awareness) of the students were having the ability to show a true understanding of him/her and others, and having a deep knowledge of his/her own thoughts and feelings. The Chi-Square value (df = 2 3.782 p-value = 0.030 <.05) was significant. Hence, the null hypothesis was
Available online: https://edupediapublications.org/journals/index.php/IJR/ P a g e | 1829
Figure 1.3 overall levels of inter – personal awareness of higher secondary students of Manipur
Table 6 Showing overall percentages of response of the students in the dimension of intra-personal management of higher secondary students of Manipur
Intra - Personal Management Frequency Percentage
Good (21 and Above) 38 10
Average (15 - 20) 192 50
Poor (14 and Below) 150 40
Total 380 100
Chi-Square = 3.692 df = 2 p-value = 0.000
Table 6 shows the frequencies and percentage of good, average, and poor levels of intra-personal management of the study samples. Out of the total 380 study samples, 38 students were having good level of intra-personal awareness with a percentage of 10%, 192 students were having average intra-personal awareness with a percentage of 50% and 150 students were having poor intra-personal awareness with a percentage of 40%. The finding revealed that only 10% (good level of
intra personal management) of the students were having the ability to work remotely, to work autonomously, be motivating, self-monitoring, and the willingness and ability to acquire new information and skills related to work. The Chi-Square value (df = 2 3.692 p-value = 0.000 <.05) was significant. Hence, the null hypothesis was rejected and there was significant difference in the dimension of intra-personal management of higher secondary students of Manipur.
Available online: https://edupediapublications.org/journals/index.php/IJR/ P a g e | 1830
Figure-1.4 illustrates the percentages of dimensions of intra-personal management of higher secondary students of Manipur. Above, average, and poor levels of emotional intelligence of higher secondary students of Manipur is showing in X-axis, and the percentages of intra-personal awareness of higher secondary students of Manipur is in
Y-axis. It showed that only 10% (good level of intra personal management) of the students were having the ability to work remotely, to work autonomously, be motivating, self-monitoring, and the willingness and ability to acquire new information and skills related to work.
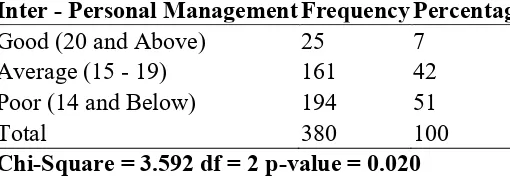
Table 7 Showing overall percentages of response of the students in the dimension of inter-personal management of higher secondary students of Manipur
Inter - Personal Management Frequency Percentage
Good (20 and Above) 25 7
Average (15 - 19) 161 42
Poor (14 and Below) 194 51
Total 380 100
Chi-Square = 3.592 df = 2 p-value = 0.020
Table 7 reveals the frequencies and percentage of good, average, and poor levels of inter-personal awareness of the study samples. Out of the total 380 study samples, 25 students were having good level of inter-personal management with a percentage of 7%, 161 students were having average inter-personal management with a percentage of 42% and 194 students were having poor inter-personal management with a percentage of 51%. It resulted that only 7% (good level of inter
personal awareness) of the samples were having the ability to show a true understanding of him/her and others, and having a deep knowledge of his/her own thoughts and feelings. The Chi-Square value (df = 2 3.692 p-value = 0.020 <.05) was significant. Hence, the null hypothesis was rejected and there was significant difference in the dimension of inter-personal management of higher secondary students in Manipur.
Figure 1.5 levels of inter-personal management of higher secondary students of Manipur
Figure-1.5 illustrates the percentages of dimensions of inter-personal management of higher secondary students of Manipur. Above,
Available online: https://edupediapublications.org/journals/index.php/IJR/ P a g e | 1831
percentages of inter-personal awareness of higher secondary students of Manipur is in Y-axis. It showed only 7% (good level of inter personal awareness) of the samples were
having the ability to show a true understanding of him/her and others, and having a deep knowledge of his/her own thoughts and feelings.
Testing of Hypothesis 2: There is no significant difference between the socio-demographic characteristics and the levels of emotional intelligence of higher secondary students.
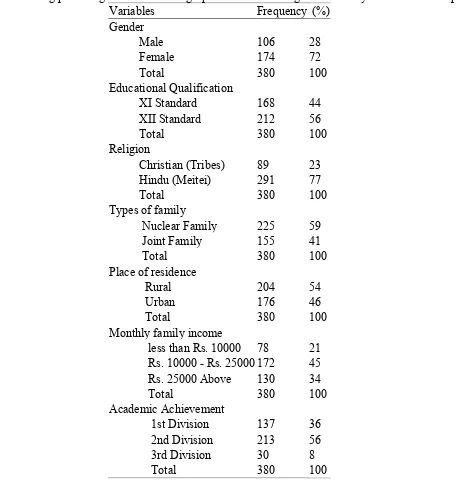
Table 8 Showing percentages of socio-demographic variables of higher secondary students of Manipur
Variables Frequency (%)
Gender
Male 106 28
Female 174 72
Total 380 100
Educational Qualification
XI Standard 168 44
XII Standard 212 56
Total 380 100
Religion
Christian (Tribes) 89 23
Hindu (Meitei) 291 77
Total 380 100
Types of family
Nuclear Family 225 59
Joint Family 155 41
Total 380 100
Place of residence
Rural 204 54
Urban 176 46
Total 380 100
Monthly family income
less than Rs. 10000 78 21
Rs. 10000 - Rs. 25000 172 45
Rs. 25000 Above 130 34
Total 380 100
Academic Achievement
1st Division 137 36
2nd Division 213 56
3rd Division 30 8
Total 380 100
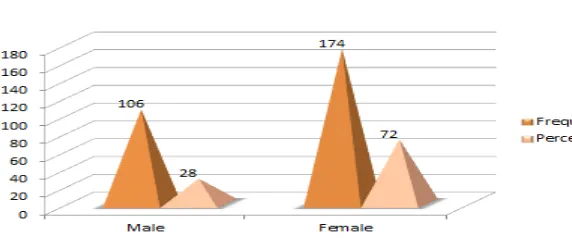
Table 8 depicts the gender, educational qualification, religion, type of family, and place of residence, order of birth, monthly income, and stream of subject, academic achievement,
Available online: https://edupediapublications.org/journals/index.php/IJR/ P a g e | 1832
sample comprised of 380 higher secondary schools students of Manipur. Out of the total 380 samples, 106 were male students with 28%
and 174 were female students with 72%. This indicates that female students were actively participated in the present study.
Figure 2.1 percentages of gender in socio-demographic variables of higher secondary students of Manipur
Figure-2.1 illustrates the percentages of gender in the socio-demographic variables of higher secondary students of Manipur is showing in X-axis, and the percentages students in Y-axis. This indicates that female students were actively participated in the present study. In
case of educational qualification, standard XII students were participated better than the standard XI. Their frequencies with percentage of standard XII and XI students were 212 (56%) and 168 (44%), respectively(see fig 4.2.1).
Fig 2.2 percentages of educational qualifications in the socio-demographic variables of higher secondary students of Manipur
Figure-2.2 illustrates the percentages of educational qualifications in the socio-demographic variables of higher secondary students of Manipur is showing in X-axis, and the percentages students in Y-axis. Their frequencies with percentage of standard XII and XI students were 212 (56%) and 168 (44%), respectively.
Available online: https://edupediapublications.org/journals/index.php/IJR/ P a g e | 1833
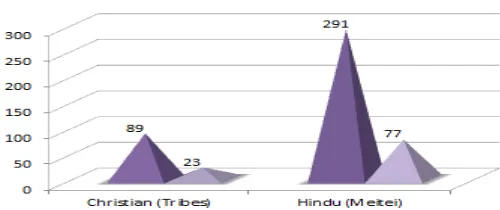
showing in X-axis, and the percentages students in Y-axis. This graph shows that
Hindu (Meitei) i.e. 291 respondents with a percentage of 77% was maximum.
Fig 2.3 percentages of religion in the socio-demographic variables of higher secondary students of Manipur
Regarding types of family, the highest representative of samples in the present study were from nuclear family i.e. 225 respondents with 59% and the remaining representatives of
the samples were from joint family i.e. 155 respondents with 41% only.
Fig 2.4 percentages of types of family in the
socio-demographic variables of higher
secondary students of Manipur
Figure-2.4 illustrates the percentages of types of family in the socio-demographic variables of higher secondary students of Manipur is showing in X-axis, and the percentages students in Y-axis. This graph shows that the nuclear family 59% is better over the joint family.
About family monthly income, the highest representative samples in the study were
belong to the monthly income range of Rs. 10,000 to Rs. 25,000 i.e. 172 respondents with a percentage of 45% followed by monthly income range of Rs. 25,000 and above i.e. 130 respondents with a percentage of 34% and a least by less than Rs. 10,000 i.e. 78 respondents with a percentage of 21%.
Available online: https://edupediapublications.org/journals/index.php/IJR/ P a g e | 1834
Figure-2.5 illustrates the percentage of monthly income of the family in the socio-demographic variables of higher secondary students of Manipur is showing in X-axis, and the percentages students in Y-axis. This graph shows 130 respondents with a percentage of 34% and a least by less than Rs. 10,000 i.e. 78 respondents with a percentage of 21%.
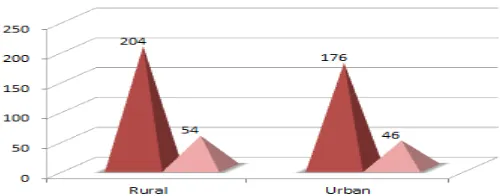
Concerning place of residence, most of the respondents were belong to rural area i.e. 204 respondents with a percentage of 54% and the rest belong to urban area i.e. 176 respondents with a percentage of 46%.
Fig 2.6 percentages of place of residence in the socio-demographic variables of higher secondary students of Manipur
Figure-2.6 illustrates the percentages of place of residence in the socio-demographic variables of higher secondary students of Manipur is showing in X-axis, and the percentages students in Y-axis. This graph shows rural area i.e. 204 respondents were maximum with a percentage of 54%.
In case of stream of subject, the highest representative of samples in the present study
were belong to Arts stream i.e. 216 respondents with a percentage of 57% and the remaining belong to science stream i.e. 164 respondents with 43%.
Fig 2.7 percentages of stream of subject in the
socio-demographic variables of higher
Available online: https://edupediapublications.org/journals/index.php/IJR/ P a g e | 1835
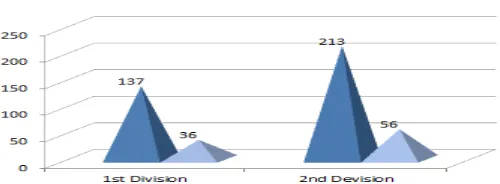
Figure-2.7 illustrates the percentages of stream of subject in the socio-demographic variables of higher secondary students of Manipur showing in X-axis, and the percentages students in Y-axis. This graph shows Arts stream were maximum i.e. 216 respondents with a percentage of 57% was maximum. With regard to academic achievement, maximum representatives of samples belong to 2nd division group i.e. 213 respondents with 56% followed by 1st division group i.e. 137 respondents with 36% and a least by 3rd
division group i.e. 30 respondents with 8% only. Figure- 2.8 illustrates the percentages of
academic achievement in the
socio-demographic variables of higher secondary students of Manipur is showing in X-axis, and the percentages students in Y-axis. This graph shows maximum representatives of samples belong to 2nd division group i.e. 213 respondents with 56%.
Fig 2.8 percentages of academic achievement in the socio-demographic variables of higher secondary students of Manipur
The basic profiles of the study samples talk about parental education status. In this regard, maximum respondents in the study sample belong to graduate and above category i.e. 142 respondents with 37% followed by matric category i.e. 139 respondents with 36%, and a least by under matric and higher secondary categories i.e. 50 respondents with 13% each.
Figure-2.9 illustrates the percentages of educational qualification in the socio-demographic variables of higher secondary students of Manipur is showing in X-axis, and the percentages students in Y-axis. This graph shows maximum representatives of samples belong to graduate and above category i.e. 142 respondents with 38%.
Available online: https://edupediapublications.org/journals/index.php/IJR/ P a g e | 1836
Note: However, this summary doesn’t give us Mean and SD, still it needed to analyze the raw data
Table 9 Gender and levels of emotional intelligent of higher secondary students
Gender
Levels of Emotional Intelligence Average
(61 -74) Good (75 and Above) Poor (60 and Below) Total
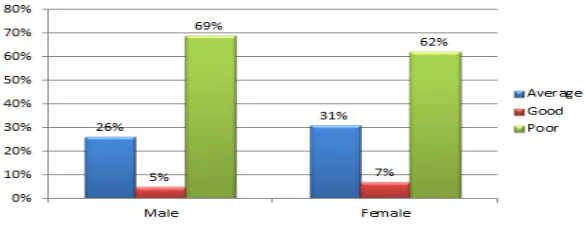
Male 28 (26%) 5 (5%) 73 (69%) 106 (100%)
Female 86 (31%) 18 (7%) 170 (62%) 274 (100%)
Total 114 (30%) 23 (6%) 243 (64%) 380 (100%)
Chi-Square = 1.620 df = 2 p-value = 0.635
Table 9 shows the different levels of emotional intelligence between male and female students of higher secondary schools. The percentage of average, good and poor levels of emotional intelligence of male students were 26%, 5% and 69%, respectively and for female students were 31%, 7%, and 62% respectively. The
Chi-Square value (df = 2 1.620 p-value = 0.635 >.05) was not significant. Hence, the null hypothesis was accepted and there was no statistically significant difference in the levels of emotional intelligence between male and female students of higher secondary schools in Manipur.
Fig 2.10 gender and levels of emotional intelligence of higher secondary students of Manipur
Figure- 2.10 illustrates the gender and the level of emotional intelligence of higher secondary students of Manipur is showing in X-axis, and
Available online: https://edupediapublications.org/journals/index.php/IJR/ P a g e | 1837
students were 26%, 5% and 69% maximum over female students.
Table 10 Educational qualification and levels of emotional intelligent of XI and XII standard students
Educational Qualification
Levels of Emotional Intelligence Average
(61 -74) Good (75 and Above) Poor (60 and Below) Total
XI Standard 59 (35%) 9 (5%) 100 (60%) 168 (100%)
XII Standard 55 (30%) 14 (7%) 143 (68%) 212 (100%)
Total 114 (30%) 23 (6%) 243 (64%) 380 (100%)
Chi-Square = 3.792 df = 2 p-value = 0.150
Table 10 describes about the different levels of emotional intelligence of XI and XII standard students of higher secondary schools. The percentage of average, good and poor levels of emotional intelligence of XI standard students were 35%, 5% and 60%, respectively and for XII standard students were 30%, 7%, and 68% respectively. The Chi-Square value (df = 2
3.792 p-value = 0.150 >.05) was not significant. Hence, the null hypothesis was accepted and there was no statistically significant difference in the educational qualification and in the levels of emotional intelligent of XI and XII standard students in Manipur.
Fig 2.11 educational qualification and levels of emotional intelligence of higher secondary students of Manipur
Figure- 2.11 illustrates the socio-demographic variables of educational qualifications of students of higher secondary school of Manipur showing in X-axis, and the levels of emotional
Available online: https://edupediapublications.org/journals/index.php/IJR/ P a g e | 1838
Table 11 Religion and levels of emotional intelligent of Christian (Tribes) and Hindu (Meitei) of higher secondary students
Religion
Levels of Emotional Intelligence Average
(61 -74)
Good
(75 and Above) Poor
(60 and Below) Total
Christian (Tribes) 38 (43%) 5 (6%) 46 (51%) 89 (100%)
Hindu (Meitei) 76 (26%) 18 (6%) 197 (68%) 291 (100%)
Total 114 (30%) 23 (6%) 243 (64%) 380 (100%)
Chi-Square = 9.014 df = 2 p-value = 0.011
Fig 2.12 religion and levels of emotional intelligence of higher secondary students of Manipur
Table 11 reveals about the different levels of emotional intelligence of Christian (Tribes) and Hindu (Meitei) students of higher secondary schools. The percentage of average, good and poor levels of emotional intelligence of Christian (Tribes) students were 43%, 6% and 51% respectively and for Hindu (Meitei) students were 26%, 6% and 68%, respectively. Here, the variations of percentages among the different levels of emotional intelligence with respect to two categories of religion were high and when statistically applied chi-square test it was found no significant difference in the levels of emotional intelligence in religion as manifest by p-value = 0.011. The Chi-Square value (df = 2 9.014 p-value = 0.011 >.05) was
not significant. Hence, the null hypothesis was accepted and there was no statistically significant difference between the Christian (Tribes) and Hindu (Meitei) students of higher secondary schools in Manipur.
The finding indicated that poor level of emotional intelligence was seen more among Hindu (Meitei) students than the Christian (Tribes) students. Figure- 2.12 illustrates the socio-demographic variables of religion of students of higher secondary school of Manipur showing in X-axis, and the levels of emotional intelligence in percentages of students in Y-axis. This graph shows levels of emotional intelligence of Christian (Tribes) students were 43%, 6% and 51% was maximum.
Available online: https://edupediapublications.org/journals/index.php/IJR/ P a g e | 1839
Types of family
Levels of Emotional Intelligence Average
(61 -74) Good (75 and Above) Poor (60 and Below) Total
Nuclear Family 71 (32%) 16 (7%) 138 (61%) 225 (100%)
Joint Family 43 (28%) 7 (4%) 105 (68%) 155 (100%)
Total 114 (30%) 23 (6%) 243 (64%) 380(100%)
Chi-Square = 2.055 df = 2 p-value = 0.358
Fig 2.13 types of family and levels of emotional intelligence of higher secondary students of Manipur
Table 12 reveals different levels of emotional intelligence of nuclear and joint family students of higher secondary schools. The percentage of average, good and poor levels of emotional intelligence of students from nuclear family were 32%, 7% and 61%, respectively and for students from joint family were 28%, 6%, and 68% respectively. The Chi-Square value (df = 2 2.055 p-value = 0.038 >.05) was not significant. Hence, the null hypothesis was accepted and there was no statistically significant difference between the nuclear and
joint family in the levels of emotional intelligence of students of higher secondary schools in Manipur.
Figure- 2.13 illustrates the socio-demographic variables i.e. types of family of students of higher secondary school of Manipur showing in X-axis, and the levels of emotional intelligence in percentages of students in Y-axis. This graph shows the percentage of average, good and poor levels of emotional intelligence of students from nuclear family were 32%, 7% and 61%.
Table 13 habitation and levels of emotional intelligent of rural and urban students of higher secondary schools
Place of Residence Levels of Emotional Intelligence Average
(61 -74)
Good
(75 and Above) Poor
60 and Below) Total
Rural 64 (32%) 8 (4%) 132 (64%) 204 (100%)
Urban 50 (28%) 15 (9%) 111 (63%) 176 (100%)
Total 114 (30%) 23 (6%) 243 (64%) 380 (100%)
Available online: https://edupediapublications.org/journals/index.php/IJR/ P a g e | 1840
Table 13 reveals different levels of emotional intelligence of rural and urban students of higher secondary schools. The percentage of average, good and poor levels of emotional intelligence of rural students were 32%, 4% and 64% respectively and for urban students were 28%, 9% and 63%, respectively. Here, the differences of percentages among the different levels of emotional intelligence with respect to
the categories of place of residence were negligible. The Chi-Square value (df = 2 3.621p-value = 0.164 >.05) was not significant. Hence, the null hypothesis was accepted and there was no statistically significant difference between the rural and urban students in the levels of emotional intelligence of higher secondary schools in Manipur.
Fig 2.14 place of residence and levels of emotional intelligence of higher secondary students of Manipur
Figure- 2.14 shows the socio-demographic variables i.e. place of residence of students of higher secondary school of Manipur showing in X-axis, and the levels of emotional intelligence in percentages of students in
Y-axis. This graph shows the percentage of average, good and poor levels of emotional intelligence of rural students were 32%, 4% and 64% respectively.
Table 14 Monthly family income and levels of emotional intelligent of higher secondary schools students
Monthly Family Income Levels of Emotional Intelligence Average
(61 -74)
Good
(75 and Above) Poor
(60 and Below) Total
Rs. 10,000 Below 21 (27%) 3 (4%) 54 (69%) 78 (100%)
Rs. 10,000 – Rs. 25,000 52 (30%) 7 (4%) 113 (66%) 172 (100%)
Rs. 25,000 Above 41 (32%) 13 (10%) 76 (58%) 130 (100%)
Total 114 (30%) 23 (6%) 243 (64%) 380 (100%)
Chi-Square = 6.478; df = 4; p-value = 0.166; Remark = Insignificant
Table 14 reveals the percentage of average, good and poor levels of emotional intelligence of students from low income group (below Rs. 10000) were 27%, 4% and 69%, respectively,
Available online: https://edupediapublications.org/journals/index.php/IJR/ P a g e | 1841
respectively. The Chi-Square value (df = 2 3.621p-value = 0.164 >.05) was not significant. Hence, the null hypothesis was accepted and there was no statistically significant difference between the parental monthly income and the levels of emotional intelligence of higher secondary schools in Manipur. Figure- 2.15 shows the socio-demographic variables i.e. monthly income of
the family of the students of higher secondary school of Manipur showing in X-axis, and the levels of emotional intelligence in percentages of students in Y-axis. This graph shows the average, good and poor levels of emotional intelligence of students from low-income group (below Rs. 10000) were 27%, 4% and 69%, respectively.
Fig 2.15 monthly income and levels of emotional intelligence of higher secondary students of Manipur
Table 15 Levels of emotional intelligence and type of school management of the study samples
Levels of Emotional Intelligence Type of School Management
Government School Private School Total
Average (61 -74) 58 (51%) 56 (49%) 114 (100%)
Good (75 and Above) 10 (44%) 13 (56%) 23 (100%)
Poor (60 and Below) 122 (50%) 121 (50%) 243 (100%)
Total 190 (50%) 190 (50%) 380 (100%)
Chi-square = 0.431 df = 2 p-value = 0.806
Table 15 showed the different levels of emotional intelligence of government and private students of higher secondary schools. The percentage of average, good and poor levels of emotional intelligence of students studying in government higher secondary schools were 51%, 44% and 650%, respectively and for students studying in private higher secondary schools were 59%, 56%, and 50% respectively. The Chi-Square
value (df = 2 0.431 p-value = 0.806 >.05) was not significant. Hence, the null hypothesis was accepted and there was no statistically significant difference between the government and private students in the levels of emotional intelligence of higher secondary schools in Manipur.
Available online: https://edupediapublications.org/journals/index.php/IJR/ P a g e | 1842
showing in X-axis, and the levels of emotional intelligence in percentages of students in Y-axis. This graph shows the average, good and
poor levels of emotional intelligence of students from private higher secondary schools were 59%, 56%, and 50% respectively.
Fig 2.16 types of school management and levels of emotional intelligence of higher secondary students of Manipur
Table 16 Levels of intelligence and stream of subject
Levels of Emotional Intelligence Stream of subject
Science Arts Total
Average (61 -74) 41 (36%) 73 (64%) 114 (100%)
Good (75 and Above) 9 (39%) 14 (61%) 23 (100%)
Poor (60 and Below) 114 (47%) 129 (53%) 243 (100%)
Total 164 (43%) 216 (57%) 380 (100%)
Chi-square = 3.954 df = 2 p-value = 0.139
Table 16 presented about the different levels of emotional intelligence of science and arts students of higher secondary schools. The percentage of average, good and poor levels of emotional intelligence of science students were 36%, 39% and 47%, respectively and for arts students were 64%, 61%, and 53% respectively. The Chi-Square value (df = 2 3.954 p-value = 0.139 >.05) was not significant. Hence, the null hypothesis was accepted and there was no statistically significant difference between the science and
arts students in the levels of emotional intelligence of higher secondary schools in Manipur.
Available online: https://edupediapublications.org/journals/index.php/IJR/ P a g e | 1843
Fig 2.17 stream of subject opted and levels of emotional intelligence of higher secondary students of Manipur
Findings
Hypothesis 1: There is no significant difference in the overall levels and dimensions of emotional intelligence of higher secondary students.
It was found that there was significant difference in the overall levels of emotional intelligence of higher secondary students. It also resulted that there was significant difference in the overall dimensions of emotional intelligence. In the intra-personal awareness, inter-personal awareness, and intra-personal management, and in the inter-intra-personal management dimension, there was significant difference among the students of higher secondary in Manipur.
Hypothesis 2: There is no significant difference between the socio-demographic characteristics and the levels of emotional intelligence of higher secondary students.
It was found that there was statistically no significant difference in the socio-demographic characteristics and the levels of emotional intelligence of higher secondary students with respect to their gender, class, family, religion, habitation, family income, and school-management, stream of subjects, academic achievement, and parental education.
Discussion
The emotional intelligence (EI) of secondary school student of Manipur could not be
determined without any empirical
investigation. In this, study the researcher claimed there was no significant difference in
the overall levels and dimension of EI of the Hr sec. student of Manipur. This was because student of different gender, different classes, religions, types of a family their habitation parental monthly income, school management stream of subject they have obtain and their parental education to some extent differ from each other. But the school selected by the reached both in urban and rural areas have no significant different in their EI in their various dimension like intra personal awareness in the
personal awareness, intra-personal
Available online: https://edupediapublications.org/journals/index.php/IJR/ P a g e | 1844
all the parents of student of development countries have high EI because monthly income promotes to take admission in different stream to option in the school that could promote high EI.
Conclusion
Emotional intelligence is emerging as critical factor for sustaining high achievement, retention and positive behavior as well as improving life success. EI is the capacity of the individual to recognize his/her own emotion and those of others, discern between different feeling and level them appropriately, used emotional information to guide thinking and behavior and manage emotions to adapt to environment or to achieve the goal. This concept was first appeared in 1964 in the paper Michael Belboch. In that time, EI was not compared with the gender and order related variables. This study conducted in India and abroad between 19th-20th century found EI is the ability of the individuals which is individual‟s genetic and his behavior related to the environment. At the end of 20th century many researcher are assessing the EI of student in relation to their gender, qualification, religions, types of family, place of habitation, monthly income of the parents, school management, parental education (status), etc and most of researcher found EI is independent and it has significant role in gender and other inheriting character. Nevertheless, earlier researchers found that minimum 67% EI is necessary to control all the social, economical, political management.
The question raised where the literacy rate is more than 70% how the EI was concentrated among the girls, religious, family, place of residence, monthly income and school management. The study concluded that the Manipur is a rich culture and high-literacy area where the samples were undertaken for the study. However, the result was different from the world of EI researchers.
Educational Implications
These are the following educational
implications, put and established in front of the world of educational implication.
1. EI is an ability to think, rethink, to organize, to evaluate, work and activities himself and others. The teachers should develop the thinking capacity of the students regarding rationalization, wholeness, and they should try to develop good inter-personal relationship among the peers.
2. Teacher, teacher educator, policy
maker, administrators, and stakeholders should understand the emotions of the student or children and accordingly they should develop or improve the curriculum, contents, work activities of the students to regulate the child‟s
emotions in the inter-personal
relationship and capacity to monitor the problems and difficulties.
3. The teacher to the students should conceptualize the concept rationalism and the development of inter-personal
relationship. Different conflict
resolution training should be provided to create a good emotion among the students. Different training program should be adopted in the educational institution to improve the skill of
promoting social and emotional
alliances. The curriculum should be framed in addition with social and behavioral components.
References
[1] Abdullah,M,Ch., Elias
,H.,Mahimuddin,R. & Ulli,J.( 2004). Emotional Intelligence and Academic Achievement among Malaysian students. Pakistan journal of psychological Research.19,(3-4 ,105-121.
[2] Acharya.P.B.(2015).Emotional
Intelligence and Academic Achievement of
Higher Secondary School Students.
International Journal for Research in Education(IJRE).1-5,6.30.
[3] Afzal,M.T., & Afzal,M.(2016).
Available online: https://edupediapublications.org/journals/index.php/IJR/ P a g e | 1845
Research. 4(9), 2016, 685-688.doi: 10./ 2691/education 4-9-7.
[4] Aiyappa., Sh. & Acharya, Y., T., B.(2014). Gender Differences in Emotional
Intelligence of Adolescents. IJSR-
International Journal of Scientific Research. 3(5), 2275-8179.
[5] Annaraja, P. & Jose,
S.(2005).Emotional Intelligence of B.Ed.
trainees. Research and Reflection in
Education,2-8-16.
[6] Attri,A,K.,& Rai,B.K.(2013).
Emotional Intelligence of visually impaired adolescents studying in inclusive and exclusive settings. Educational Research International. 2307-3713,1(2),(2013).
[7] Ausubel,D.P.(1968).Educational
Psychology: A cognitive view: New York: Rinchart, Holt and Winston.
[8] Barchard,K.A.(2003). Does emotional
intelligence assists in the prediction of
academic success? Educational and
psychological measurement ,63(5),840-858. http://epm.sagepub.com/content/63/5/840.short .
[9] Bar-on,R.(2006).Emotional and Social
Intelligence: Insights from the Emotional Quotient Inventory. In Bar-on and J.D.A. Parker(Eds), Handbook of Emotional Intelligence.
[10] Best J. W. and J. R.(1995). Research in Education 7th edition Prentice Hall of India New Delhi.
[11] Best,J.W.(1983).Research in education
.New Delhi : Prentice Hall of India.
[12] Bhat ,R. H., Shah, S.,A., &
Kaur,H.(2015). A Study of Emotional Intelligence and its relation with Academic Achievement ., International Journal of Trend in Research and Development ,2(6),ISSN:2394-9333 www.ijtrd.com
[13] Bhatia,(2012). A Study of family
relationship in relation to Emotional
Intelligence of the students of Secondary level. International Journal of Scientific and Research publications,2(12),2012.
[14] Bhattacharya,M.,Dutta,A.K., and
Mandal M.K.(2004). Factor Structure of
Emotional Intelligence in India, Psychological studies. 49,142-146.
[15] Boruah,A.,S.,& Hazarika
,M.,(2015).Emotional Intelligence of Higher
Secondary School Students of
Shivasagar,Distric of Assam. Asian Journal of research in school sciences and Humanities,5(11),2015,37-51,2249-7315. www.aijsh.org
[16] Brody, L.R. & Hall, J.A.(1993).Hand book of emotions. New York: Guilford Press.
[17] Buch, M.B.(1982). Third survey of
Research in Education . Society for Educational development , M.S. University Baroda.
[18] Chamundesari,S.(2013). Emotional
Intelligence and Academic Achievement among students at the Hr. Sec. level. International Journal of Academic Research in Economics and Management Sciences 2(4) ISSN:2226-3624.
[19] Council of Higher Secondary
Education ,Manipur Annual Report 2015,
Babupara,Imphal,795001.
E-mail:cosemimphal@yahoo.co.in 0385-2440883
[20] Council of Higher Secondary
Education, Manipur , Result of Higher Sec.
Exam. 2015, COHSEM, Babupara,
Imphal.795001 cohsemimphal@yahoo.co.in, 0385-2440883
[21] Curnani,P.,Saxena.,(2015). A Study of
Emotional Intelligence in relation to gender and locality of Hr. Sec. Students. IOSR Journal of Humanities and Social Science (IOSR-JHSS),20(12),1(2015)48-50. EISSN:2279-0837,2279-0845. www.iosrjournals.org
[22] Dadvar,R.,Mohamadreyail,M.,Fathaba
di,M.,H.,(2012),ISSN2090-4304. Journal of
Basic and Applied Scientific Research. www.textroad.com
[23] Darsana M.(2007). Relationship
Available online: https://edupediapublications.org/journals/index.php/IJR/ P a g e | 1846
Journal of Community Evidence and Research, 20,2,139-148.
[25] Di, F. A. & Palayyeschi, L. (2009). Emotional Intelligence, Personality Traits and Career Decision Difficulties. International Journal for Educational and Vocational Evidence, 9(2), 135-146. (ERIC Document. EJ848805).
[26] Drago, J. M. (2004). The Relationship
between Emotional Intelligence and Academic
Achievement in non-traditional college
students. Doctoral Dissertation. Walden University.
[27] Farooq A.(2003). Effect of Emotional
Intelligence on academic performance
unpublished Thesis Institute of Clinical Psychology University of Karachi, Pakistan. [28] Gardner, H., (1983). Frames of Mind. New York: Basic Books.
[29] Gogoi, B., (2017). Impact of Parental involvement of the Academic Achievement of adolescents of Sonowal Kachari Tribes of Hapjan Educational Block in Tinsukia District, Assam. International Education & Research Journal (IERJ). 2454-9916, 3(6), 2017.
[30] Goleman, D., (1997). Emotional
Intelligence: Why it can matter more than IQ. New York: Bantom Books.
[31] Goleman, D., (1998). Working with
Emotional Intelligence, New York: Bantom.
[32] Goleman, D., (1998). Working with
Emotional Intelligence. London: Bloomsbury. [33] Good, C.V. (Ed). (1959). Dictionary of Education , New York: Macmillan.
[34] Gupta, M., & Suman, (2017). Effect of types of schools, gender, and Emotional Intelligence of Academic Achievement of Secondary School students: An Analytical
Study. Zenith International Journal of
Multidisciplinary Research 7(2), 2017, 67-81. www.zenithresearch.org,in.
[35] Harrod, N.S., & Scheer S. D., (2005). An exploration of adolescents in relation to
demographic characteristics.
http://journal.sjdm.org/jdm06016.
[36] Harrod, N.S., & Scheer S. D., (2005). An exploration of adolescent Emotional Intelligence in relation to demographic
characteristics. Adolescent. 40(159), 503-12. http://www.ncbi.nlm.nih.gov/pubmed/16268129 .
[37] Herrera,L., Buitrago, R.,E., Cepero, S., (2017). Emotional Intelligence in Colombian Primary School children. Location and gender.,
Universitas Psychologica, 16(3), 1-10,
https://doi.org/10.1144/javariana.upsy16-3.eips.
[38] Hillary, F., (2005). Influence of
Emotional Intelligence on the Academic Achievement of Higher Secondary Students. Unpublished M.Phil. Thesis, Mahatma Gandhi University, Kottayam.
[39] Jayawardena,L.,N.,A.,Ch., &
Jayawardena,L.,N.,A., (2012). Assessing the Emotional Intelligence of Sri Lankan High School Students: A Case Study. Management,
Knowledge and Learning, International
Conference (2012), chandanadj@gmail.com. [40] Kar, D., Saha, B., & Mondal, Ch. (2014). Measuring Emotional Intelligence of Secondary School students in relation to gender and residence: An Empirical Study. American Journal of Educational Research, 2014(2), 4, 193-196. DOI: 10.12691/education-2-4-3© Science and Education Publishing.
[41] Katoch, A., (2013). A study of
Emotional Intelligence of Adolescent Student in relation to the type of school. International Journal of Behavioral social and movement sciences. ISSN: 2277-7547. www.ijobsm.in. [42] Kattekar, S.,S., (2010). A Comparative Study of Intelligence Quotient and Emotional Quotient on Academic Achievement in Kannada language. Research Analysis and Evaluation. 1(5). 43-44.
[43] Malik, M., Akhter, M., Fatima, G., & Safder, M., (2013). Emotional Intelligence and Test Anxiety: A Case Study of Unique School
System. Journal of Elementary Education
23(2), 49-56.
[44] Mandal, M.,B., (2017). Emotional