Positive Definite Matrix Space Based Detector with Limited
Training Samples for Multiple Target Situations
Wen Jiang*, Yulin Huang, Guolong Cui, and Jianyu Yang
Abstract—Multiple target situation is a typical situation of nonhomogeneous clutter environment, which can cause excessive target masking in radar signal detection system. In order to reduce target masking caused by multiple target situations, this paper proposes a new detection structure based on positive-definite matrix space and limited training samples. The proposed detection structure uses a positive-definite matrix to estimate the background power level. In addition, with limited training samples, the detection structure is used to resist the multiple target situations. The simulation results show that the proposed detection structure exhibits a better detection performance than that of the well-known CA-CFAR in homogeneous environment. The detector also performs robustly in multiple target situations, even though 10 interfering targets exist in a length of 24 samples of reference window. Furthermore, the measured results validate the performance of the proposed method.
1. INTRODUCTION
Obstacles in the flight path usually cause a higher amount of collision accident to low-flying helicopters [1]. The lack of sufficient detection and sensing method for low-flying helicopters leads to disastrous consequence [2–5]. Because the noise and clutter power in practice are often unknown, fixed threshold detection methods cannot be used in the radar signal detection system of low-flying helicopters. This requires the constant false alarm rate (CFAR) detection scheme of an adaptive threshold calculation, and its performance can be almost independent of the noise and clutter power level. The cell-averaging CFAR (CA-CFAR) is normally applied to the adaptive threshold generation of radar detection system [6,7]. Statistically speaking, if the output of reference window is independent and identically distributed (IID) exponential random variables [8,9], the detection performance of CA-CFAR will be the best possible results when the number of reference cells is very large.
In the real application scene, the detection performance of CA-CFAR will be greatly degraded if the clutter environment is multiple target situations, which results in extreme target masking [10–19]. The multiple target situations of low-flying helicopters consist of some large spiky and discrete clutters in the reference cell, such as steep mountains terrain, towers, pylons, aerial cableways and power lines [20,21]. To put forward some variations of CA-CFAR, a class of mean-level detectors is proposed to alleviate the effect of multiple target situations. The smallest-of CFAR (SO-CFAR) [22] exhibits better performance in multiple target situations, but demands that the multiple targets should be restricted to a unilateral reference window. In [23], Smith and Varshney proposed the idea of variability index (VI) detection strategy. The VI-CFAR performs robustly in a homogeneous environment and multiple target situations [24]. However, its detection performance will also be deteriorated if the interfering targets are not restricted to a unilateral reference window [23].
Received 20 June 2017, Accepted 4 September 2017, Scheduled 22 September 2017
* Corresponding author: Wen Jiang ([email protected]).
presence of interference targets. After that, in [30], the authors proposed an automatic dual censoring cell averaging (ADCCA)-CFAR detector, which uses the membership function of the OS processor and two thresholds to determine and censor the interfering samples. In [31], Kononov and Kim presented an adaptive OFPI-CFAR detector, which essentially uses information on positions at which estimated outlier-free samples appear in the full reference window and the statistics of the sample in the cell under test. It is shown that the OFPI-CFAR exhibits excellent detection performance in multiple target environments.
Although the aforesaid CFAR detectors in the multiple target situations show their merits, all the authors fail to discuss the detection performance under the condition of limited training samples.
Recently, geometry based parameter estimation method is applied to radar signal processing. These algorithms do not need any statistical information of the considered data and are proposed in the open literature. In [32, 33], an algorithm based on the Riemannian medians and means of secondary matrices for radar target detection is presented. Besides, a class of geometric barycenter (GB) based signal processing methods has been illustrated to estimate the covariance matrix [34–37]. In detail, any detector of this category is bound with an appropriate distance in the positive-definite matrix space.
In this study, we open up a new detection structure working in multiple target situations, which is based on positive-definite matrix space and limited training samples. The proposed detection structure uses a positive-definite matrix to estimate the background power level. In addition, this detection structure is used in limited training samples to resist the multiple target situations. As positive-definite matrix space and limited training samples are the main characteristic of this detector which makes it different from other detectors, we call it PDLT. The simulation results indicate that the detection performance of PDLT is robust in both homogeneous and multiple target situations. Especially, with limited training samples, PDLT exhibits a better detection performance than the well-known CA-CFAR in a homogeneous environment. The PDLT also performs robustly in multiple target situations, even though 10 interfering targets exist in a length of 24 samples of reference window. Furthermore, the experimental result leads to the conclusion quantitatively that PDLT exhibits better detection performance than other classic detectors.
The paper is organized as follows. First, the PDLT concept is detailed. Second, the performance analysis results for multiple target situations are summarized. Meanwhile, measured data validate the basic performance of PDLT. Finally, we summarize and conclude the paper.
2. PDLT DETECTOR 2.1. Idea Behind PDLT
Like all sliding window detectors [38], the PDLT detector makes a target present/absent judgment depends on the value of adaptive threshold compared to the value of test cell. The adaptive threshold is calculated by the product of clutter/noise power level and a background multiplier constant. The characteristic of PDLT depends on how the clutter/noise power level is calculated.
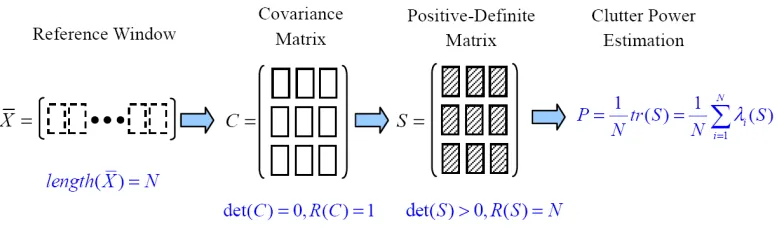
Figure 1. The idea behind PDLT.
power estimation of PDLT. The covariance matrixCis made of a lengthN of reference window, namely
C = ¯XX¯T. The determinant (det) of covariance matrix C is 0, and its rank (R) is 1, which make it a singular matrix. Since the detection framework demands that the matrices should be positive-definite, optimization method must be used to build positive definiteness. The optimization method is described in the next subsection. After getting the positive-definite matrixS, we can see that det(S)>0 and its
R(S) =N. Finally, the arithmetic average of diagonal elements of S is used to form the clutter power
P. Meanwhile,P also equals the arithmetic mean of eigenvalues of S.
In Figure 1, from covariance matrix C to positive-definite matrix S, R(C) = 1 is transformed to
R(S) =N, which means expansion of the eigenvalues ofC. The clutter power estimationP is arithmetic mean of eigenvalues of S, which acts as compressors of the eigenvalues, and hence they de-emphasise the effect of outliers [34, 35]. Additionally, besides the aforementioned mathematical operation, we find that the clutter power estimation method proposed in PDLT is robust under the condition of limited training samples (smallN), which is an significant way to resist multiple target situations.
2.2. Description of PDLT Algorithm
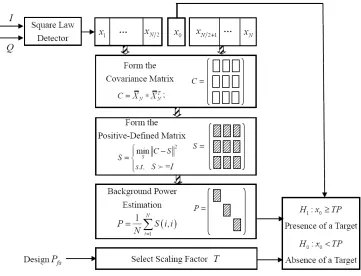
Considering what mentioned above, the detection structure based on positive-definite matrix space and limited training samples are proposed to resist the multiple target situations. The detector block diagram of PDLT is given in Figure 2. In-phase and quadrature (I and Q) signals represent radar time/range echoes from a matched filter. First, theI andQ returns are square-law envelope detected. Then, theN+ 1 returns are serially transported into a tapped delay line. TheN+ 1 returns represent a test cell x0 centered inN reference cell. Especially, limited training samples are adopted in PDLT.
The PDLT algorithm is illustrated as follows.
(1) The reference cells ¯XN ={xi, i= 1,2, . . . , N}are first used to form the covariance matrix:
C= ¯XNX¯NT. (1)
(2) We suppose that the spectral density of the white noise is known and give the definite expression of the aforesaid positive definiteness. The positive-definite matrix S is obtained by minimising the Frobenius norm of covariance matrixC under the condition of S I (for any Hermitian matrix,A0 denotes that A is a positive semi-defindite matrix). Theorem 1 gives an explicit expression of the estimator.
Theorem 1: The positive definite matrix S which minimises the Frobenius norm from covariance matrixC under the condition of SI is the optimisation problemP, which is expressed as
P : min
S C−S
2, s.t. S I. (2)
The optimal solution to Eq. (2) is
S =UΛU (3)
where Λ = diag([λk,1, ...,1]) with λk = max(1,X¯N2), and U is a unitary matrix consisting of the eigenvectors ofC with the first eigenvector responding to the eigenvalueX¯N2.
Figure 2. PDLT block diagram.
(3) After getting the renewed positive-definite matrix S, the arithmetic mean of its diagonal elements is used to form the clutter power:
P = 1
N
N
i=1
S(i, i). (4)
(4) Next, based on the desired probability of false alarm Pf a, we select the corresponding scaling factorT. Pf arequires that the values of corresponding adaptive thresholdsT P are determined to ensure explicit false alarm in a homogeneous environment. Namely, Pf a is defined as the probability such that a test cell x0 in homogeneous environment is classified as target
Pf a =Prob[x0 ≥T P |Homogeneous Environment]. (5)
Since the closed-form expression for Pf a is not available in PDLT, we use standard Monte Carlo tests withM = P100
fa independent trials to obtain T.
(5) Lastly, we make a target present decision which depends on the test cell compared to the adaptive threshold. The hypothesis test is given by:
H1:x0≥T P;H0 :x0 < T P. (6)
HypothesisH1corresponds to the case where a target exists in test cell, whileH0denotes the hypothesis
where the test cell is declared only clutter/noise.
From the aforementioned algorithm flow, we can conclude that the PDLT detector proposed in this paper employs positive-definite matrix space and limited training samples to estimate background power level. It can bring significant benefits to resist multiple target situations.
3. PERFORMANCE ANALYSIS OF PDLT
illustrate the detection performance of PDLT under condition of limited training samples. Then we use PDLT with limited training samples to resist multiple target situations.
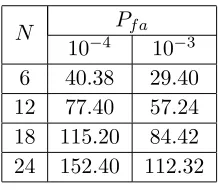
Zero mean IID Gaussian random process is used to assume the I and Q input signals for a noise/clutter background. As a result, the envelope amplitude of square-law detector output is an IID exponentially distributed random variable. Single pulse processing and Swerling II targets are adopted in this paper. Table 1 shows some examples ofT as a function ofN andPf a in a homogeneous background. We observe that T steadily increases as N increases. Pf a = 10−4 is adopted in the simulation.
Table 1. T values as a function of N and Pf a.
N Pf a
10−4 10−3 6 40.38 29.40 12 77.40 57.24 18 115.20 84.42 24 152.40 112.32
3.1. Homogeneous Environment with Different Number of Training Samples
In homogeneous environment, we compare the detection performance of PDLT to the well-known CA-CFAR and OS-CA-CFAR. When the number of reference cells is large, it is important to note that CA-CA-CFAR is the best possible result in IID exponential random variables [8, 9]. kOS is set to 0.75N for the OS-CFAR, which is the optimal censoring parameter [25].
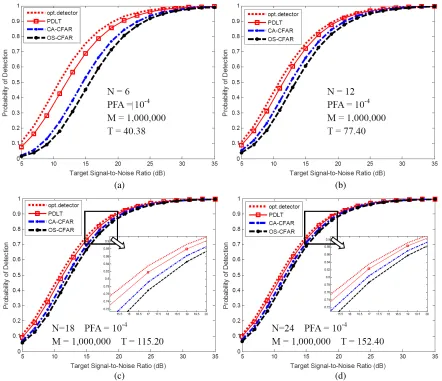
Then we compare the probabilities of detection (PD) for different detectors with optimal detector,
whose PD equalsP
1 1+SNR
f a . Figure 3 shows the PD in homogeneous environment, which is obtained with 6, 12, 18 and 24 reference cells.
From Figure 3, we can see that all the processors show some probability loss compared to the optimal detector. The PDLT demonstrates the best performance. The CA-CFAR and OS-CFAR are worse than PDLT. Particularly, from Figure 3(a), the number of reference cells is set toN = 6, which is a typical case of limited training samples compared with other published papers (N = 24 orN = 36).
Additionally, compared with the optimal detector, the additional losses [8] of PDLT, CA-CFAR and OS-CFAR are illustrated in Table 2 (Pd= 0.5).
Table 2. Comparing with the optimal detector, the additional losses of PDLT, CA-CFAR and OS-CFAR (Pd= 0.5).
Detector N
6 12 18 24
PDLT 1.2 dB 0.6 dB 0.5 dB 0.4 dB CA-CFAR 3.7 dB 1.8 dB 1.2 dB 0.9 dB OS-CFAR 4.8 dB 2.6 dB 1.7 dB 1.3 dB
(a) (b)
(c) (d)
Figure 3. Probability of detection (PD) comparison of PDLT, CA-CFAR and OS-CFAR in homogeneous environment: (a) N = 6. (b) N = 12. (c) N = 18. and (d)N = 24.
Besides, Figure 4 shows the PD at very low target signal-to-noise ratio (SNR), which is also obtained with 6, 12, 18 and 24 reference cells. The horizontal axis represents SNR, while the vertical axis represents a base 10 logarithmic scale of PD [39].
From Figure 4, we can see that the PDLT demonstrates the best performance under low SNR condition. The CA-CFAR and OS-CFAR are worse than PDLT. Meanwhile, it is easy to find that all the detectors converge toPf a= 10−4 as SNR decreases.
From the above analysis, it can be concluded that the proposed estimator is robust in the condition of limited training samples (N = 6). Then we use PDLT with limited training samples to resist multiple target situations.
3.2. Multiple Target Situations with Different Number of Interfering Targets
In multiple target situation, besides CA-CFAR and OS-CFAR, we compare the detection performance of PDLT to the ACCA-ODV, which is an symbolic order-statistic based CFAR detector for multiple target situations [29]. For the ACCA-ODV, the value ofPf c is set equal to 10−2 and the value of (N, p) set equal to (24,16).
(c)
(a) (b)
(d)
Figure 4. PD comparison of PDLT, CA-CFAR and OS-CFAR in homogeneous environment at very low target signal-to-noise ratio (SNR): (a) N = 6. (b) N = 12. (c) N = 18. and (d)N = 24.
Figure 5. Designed multiple target situation.
I stands for the number of interference targets. The interference targets are assumed to have the same radar cross-section (RCS) as the primary target. Compared with traditional CA-CFAR, OS-CFAR and ACCA-ODV, PDLT detector with limited training samples (N = 6) is adopted in the simulation.
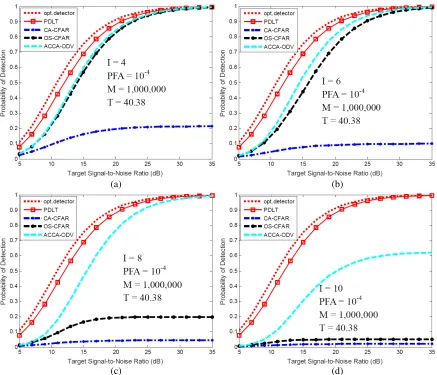
Figure 6 shows the PD of different processors in the designed multiple target situations, which is obtained with 4, 6, 8 and 10 interference targets in the reference cell.
(c)
(a) (b)
(d)
Figure 6. PD comparison of PDLT, CA-CFAR, OS-CFAR and ACCA-ODV in the designed multiple target situations: (a) I = 4. (b)I = 6. (c) I = 8. and (d)I = 10.
degradation occurs even forI = 10. The detection performance of CA-CFAR and OS-CFAR is degraded excessively due to the existence of interference targets in reference cell. The excessive degradation in performance occurs when I ≥ 4 for the CA-CFAR. The excessive degradation in performance occurs when I = 8 (I > N −kos = 6) for the OS-CFAR. The excessive degradation in performance occurs when I = 10 (I > N −p= 8) for the ACCA-ODV.
Additionally, compared with the optimal detector, the additional losses of PDLT and ACCA-ODV are illustrated in Table 3 (Pd= 0.5).
It is easy to find that the losses get bigger as I increases for the ACCA-ODV. Compared with the optimal detector, the additional losses are about 1.2 dB and 9.3 dB, respectively for the PDLT and
Table 3. Comparing with the optimal detector, the additional losses of PDLT and ACCA-ODV (Pd= 0.5).
Detector I
4 6 8 10
(c)
(a) (b)
(d)
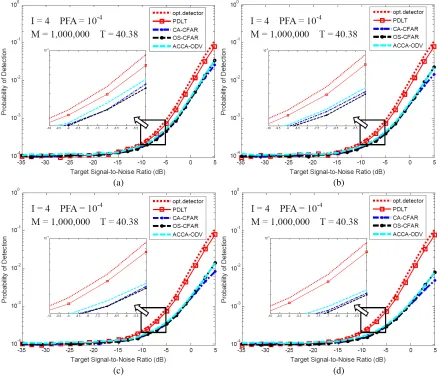
Figure 7. PD comparison of PDLT, CA-CFAR, OS-CFAR and ACCA-ODV in the designed multiple target situations at very low target SNR: (a)I = 4. (b) I = 6. (c) I = 8. and (d)I = 10.
ACCA-ODV, to ensureI = 10. With limited training samples, the simulation results indicate that the detection performance of PDLT is considerably better than the well-known ACCA-ODV in multiple target situations.
Besides, Figure 7 shows the PD at very low target SNR, which is also obtained with 4, 6, 8 and 10 interference targets in the reference cell. The horizontal axis represents SNR, while the vertical axis represents a base 10 logarithmic scale of PD.
From Figure 7, we can see that the PDLT demonstrates the best performance under low SNR condition. The CA-CFAR, OS-CFAR and ACCA-ODV are worse than PDLT. Meanwhile, it is easy to find that all the detectors converge toPf a= 10−4 as SNR decreases.
From the above analysis, it can be concluded that the proposed PDLT detection scheme is robust in multiple target situations, even though 10 interfering targets exist in a length of 24 samples of reference window.
3.3. CFAR Property
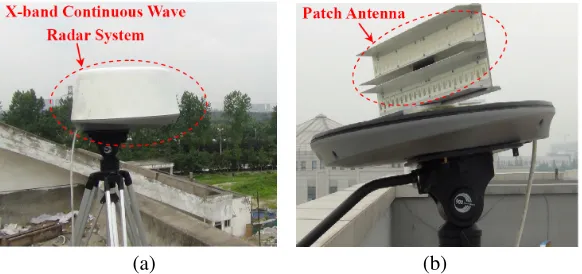
(a) (b)
Figure 8. Experimental radar system: (a) Overview of the system. (b) Patch antenna.
Figure 9 shows the work pattern of this experiment. The radar is installed on the roof of a building. The pitch angle is set to 5◦, and the scan coverage is set to±45◦. The radar scans the coverage in 2.5 s in a continuous azimuth scan mode.
(a) (b)
Figure 9. Experimental work pattern: (a) Side view. (b) Top view.
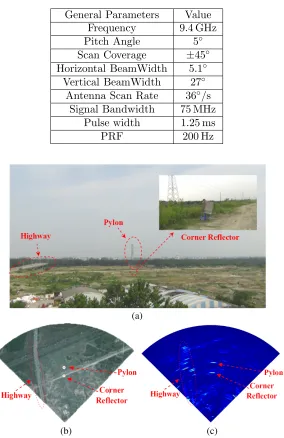
The signal parameters are listed in Table 4.
Table 4. Experimental parameters.
General Parameters Value Frequency 9.4 GHz Pitch Angle 5◦ Scan Coverage ±45◦ Horizontal BeamWidth 5.1◦
Vertical BeamWidth 27◦ Antenna Scan Rate 36◦/s
Signal Bandwidth 75 MHz Pulse width 1.25 ms
PRF 200 Hz
(b)
(a)
(c)
Figure 10. Data collection scene: (a) Optical image corresponding to the target scene. (b) Corresponding Google Maps. and (c) Corresponding radar data matrix.
represent samples in the azimuth direction, whereas data in the same column represent samples in the range direction.
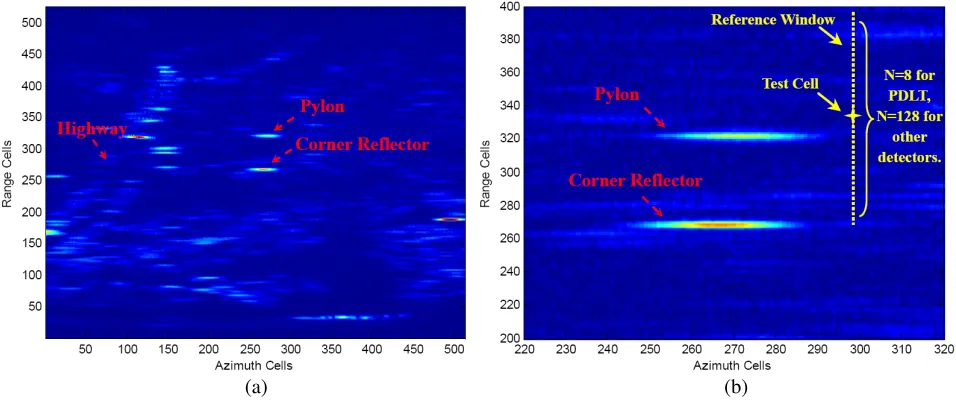
In addition, Figure 11 offers two styles of zoom-in views of the radar data matrix, which are displayed in a B-scope plot. From Figure 11(a), we can see that pylon and corner reflector are close to each other in the range direction. Therefore, the two targets can simulate the multiple target situation of a nonhomogeneous clutter environment. Different detectors are operated at each resolution cell using a sliding window along each column of the radar echo matrix. The number of guard cells is set to 2. The number of reference cells, N, is set to 128 for traditional detectors. Especially, PDLT detector with limited training samples (N = 8) is adopted in the experiment. One example of test cell and its reference window is marked in Figure 11(b).
(a) (b)
Figure 11. Two styles of zoom-in view of the radar echo matrix: (a) Data matrix displayed in a B-scope plot. and (b) Zoom-in view of pylon and corner reflector.
number of largest cells censored from the reference window is set equal to 30. kOS is set to 0.75N = 96 for the OS-CFAR. For the ACCA-ODV, the value of Pf c is set equal to 10−1, and the value of (N, p) is set equal to (128,85). The original target scene is also given in Figure 12(a). The data matrix in Figure 12(a) consists of 201 range cells and 101 azimuth samples.
From Figure 12(b), it can be seen that both pylon and corner reflector are well detected based on PDLT in the real multiple target situations. Figures 12(c)–(f) show the SO-CFAR, CMLD, OS-CFAR and ACCA-ODV detection results on the chosen target scene. We can see that the main drawback of traditional detectors is the excessive number of miss detections. The results show that PDLT exhibits robust detection performance for the pylon on chosen target scene, which is better than classic SO-CFAR, CMLD, OS-CFAR and ACCA-ODV.
Finally, we are engaged in a quantitative performance analysis of the PDLT and traditional detectors in the presence of real data. The performance analysis is conducted on the chosen target scene shown in Figure 12(a). In order to complete the performance analysis, one assessment criterion is defined, namely the number of miss detections (NMD). The NMD is calculated by counting the undetected targets falling into Test Window 1. Test Window 1 is shown in Figure 12(a) and consists of 4 range cells and 30 azimuth cells. The total number of samples available for estimating the NMD is 120.
The NMD is summarized in Table 5. Same as the detection result shown in Figure 12, we can see that the main drawback of SO-CFAR, CMLD, OS-CFAR and ACCA-ODV is the excessive NMD. The result leads to the conclusion quantitatively that PDLT exhibits better detection performance than other classic detectors.
Table 5. Performance analysis of the PDLT, SO-CFAR, CMLD, OS-CFAR and ACCA-ODV on the real data.
Detector Number of miss detections (NMD)
PDLT 12
SO-CFAR 69
CMLD 90
OS-CFAR 68
ACCA-ODV 89
(c)
(a) (b)
(d)
(e) (f)
target situations even when 10 interfering targets exist in a length of 24 samples of reference window, which is better than the symbolic order-statistic based detector ACCA-ODV. Finally, the real data lead to the conclusion quantitatively that PDLT exhibits better detection performance than SO-CFAR, CMLD, OS-CFAR and ACCA-ODV in multiple target situations.
Possible future research tracks might concern the CFAR property of PDLT and extend to the detection structure with a non-Gaussian distributed background [44–51] and various fluctuating targets environments [52–54].
ACKNOWLEDGMENT
This work is supported by the National Natural Science Foundation of China (No. 61671117, No. 61401078, No. 61771113). The authors thank the anonymous reviewers for their constructive criticisms that have helped to improve the manuscript significantly.
REFERENCES
1. Seidel, C., I. Schwartz, and P. Kielhorn, “Helicopter collision avoidance and brown-out recovery with HELLAS,”In Proceedings of the SPIE Europe Security and Defence, International Society for Optics and Photonics, 71140G–71140G, Cardiff, UK, 2008.
2. Lynch, D., Introduction to RF Stealth, Scitech Publishing, Raleigh, USA, 2004. 3. Skolnick, M., Radar Handbook, McGraw-Hill Companies, New York, USA, 2008.
4. Malaek, S. and A. Kosari, “Novel minimum time trajectory planning in terrain following flights,” IEEE Transactions on Aerospace and Electronic Systems, Vol. 43, 2–12, 2007.
5. Malaek, S. and A. Kosari, “Dynamic based cost functions for TF/TA flights,”IEEE Transactions on Aerospace and Electronic Systems, Vol. 48, 44–63, 2012.
6. Finn, H. and R. Johnson, “Adaptive detection mode with threshold control as a function of spatially sampled clutter-level estimates,”RCA review, Vol. 29, 414–464, 1968.
7. Liu, N. N., J. W. Li, and Y. F. Cui, “A new detection algorithm based on CFAR for radar image with homogeneous background,”Progress In Electromagnetics Research C, Vol. 15, 13–22, 2010. 8. Weiss, M., “Analysis of some modified cell-averaging CFAR processors in multiple-target
situations,”IEEE Transactions on Aerospace and Electronic Systems, Vol. 18, 102–114, 1982. 9. Magaz, B., A. Belouchrani, and M. Hamadouche, “Automatic threshold selection in OS-CFAR
radar detection using information theoretic criteria,” Progress In Electromagnetics Research B, Vol. 30, 157–175, 2011.
10. Khalighi, M. A. and M. H. Bastani, “Adaptive CFAR processor for nonhomogeneous environments,” IEEE Transactions on Aerospace and Electronic Systems, Vol. 36, 889–897, 2000.
12. Tabet, L. and F. Soltani, “A generalized switching CFAR processor based on test cellstatistics,” Signal, Image and Video Processing, Vol. 3, 265–273, 2009.
13. Kim, J. H. and M. R. Bell, “A computationally efficient CFAR algorithm based on a goodness-of-fit test for piecewise homogeneous environments,”IEEE Transactions on Aerospace and Electronic Systems, Vol. 49, 1519–1535, 2013.
14. Maio, A. D., A. Farina, and G. Foglia, “Design and experimental validation of knowledge-based constant false alarm rate detectors,” Radar, Sonar &Navigation, IET, Vol. 1, 308–316, 2007. 15. Wang, W., Y. Ji, and X. Lin, “A novel fusion-based ship detection method from pol-SAR images,”
Sensors, Vol. 15, 25072–25089, 2015.
16. Hammoudi, Z. and F. Soltani, “Distributed CA-CFAR and OS-CFAR detection using fuzzy spaces and fuzzy fusion rules,” Radar, Sonar and Navigation, IEE Proceedings-. IET, Vol. 151, 135–142, 2004.
17. Cao, T. T., “Constant false-alarm rate algorithm based on test cell information,” Radar, Sonar & Navigation, IET, Vol. 2, 200–213, 2008.
18. Boudemagh, N. and Z. Hammoudi, “Automatic censoring CFAR detector for heterogeneous environments,” AEU-International Journal of Electronics and Communications, Vol. 68, 1253– 1260, 2014.
19. Berbra, K., M. Barkat, and A. Anou, “PN code acquisition using smart antenna and adaptive thresholding CFAR based on ordered data variability for CDMA communications,” Progress In Electromagnetics Research B, Vol. 57, 139–155, 2014.
20. Gini, F. and M. Rangaswamy, Knowledge Based Radar Detection, Tracking and Classification, John Wiley & Sons, Hoboken, USA, 2008.
21. Jiang, W., Y. Huang, and J. Yang, “Automatic censoring CFAR detector based on ordered data difference for low-flying helicopter safety,”Sensors, Vol. 16, 1055, 2016.
22. Trunk, G. V., “Range resolution of targets using automatic detectors,” IEEE Transactions on Aerospace and Electronic Systems, Vol. 14, 750–755, 1978.
23. Smith, M. E. and P. K. Varshney, “Intelligent CFAR processor based on data variability,” IEEE Transactions on Aerospace and Electronic Systems, Vol. 36, 837–847, 2000.
24. Tan, Y., Q. Li, Y. Li, and J. Tian, “Aircraft detection in high-resolution SAR images based on a gradient textural saliency map,”Sensors, Vol. 15, 23071–23094, 2015.
25. Rohling, H., “Radar CFAR thresholding in clutter and multiple target situations,” IEEE Transactions on Aerospace and Electronic Systems, Vol. 19, 608–621, 1983.
26. Gandhi, P. P. and S. A. Kassam, “Analysis of CFAR processors in nonhomogeneous background,” IEEE Transactions on Aerospace and Electronic Systems, Vol. 24, 427–445, 1988.
27. Rickard, J. T. and G. M. Dillard, “Adaptive detection algorithms for multiple-target situations,” IEEE Transactions on Aerospace and Electronic Systems, Vol. 13, 338–343, 1977.
28. Himonas, S. D. and M. Barkat, “Automatic censored CFAR detection for nonhomogeneous environments,”IEEE Transactions on Aerospace and Electronic Systems, Vol. 28, 286–304, 1992. 29. Farrouki, A. and M. Barkat, “Automatic censoring CFAR detector based on ordered data
variability for nonhomogeneous environments,” Radar, Sonar and Navigation, IEE Proceedings-. IET, Vol. 152, 43–51, 2005.
30. Zaimbashi, A. and Y. Norouzi, “Automatic dual censoring cell-averaging CFAR detector in nonhomogenous environments,”Signal Processing, Vol. 88, 2611–2621, 2008.
31. Kononov, A. A., J. H. Kim, J. K. Kim, and G. Kim, “A New Class of Adaptive CFAR Methods for Nonhomogeneous Environments,” Progress In Electromagnetics Research B, Vol. 64, 145–170, 2015.
32. Arnaudon, M., L. Yang, and F. Barbaresco, “Stochastic algorithms for computing p-means of probability measures, geometry of radar Toeplitz covariance matrices and applications to HR Doppler processing,”Radar Symposium (IRS), 2011 Proceedings International, 651–656, 2011. 33. Arnaudon, M., F. Barbaresco, and L. Yang, “Riemannian medians and means with applications to
39. Sanz-Gonzalez, J. L. and F. Alvarez-Vaquero, “Nonparametric rank detectors under K-distributed clutter in radar applications,”Aerospace and Electronic Systems, IEEE Transactions on, Vol. 41, 702–710, 2005.
40. Maio, A. D. and M. S. Greco,Modern Radar Detection Theory, SciTech Publishing, Raleigh, USA, 2016.
41. Orlando, D., F. Bandiera, and G. Ricci, Advanced Radar Detection Schemes Under Mismatched Signal Models, Morgan and Claypool Publishers, 2009;
42. Maio, A. D., “Rao test for adaptive detection in gaussian interference with unknown covariance matrix,” IEEE Transactions on Signal Processing, Vol. 55, 3577–3584, 2007.
43. Richards, M. A., J. A. Scheer, and W. A. Holm, Principles of Modern Radar: Basic principles, SciTech Publishing, Raleigh, USA, 2010.
44. Wang, C., M. Liao, and X. Li, “Ship detection in SAR image based on the alpha-stable distribution,” IEEE Signal Processing Letters, Vol. 8, 4948–4960, 2008.
45. Meng, X., “Performance analysis of ordered-statistic greatest of-constant false alarm rate with binary integration for M-sweeps,”Radar, Sonar & Navigation, IET, Vol. 4, 37–48, 2010.
46. Pourmottaghi, A., M. Taban, and S. Gazor, “A CFAR detector in a nonhomogenous Weibull clutter,”Aerospace and Electronic Systems, IEEE Transactions on, Vol. 48, 1747–1758, 2012. 47. Weinberg, G. V., “Asymptotic performance of the geometric mean detector in pareto distributed
clutter,”IEEE Signal Processing Letters, Vol. 23, 1538–1542, 2016.
48. Habib, M. A., M. Barkat, B. Aissa, and T. A. Denidni, “CA-CFAR detection performance of radar targets embedded in ‘non centered chi-2 gamma’ clutter,”Progress In Electromagnetics Research, Vol. 88, 135–148, 2008.
49. Gao, Y., R. Zhan, J. Wan, J. Hu, and J. Zhang, “CFAR target detection in ground SAR image based on KK distribution,”Progress In Electromagnetics Research, Vol. 139, 721–742, 2013. 50. Kong, L. J., X. Y. Peng, and T. X. Zhang, “A homogenous reference cells selector for CFAR
detector in highly heterogeneous environment,” Progress In Electromagnetics Research C, Vol. 41, 175–188, 2013.
51. Yang, M., G. Zhang, C. Guo, and M. Sun, “A coarse-to-fine approach for ship detection in SAR image based on CFAR algorithm,” Progress In Electromagnetics Research M, Vol. 35, 105–111, 2014.
52. Cui, G., A. Maio, V. Carotenuto, and L. Pallotta, “Performance prediction of the incoherent detector for a weibull fluctuating target,”IEEE Transactions on Aerospace and Electronic Systems, Vol. 50, 2176–2184, 2014.
53. Cui, G., A. D. Maio, and M. Piezzo, “Performance prediction of the incoherent radar detector for correlated generalized Swerling-chi fluctuating targets,” IEEE Transactions on Aerospace and Electronic Systems, Vol. 49, 356–368, 2013.