RIVER RUIRU, KENYA
ODONGO KENNETH OUMA (B.Ed.Sc.)
A Thesis Submitted in Partial Fulfillment of the Requirements for the Award of the Degree of Master of Science (Animal Physiology) in the School of Pure and Applied Sciences of Kenyatta University
DECLARATION
I declare that this research thesis is my original work and has not been presented in any other University for consideration of any certification
Signature………Date………. Kenneth Ouma Odongo
I56/CE/11500/2008
We confirm that the work presented in this research thesis was carried out by the candidate under our supervision
Signature………... Date……….. Dr. Syprine A. Otieno
Department of Zoological Sciences, Kenyatta University
Signature………... Date……….. Dr. Rekha R. Sharma
DEDICATION
ACKNOWLEDGEMENT
I am grateful to my supervisor, Dr Syprine A Otieno for her guidance, help, words of encouragement and advice during the study. I would also like to express my appreciation to my second supervisor, Dr Rekha R Sharma for her guidance, encouragement, indispensable comments and suggestions during the course of this study.
I am also grateful to all the staff of the Department of Zoological Sciences, especially Prof Michael Gicheru for his important suggestions and advice, Mr Patrick Mulwa for accepting to accompany me to the study sites during sampling, Mr Eliud Muhoro and Ms Mary Waruguru, for their patience, time, encouragement, and wealth of skills they imparted to me throughout this work, particularly during the preparation of tissues for histological studies, and Mr Charles Kiarie and Mr Lawrence Munyua for assistance with the preparation of photomicrographs. My appreciation also goes to the staff, Department of Ichthyology, National Museums of Kenya, for assisting me in identifying the fish studied.
TABLE OF CONTENTS
DECLARATION... ii
DEDICATION... iii
ACKNOWLEDGEMENT ... iv
TABLE OF CONTENTS ... v
LIST OF TABLES ... viii
LIST OF FIGURES ... ix
LIST OF PLATES ... x
LIST OF APPENDICES ... xi
ACRONYMS AND ABBREVIATIONS ... xii
ABSTRACT………...……….xiii
CHAPTER ONE: INTRODUCTION ... 1
1.1 Background information ... 1
1.2 Statement of the problem ... 2
1.3 Justification of the study ... 3
1.4 Objectives of the study ... 5
1.4.1 General objective ... 5
1.4.2 Specific objectives ... 5
1.5 Research questions ... 5
1.6 Hypothesis ... 5
1.7 Significance of the study ... 6
CHAPTER TWO: LITERATURE REVIEW ... 7
2.1 Heavy metal pollution in water ... 7
2.2 Heavy metal pollution in sediments ... 11
2.3 Heavy metal pollution in fish ... 12
CHAPTER THREE: MATERIALS AND METHODS ... 16
3.1 Study area ... 16
3.2 Study design ... 19
3.4 Water quality parameters ... 20
3.5 Collection of water samples ... 20
3.6 Collection of sediment samples ... 21
3.7 Sampling of fish ... 21
3.8 Preparation and analysis of heavy metals in water samples ... 22
3.9 Preparation and analysis of heavy metals in sediment samples ... 22
3.10 Preparation and analysis of heavy metals in fish tissues ... 23
3.11 Histological procedures ... 23
3.12 Control ... 24
3.13 Data analysis ... 24
CHAPTER FOUR: RESULTS ... 25
4.1 Water quality parameters ... 25
4.2 Levels of iron in sediments along River Ruiru ... 27
4.3 Levels of iron in water ... 28
4.4 Levels of lead in sediments ... 29
4.5 Levels of lead in water ... 30
4.6 Levels of chromium in sediments ... 31
4.7 Levels of chromium in water ... 32
4.8 Correlation between levels of iron, lead and chromium in sediments andwater during the three months of sampling ... 33
4.9 Levels of metals in the tissues of Clarias gariepinus and Oreochromis niloticussampled from the upstream study sites along River Ruiru ... 35
4.10 Levels of metals in the tissues of Clarias gariepinus and Oreochromisniloticus sampled from the downstream study sites along River Ruiru ... 36
4.11 Levels of iron, lead and chromium in tissues of Clarias gariepinus from the upstream and downstream sites along River Ruiru ... 37
4.12 Levels of iron, lead and chromium in tissues of Oreochromis niloticusfrom the upstream and downstream study sites along River Ruiru ... 37
4.14 Relationship between levels of iron and fish morphometrics in
Oreochromis niloticus ... 39
4.15 Relationship between levels of lead and fish morphometrics in Clarias gariepinus at the upstream and downstream study sites ... 41
4.16 Relationship between levels of lead and fish morphometrics in Oreochromis niloticus at the upstream and downstream study sites ... 42
4.17 Relationship between levels of chromium and fish morphometrics in Clarias gariepinus at the upstream and downstream study sites ... 42
4.18 Morphological effects of iron, lead and chromium in the liver and gills of Clarias gariepinus and Oreochromis niloticus ... 43
4.19 Permissible values of iron, lead and chromium in fish ... 49
CHAPTER FIVE: DISCUSSION ... 50
5.1 Levels of iron, lead and chromium in sediments and water along River Ruiru ... 50
5.2 Levels of iron, lead and chromium in the liver, gills and muscle of Clarias gariepius and Oreochromis niloticus ... 52
5.3 Morphological effects of iron, lead and chromium in liver and gills of Clarias gariepinus and Oreochromis niloticus ... 58
5.4 Total mean levels of iron, lead and chromium in fish ... 63
CHAPTER SIX: CONCLUSIONS AND RECOMMENDATIONS ... 65
6.1 Conclusions ... 65
6.1.1 Concentration of lead, iron and chromium in water and sediments in River Ruiru ... 65
6.1.2 Concentration of lead, iron and chromium in the gills, liver and muscles in Clarias gariepinus and Oreochromis niloticus in River Ruiru ... 65
6.1.3 Morphological effects of lead, iron and chromium on the gills and liver of Clarias gariepinus and Oreochromis niloticus in River Ruiru ... 66
6.2 Recommendations ... 66
6.2.1. Policy recommendations ... 66
6.2.2 Suggestions for further research ... 66
LIST OF TABLES
Table 4.1: Values for water quality parameters at the upstream and downstream sampling sites along River Ruiru during the months of April, August and
December...26 Table 4.2: Relationship between levels of metals in sediments and in water at the upstream study sites along River Ruiru during the months of April, August and
December………..34 Table 4.3: Relationship between levels of metals in sediments and in water at the
downstream study sites along River Ruiru during the of April, August and
December………..34 Table 4.4: Mean levels of iron, lead and chromium in the tissues of Clarias gariepinus
and Oreochromis niloticus sampled from the upstream study sites along
River Ruiru………...35 Table 4.5: Mean levels of iron, lead and chromium tissues of Clarias gariepinus and
Oreochromis niloticus from the downstream study sites along River Ruiru…………36 Table 4.6: Mean levels of iron, lead and chromium in tissues of Clarias gariepinus from
the upstream and downstream study sites along River Ruiru during the months of April, August and December………...37 Table 4.7: Mean levels of iron, lead and chromium in tissues of Oreochromis niloticus from
upstream and downstream study sites along River Ruiru during the months of
April, August and December………38 Table 4.8: Relationship between levels of iron in selected tissues and fish morphometrics
in Clarias gariepinus at the upstream and downstream study sites………..39 Table 4.9: Relationship between levels of iron in selected tissues and fish morphometrics
in Oreochromis niloticus at the upstream and downstream study sites………40 Table 4.10: Relationship between levels of lead in selected tissues and fish morphometrics in Clarias gariepinus at the upstream and downstream study sites……….41 Table 4.11: Relationship between levels of lead in selected tissues and fish morphometrics in Oreochromis niloticus at the upstream and downstream study sites………..42 Table 4.12: Comparison of levels of iron, lead and chromium in
LIST OF FIGURES
Figure 3.1: Map showing the sampling sites along the course of River Ruiru………..17 Figure 4.1: Levels of iron in sediments during the months of April, August and December
at the upstream and downstream study sites along RiverRuiru………...28 Figure 4.2: Levels of iron in water during the months of April, August and December at
the upstream and downstream study sites along River Ruiru………..29 Figure 4.3: Levels of lead in sediments during the months of April, August and
December at the upstream and downstream study sites along River Ruiru…………30 Figure 4.4: Levels of lead in water during the months of April, August and December at
the upstream and downstream study sites along River Ruiru………..31 Figure 4.5: Levels of chromium in sediments during the months of April, August and
December at the upstream and downstream sampling sites along River Ruiru……...32 Figure 4.6: Levels of chromium in water during the months of April, August and December
LIST OF PLATES
Plate 4.1: Liver of Clarias gariepinus obtained from the upstream study sites, showing
normal hepatocytes with nuclei (Haematoxylin and Eosin, ×400)……...43 Plate 4.2: Liver of Oreochromis niloticus obtained from the upstream study sites, showing
normal hepatocytes with nuclei (Haematoxylin and Eosin, ×400)...44 Plate 4.3: Liver of Clarias gariepinus obtained from the downstream study sites, showing enlarged hepatocytes (Haematoxylin and Eosin, ×400)………45 Plate 4.4: Liver of Oreochromis niloticus obtained from the downstream study sites,
showing enlarged nuclei (Haematoxylin and Eosin, × 400)...………...46 Plate 4.5: Gills of Clarias gariepinus obtained from the upstream study sites, showing gill
filaments and lamellae (Haematoxylin and Eosin, × 150)………...47 Plate 4.6: Gills of Oreochromis niloticus obtained from the upstream study sites, showing gill filament and lamellae (Haematoxylin and Eosin, × 150)………...47 Plate 4.7: Gills of Clarias gariepinus obtained from the downstream study sites, showing
proliferation of intralamellar epithelial cells, which also show hyperplasia
(Haematoxylin and Eosin, × 150)………..48 Plate 4.8: Gills of Oreochromis niloticus obtained from the downstream study sites, showing
fusion of secondary lamellae and hyperplasia due to increased multiplication of
LIST OF APPENDICES
ACRONYMS AND ABBREVIATIONS
AAS Atomic Absorption Spectrophotometer ALAD – D Delta Aminolevulinic Acid Dehydrase
ATSDR Agency for Toxic Substances and Diseases Registry CBD Central business district
EU European Union
EIA Environmental Impact Assessment FAO Food and Agriculture Organization HE Haematoxylin Eosin
ROS Reactive Oxygen Species SD Standard Deviation TDS Total dissolved solids
ABSTRACT
CHAPTER ONE INTRODUCTION
1.1 Background information
River Ruiru originates from the slopes of the Aberdare Ranges and flows through Ruiru Town. It is subjected to pollutants and experience different impacts from anthropogenic sources along the channels and in the catchments (Bundambula and Mwachiro, 2006). The main human activities in the catchment include intensive agriculture, animal husbandry, silviculture, horticulture, charcoal burning and quarrying (UNEP, 2001). Water drainage from districts located upstream carry large quantities of pollutants (Mwenda and Guthiga, 2010). There are problems of agricultural runoff containing organic wastes, fertilizers, pesticides and weed killers that is discharged into the river (UNEP, 2001).
extension of irrigation and modern agricultural practices (UNEP, 2001).There has been growing concern about the health status of aquatic species in relation to environmental pollution. Industrial effluents, raw sewage and wastes from human settlements along rivers have polluted them, causing health hazard to those communities and stress on the aquatic ecosystem (UNEP, 2001).
Kenya, like other African countries, has been affected by the global food crisis. High food prices are an international problem, according to a report released by Food and Agriculture Organization (Ministry of Agriculture, 2009). It was noted that the urban poor and small scale farmers are among the worst affected groups. Ruiru River has been reported to harbor fish such as tilapia, catfish, and common carp among others (UNEP, 2001). Anecdotal reports indicate that there are occasional fishing activities along the river. Fish in the aquatic food chain bioaccumulate and store organic and inorganic pollutants in organs such as the liver, gills and kidneys, which may be passed through the food chain to other organisms that consume fish such as birds, besides human beings. Fish are also important in maintaining the ecological balance of plankton communities and other aquatic invertebrates and may concentrate large amounts of metals from water (Abdulali et al., 2011).
1.2 Statement of the problem
concentrations are toxic, affecting various organs and tissues in fish (Ramazan et al., 2011). It also causes death of fish and their absence in polluted areas, hence affecting ecological balance. The heavy metals could find their way, through food webs into the bodies of birds and other vertebrates that feed on them. Fish forms an important source of protein to humans. Anecdotal reports indicate that there are isolated cases of fishing by resource – poor individuals living along the river banks. Such fish could find their way to the consumer markets, exposing unsuspecting individuals to the harmful effects of heavy metals. Assessing levels of heavy metals in fish tissues can point to the extent to which people consuming such fish are exposed to health risks. The current study investigates the extent of accumulation of iron, lead and chromium in the gills, liver and muscles of Clarias gariepinus and Oreochromis niloticus, the effects of metals on liver and gills, as well as levels of the metals in water and sediments from the river.
1.3 Justification of the study
preventive measures to reduce the pollution effects by the time chronic effects become visible (Ramazan et al., 2011).
The target tissues of heavy metals in fish are metabolically active ones which accumulate high level of metals such as liver, kidney and gills, while muscles and skins accumulate less level of metals, due to low metabolic activities (Ekpo et al., 2013). Fish liver is a key organ which controls many life functions and plays a prominent role in fish physiology, both in anabolism (proteins, lipids and carbohydrates) and catabolism (nitrogen, glycogenolysis, detoxification) and it acts as a storage center for glycogen and other (Neveen et al., 2010). Fish gills are vulnerable organ for the toxicants because they are in direct contact with the surrounding water (Muthukumaravel et al., 2013). Alterations in gill structure affect the normal functioning of vital physiological processes such as gas and ion exchanges, osmoregulation, excretion of nitrogenous wastes and acid – base equilibrium (Piyanut et al., 2008; Muthukumaravel et al., 2013).
1.4 Objectives of the study 1.4.1 General objective
To determine the levels of heavy metals in sediments, water, tilapia and catfish species along River Ruiru.
1.4.2 Specific objectives
i. To determine the concentration of lead, iron and chromium in water and sediments in River Ruiru.
ii. To determine the concentration of lead, iron and chromium in the gills, liver and muscles in Clarias gariepinus and Oreochromis niloticus in River Ruiru. . iii. To assess the morphological effects of lead, iron and chromium on the gills and
liver of tilapia and catfish in River Ruiru. 1.5 Research questions
i. What are the levels of lead, iron and chromium in water and sediments in River Ruiru?
ii. What are the levels of lead, iron and chromium in the gills, liver and muscles in Clarias gariepinus and Oreochromis niloticus in River Ruiru?
iii. What are the morphological effects of the heavy metals on organs and tissues of Clarias gariepinus and Oreochromis niloticus along River Ruiru?
1.6 Hypothesis
ii. There is no relationship between levels of iron, lead and chromium in water and sediments, and in selected tissues of Clarias gariepinus and Oreochromis niloticus along River Ruiru.
1.7 Significance of the study
Fish makes an important contribution to nutrition in terms of proteins, minerals, micronutrients and essential fatty acids. They also form an important part of the food chain in aquatic ecosystems (Jezierska and Witeska, 2009). Discharging wastes containing heavy metals in rivers may affect fish and endanger the lives of birds, reptiles, and even humans through consumption of contaminated fish (Jezierska and Witeska, 2009). Besides, high levels of heavy metals may lead to migration of fish from polluted areas or even their death, affecting the ecological balance.
CHAPTER TWO LITERATURE REVIEW 2.1 Heavy metal pollution in water
Heavy metals are trace elements that are at least five times denser than water (John, 2002). Iron, lead and chromium are among the metals found to be of highest importance to fisheries and pollute rivers in zones affected by effluents released from industries, sewages, and agricultural drains, hence were selected for this study. Ruiru River is subjected to pollutants arising from agricultural and industrial activities and has been reported to harbor various flora and fauna, including several fish species such as tilapia, catfish and common carp (UNEP, 2001).
Iron is the fourth element in order of abundance on earth, and its presence in water originates from rock dissolution, minerals, steel production and industrial wastewater (Avenant and Marx, 2000;Crafford and Avenant, 2011). Iron solubility and toxicity in water is affected by pH, dissolved oxygen, presence of organic acids, chloride concentration, exposure to sunlight and ferrous iron occurs at lower pH, and precipitates out of solution as ferric iron at higher pH in the presence of oxygen (Freshwater Aquatic Resources, 2011). Fish and crustaceans are the most susceptible taxa to chronic toxicity of iron (Freshwater Aquatic Resources, 2011). Areas with high traffic densities and industrial activities can be sources of iron and can result from vehicles body rust, road structures such as bridges and guard rails and moving engine parts. Industrial waste effluents such as petroleum based chemicals containing metals and metals from micro-enterprises and “Jua-kali” workshops can be washed out into the river. Oil and grease containing
stainless steels. Iron oxides and hydroxides are used as pigments in cosmetics. Iron uses include magnets, dyes, pigments, and abrasives (Crafford and Avenant, 2011).
Lead is the most widely used nonferrous metal since it is corrosion resistant, dense, ductile and malleable (Ana and Dietrich, 2006). Every year, industry produces about 2.5 million tons of lead throughout the world, mostly used for batteries (Ravichandran, 2011). Lead based paints, pesticides, auto-emissions and lead acid batteries, electronic wastes, smelting operations, ceramics, and bangle industry contribute to everyday lead exposures. Most of the lead produced in metallic form, in batteries, cable sheathing, sheets and pipes is recovered and recycled, but most lead used in compound form, like paints and petrol additives is lost to the environment, eventually ending up in the aquatic environment. Lead compounds, similar to the ones used in petrol additives are reportedly being used in the production of mercurial fungicides (Ravichandran, 2011).
levels of metal in River Ruiru (Shadrack, 2012). The diffuse nature of waste treatment in Ruiru has contributed to significant environmental degradation especially pollution of the adjacent water bodies. The municipality does not have water-borne sewerage system, has neither waste-water treatment plant nor does it have a proper waste disposal site (The Star, 2012). Poor garbage collection and disposal system in Ruiru can also result to increased levels of pollutants in the river. Wastes dumping site at Murera is close to the River Ruiru and the slope of the landscape around the site means that pollutants can easily percolate into the river during wet seasons (SIPA, 2007).
Lead exists in three physiochemical forms in surface waters depending on physical and organic conditions: dissolved-labile (Pb+2, Pb(OH) 2, and PbCO3), dissolved-bound (colloids or strong
complexes), and particulate (Freshwater Aquatic Resources, 2011). Physical conditions favouring the solubility and bioavailability of lead include low pH and elevated temperatures up to 40°C. The bioavailability of lead is strongly enhanced at decreasing water pH (Adhikari et al., 2006), increasing the toxicity of lead to fish. At water pH less than 6, lead predominates as Pb2+, a form which is bioavailable whereas at water pH 6-10, Pb(OH)2 and PbCO3 are the prevailing
forms in water. Thus at high alkalinity and pH, lead precipitates by forming complexation products and as a result the toxicity and accumulation of lead is least in the fish(Adhikari et al., 2006).
likely to be greater in the food supply of fish in their surrounding water column, making ingestion a common route of exposure (Freshwater Aquatic Resources, 2011).There are several ways by which chromium containing materials could end up in River Ruiru. Most of the chromium could be from industrial activities such as electroplating, textile dyeing and printing, entering the sewerage system and eventually getting into the river. Chromium metal is very resistant to corrosion and so is widely used to plate steel. Garage mechanics within the Ruiru Town offering service activities may wash out paint spraying equipment and flush residues of paint containing zinc chromate down the drain. Photo processing laboratories and laboratories in schools, colleges and hospitals can also make significant inputs of chromium that could be from flushing away waste chemical reagents from the laboratories (Rongo, 2005; Gunnar, 2007).
2.2 Heavy metal pollution in sediments
Water and sediments are used as indicators for the state of pollution of aquatic ecosystem (Opaluwa et al., 2012). Sediments are the sinks for elements in aquatic systems and provide information on the various processes such as sedimentation, water dynamics, sediment contaminant interaction, sediment organism interaction and historical indicators (IAEA, 2003).Heavy metals are highly accumulated in sediment samples than in water samples because sediments contain contaminants and organic matter descending from the ecosystem (Ekpo et al., 2013). The occurrence of enhanced concentrations of certain heavy metals such as chromium and lead can be a good indication of man induced pollution rather than by natural enrichment through geological weathering (Aderinola et al., 2009).
adsorbent surface (UNEP, 2010). Animals which have close relationship with sediment, show relatively high body concentrations of metals (Kamal et al., 2013).In the current study, levels of iron, lead and chromium were therefore evaluated in sediments along the course of River Ruiru.
2.3 Heavy metal pollution in fish
Fish are unique amongst the vertebrates, because there is the potential for nutritive metal acquisition from the water in addition to metal absorption from the diet (Nicolas and Martin, 2003). Various metals are accumulated in fish body in different amounts due to different affinity of metals to fish tissues, different uptake, deposition and excretion rates (Jezierska and Witeska, 2009).Iron is an essential element in animal nutrition but a high content of iron has been associated with several pathological conditions, including liver and heart disease, cancer, neurodegenerative disorders, diabetes, hormonal abnormalities, and immune system abnormalities (Valko et al., 2005; Subash, 2013). The presence of Fe (II) can cause tissue damage through free radical formation and lipid peroxidation (Nicolas and Martin, 2003).
and Kneeland, 2009). Fishes accumulate lead from the polluted environments and the metal is then distributed in their tissues. Lead accumulation among the tissues varies depending on the source, whether food or waterborne. Whatever the exposure route, lead gets accumulated significantly higher in the gills, liver and kidneys. Because fishes are an important food resource and a major aquatic ecosystem component, it is important to assess the adverse effects of lead on fishes (Hmoud et al., 2013).
Chromium (III) is an essential dietary mineral in low doses required to potentiate insulin and for normal glucose metabolism (Valko et al., 2005; Craig and Jacob, 2003). Excessive chromium can be mutagenic, carcinogenic, and teratogenic to a wide variety of organisms. Overall toxicity of chromium to aquatic biota is dependent on water hardness, temperature, pH, chemical speciation, and salinity, but in general, hexavalent chromium is more toxic than trivalent chromium (Craig and Jacob, 2003).The toxicological properties of chromium salts to fish are influenced by factors such as species, age, developmental stage, potential differences in sensitivities of local populations, temperature, pH, salinity, alkalinity of the medium, interaction of chromium with other contaminants, duration of exposure, and the chemical form of chromium (ATSDR, 2008; Freshwater Aquatic Resources, 2011).
indicated that at pH7.8, a considerable amount of chromium accumulated in the internal organs rather than in the gills, whereas the gills retain a greater amount of chromium at pH 6.5 than other organs (Venkatramreddy et al., 2009). Although, further investigations by the same authors revealed histological changes at both pH values, the predominant changes occurred in the gills at pH 6.5. In another study in young rainbow trout, chromium toxicity was 50-200 times higher at pH 6.4 to 7.4 than at pH 7.8 to 8.0. In addition, comparative studies also clearly indicate that chromium levels in gills are higher than in other organs (Venkatramreddy et al., 2009).
Acute poisoning with chromium compounds causes the body surface of fish to be covered with mucus, damages the respiratory epithelium of gills and fish dies of suffocation, while iron compounds precipitate on the gills, reducing the surface area for respiration, damage the respiratory epithelium and suffocate fish (Parvathi et al., 2011). Damages in the gills include dilation of the marginal channel, hyperplasia of the epithelial cells and lifting of the lamellar epithelium. Severe hyperplasia results in the fusion of the secondary lamellae. Alterations such as blood congestion, hypertrophy of epithelial cells and lamellar disorganization also occur (Sermin and Ergul, 2002). Elevated level of urea nitrogen in fish blood reflects abnormalities in gill function or respiratory response (Barad, 2010). Metals exert their toxic effects by generating reactive oxygen species (ROS), causing oxidative stress (Vinodhini and Narayan, 2008). Expulsion of mucus, swelling and necrosis around the gill surface was observed in common carp (Vinothini and Narayan, 2008).
degenerations due to heavy metals (Sermin and Ergul, 2002). Heavy metals cause visible dermal and liver neoplasm, shrinkage of liver cells, which spread with advancing age, accompanied by dissolution of the well-organized liver structure, blood clots and necrosis (Ali and Shakoori, 2011). The researchers observed quantitative alterations in hepatic energy storage macroscopically such as changes in liver size and coloration, and histologically as variations in hepatocellular vacuolation and tinctorial characteristics.
Muscle tissue of fish is frequently used for analysis because it is a target tissue for metal storage and is the main edible part of the fish (Bhupander et al., 2011). However, muscles accumulate lower levels of metal than other active metabolite organs (Kazim, 2011). In muscles, metal level increase with increasing age of fish and higher levels of metals in younger fish indicates the short residence time of metals within the fish, combined with higher rate of metabolism compared to older fish (Zheng et al., 2007). There are higher levels metal in the ventral muscle tissues of fishes due to long contact with sediments with high metal levels (Ling et al., 2013).
CHAPTER THREE MATERIALS AND METHODS 3.1 Study area
This study was conducted along River Ruiru in Kiambu County. Six main sampling stations along the river were sampled during the study. The river originates from the slopes of the Aberdare Range and flows through numerous coffee plantations and then through Ruiru Town. Ruiru Town is located on the transitional zone of the Upper Athi Basin and the Kikuyu Plateau. The land is generally undulating with a general drainage pattern towards the Athi river basin. Ruiru River divides the township into two parts. To the North-West the town’s topography is generally steep and dissected by Mukuyu and Ruiru Rivers (EIA Report, 2011). Besides agricultural activities, these areas are also characterized by housing and industrial development (EIA Report, 2011). There are many informal settlements along the river, with no proper sewage and solid waste disposal system despite the large population. The river also passes through areas where some industries discharge their wastes into it (UNEP, 2001). Human activities along River Ruiru therefore, affect animals living in the downstream sections of the along the River.
Figure 3.1 Map showing sampling sites along the course of River Ruiru.
107’54”
109’50” 109’50”
36055’52” 3701’18”
36055’52” 3701’18”
Map of Kenya
LEGEND
River S- Sampling sites
0 1 km N
s5
s4
s3
s2 s1
107’54”
However, the higher areas to the North West are characterized by deeply dissected topography with numerous streams and ridges, while the south eastern parts are lowlands with fewer streams, shallower and wider valleys. The average altitude is about 1520 meters above mean sea level.
Agriculture is a major economic activity carried out in Ruiru and the county government’s functions in agriculture include: crop and animal husbandry; livestock sale yards; county abattoirs; plant and animal disease control; and fisheries (Kiambu County Government Report, 2014). The climatic conditions favor major cash crops such as coffee and horticultural produce (Makokha et al., 2001). Crops grown are used for both subsistence and commercial purposes. Coffee is the major cash crop grown in this area; it is locally processed while excess is exported abroad. Some farmers also practice horticulture and floriculture farming which is usually practiced in greenhouses. For instance, Red Lands Roses established in 1996 in Ruiru specializes in growing and exporting T-Hybrid and spray roses in a range of over 100 varieties in greenhouses. Cereals such as maize and beans are mainly for domestic purposes, however the surplus is usually transported to neighboring towns such as Nairobi and Thika. Dairy cattle are also kept for the provision of milk and other dairy products. Fish farming in this area has also flourished following the economic stimulus program (ESP) government project (The Star, 2011).
3.2 Study design
This study adopted a research design that utilized comparative design. Fish were captured using gill nets and water samples collected with plastic bottles. Levels of lead, iron and chromium in samples of water and sediments from sampling sites at the downstream reaches along River Ruiru were compared with levels in samples collected from three study sites located at the section of the river upstream of Ruiru Town, which served as control. Oreochromis niloticus and Clarias gariepinus samples were analyzed to determine the concentrations of lead, iron and chromium in the gills, liver and muscles. Comparison was made with tissues and organs of fish sampled from the reference sites on the upstream parts of the river that are not subjected to high levels of pollutants. Morphology of gills and liver of fish sampled from the downstream parts of the river were assessed and comparison made with the fish sampled from the reference sites.
3.3 Sampling and sample size
Sampling sites were 100 meters apart, as determined before starting the survey in accordance with the levels of pollution besides the geology of the region and the processes that influence the existing sediment distribution, such as erosion, transportation and accumulation. Sites with sufficient number of samples were therefore purposively identified during the preliminary studies. Six water samples, six composite sediment samples and eighteen samples of each fish species were collected from the river during each month of study.
Samples were collected once a month during the months of December 2012, April 2013 and August 2013. The three months were selected so as to account for the variations in levels of iron, lead and chromium studied in water, sediments and in the tissues of fish due to the effects of dry and rainy seasons.
3.4 Water quality parameters
Water quality parameters were determined at each sampling site during each session of sampling water and sediments. Temperature, pH, and electrical conductivity were determined using Hanna digital meter.
3.5 Collection of water samples
Concentrated nitric acid was added to reduce the pH to 2 and to preserve the water samples until analyzed for iron, lead and chromium at Department of Chemistry, Kenyatta University.
3.6 Collection of sediment samples
Sampling of sediments was conducted by the River bank at the sampling points for water. These were collected directly, using a hand-held trowel from the surface (5 – 20 cm). Two equal portions of sediment were taken at each sampling site, homogenized thoroughly in a plastic container to obtain a mixture representative of the area sampled, giving a total of six composite samples from the downstream and upstream study sites along the course of the River Ruiru. Surface water was decanted from the sample while taking care to retain the fine sediment fraction during the procedure. The composite sediment samples were then transferred with a plastic laboratory spoon to labeled plastic containers.
3.7 Sampling of fish
centimeters immediately after collection. The fish used in this study measured between 15 to 30 centimeters and weighed between 30 and 180 grams.
3.8 Preparation and analysis of heavy metals in water samples
A preservative, nitric (V) acid (HNO3) was added to the original sample in order to ensure that
metals do not adhere to the walls of the container. Sample aliquots for digestion were taken after vigorous shaking to ensure suspension of solids that may have settled. Water samples were digested on a hot plate using hydrochloric acid (HCl) and HNO3 on a volume: volume ratio (1%:
0.5%). Digested samples were then filtered, diluted to 100 cm3, then analyzed for lead, iron and chromium using Buck Scientific Atomic Absorption Spectrophotometer model 210 VGP, at the Department of Chemistry, Kenyatta University. Three samples of water from each sampling site were analyzed.
3.9 Preparation and analysis of heavy metals in sediment samples
Samples were air-dried in the laboratory at room temperature. Once air-dried, sediment samples were powdered and passed through 160 μm sieve. Sediments samples were then weighed and
placed into the digestion flasks with 10 millilitres of HNO3/HCl (1:3 v/v) and digested on a hot
3.10 Preparation and analysis of heavy metals in fish tissues
Fish were dissected and muscle, gills, and liver were excised and dried separately in an oven at 80oC for two days to constant dry weight. These were ground using porcelain mortar and pestle (Poldoski, 1980). A half gram dry weight of the powdered form of muscle and gill and 0.1 gram dry weight liver samples were digested by adding 3 millilitres of HNO3 (65%) and 1millilitre
hydrogen peroxide (35%). Samples were then transferred to volumetric flasks and diluted to 50 millilitres for muscle and gills and 25 millilitres for liver because of the smaller mass of liver samples, using deionized water, then filtered using Whatman filter paper. Concentrations of lead, iron and chromium were determined using Atomic Absorption Spectrophotometer. Level of these metals in water, sediment and in fish tissues were compared in the downstream and upstream sections along the course of Ruiru River, and with the maximum allowable levels set by the World Health Organization (WHO) and the United States Environmental Protection Agency (USEPA).
3.11 Histological procedures
Fish were dissected and pieces of gills and liver excised and fixed in Bouin’s solution for 48
haematoxylin and eosin stains, and examined using light microscope at a magnification of ×150 and ×400.
3.12 Control
Levels of iron, lead and chromium in water, sediments and in fish gills, liver and muscle samples collected from the sampling sites located at the downstream sections along the course of River Ruiru were compared with levels in samples obtained from the control sections along the course of the river identified asS4, S5, and S6,(Figure 3.1) based on the assumption that they were not contaminated with lead, iron and chromium arising from industrial wastes and human activities in Ruiru Town. Histology sections of liver and gills of fish obtained from the downstream sections along the river were also compared with those from the control sites.
3.13 Data analysis
Data on levels of lead, iron and chromium in water, sediments and fish gills, liver and muscles was analyzed by means of one way analysis of variance. Correlation coefficient was also calculated to assess the association between biotic factors such as weight and length of fish, and
the concentration of metals in fish gills, liver, and muscles. It was also used to determine the
association between levels of heavy metals in water and sediments and levels in fish gills, liver
CHAPTER FOUR RESULTS
4.1 Water quality parameters
The lowest temperature values were recorded during the month of April at the upstream study sites (20.33 ± 0.140C) and at the downstream study sites (21.22 ± 0.170C) along River Ruiru
(Table 1). In this month, there was no significant difference in water temperature between the upstream and downstream study sites along the river, p = 0.001. During the month of August, temperature values were found to be significantly lower at the upstream study sites (20.89 ± 0.180C) compared to the downstream study sites (21.67 ± 0.120C), p = 0.0025. The highest temperature values were recorded during the month of December at the upstream (23.33 ± 0.120C), and at the downstream (24.22 ± 0.170C) study sites (Table 4.1). The differences in temperature value at the two study sites were also found to be statistically significant during the month of December (p = 0.0005). The mean differences in temperature values during the three months were also found to be statistically significant both at the upstream (F = 112.54, p < 0.001) and downstream (F = 110.78, p < 0.001) study sites (Table 4.1).
site along the river (6.51 ± 0.07), p < 0.001). Seasonal variations in the mean values of pH during the three months were also statistically significant, both at the upstream (F = 99.58, p < 0.001) and downstream (F = 59.14, p < 0.001) study sites along the river (Table 4.1).
Table 4.1: Mean values (±SD) for water quality parameters at the upstream and downstream sampling sites along River Ruiru during the months of April, August and December
Temp (0C) pH Electrical conductivity (µS/cm)
TDS (mg/L)
April Upstream 20.33±0.14 5.97±0.02 424.00±0.88 34.67±0.94 Downstream 21.22±0.17 5.87±0.02 592.11±1.72 72.11±1.48
P value 0.001 0.0026 <0.001 <0.001
August Upstream 20.89±0.18 6.79±0.01 761.11±8.80 38.89±1.21 Downstream 21.67±0.12 6.53±0.02 1003.56±11.57 56.11±1.27
P value 0.0025 <0.001 <0.001 <0.001
December Upstream 23.33±0.12 6.51±0.07 839.78±10.91 54.89±0.75 Downstream 24.22±0.17 6.10±0.07 1162.00±10.31 68.00±1.41 P value 0.0005 <0.0008 <0.001 <0.001
TDS: Total dissolved solids
sites were found to be statistically significant (p < 0.001), (Table 4.1). The highest values in electrical conductivity were recorded at the downstream sites during the month of December. In December, there were significant differences in the mean values of electrical conductivity recorded at the upstream (839.78 ± 10.91 µS/cm) and also at the downstream study sites (1162.00 ± 10.31 µS/cm) (p < 0.001). Also, there were significant differences in mean values of electrical conductivity during the months of April, August and December at the upstream study sites (F = 741.83, p < 0.001) and at the downstream study sites (F = 1067.07, p < 0.001) along the river (Table 4.1).
The mean value of total dissolved solid (TDS) recorded in April at the upstream study sites (34.67 ± 0.94 mg/L), was statistically lower compared to the values recorded at the downstream study sites (72.11 ± 1.48mg/L) (p < 0.001). In August, the differences in TDS mean values at the upstream (38.89 ± 1.21mg/L) and downstream study sites (56.11 ± 1.27mg/L) were also statistically significant (p < 0.001). During the month of December, the mean values of TDS were significantly higher at the downstrean study sites (68.00± 1.41 mg/L) compared to the upstream study sites along River Ruiru (54.89 ± 0.75mg/L) p < 0.001. The seasonal variations in the mean values of TDS in River Ruiru during the three months also diferred significantly both at the upstream (F = 117.16, p < 0.001) and the downstream study sites (F = 35.69, p < 0.001) (Table 4.1).
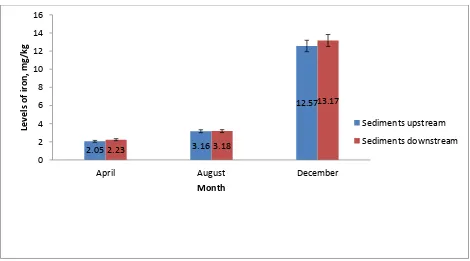
4.2 Levels of iron in sediments along River Ruiru
mean values of iron in sediments at the upstream and downstream study sites in April, August and December were not statistically significant. However, the levels of iron in sediments during the three months were significantly higher in December, followed by August, then April both at the upstream study sites (F = 399.84, p < 0.001) and at the downstream study sites along River Ruiru (F = 574.95, p < 0.001) (Figure 4.1).
Figure 4.1: Levels of iron in sediments (mg/kg) during the months of April, August and December at the upstream and downstream study sites along River Ruiru.
4.3 Levels of iron in water
In April and August, the mean levels of iron were found to be higher in water samples obtained from the downstream sampling sites compared to levels in samples from the upstream sites along although the differences were not statistically significant. In December, there were significantly higher levels of iron in water samples from the downstream study sites along River Ruiru (4.26 ± 0.21mg/L) compared to the mean levels of iron recorded at the upstream study sites along the
2.05 3.16 12.57 2.23 3.18 13.17 0 2 4 6 8 10 12 14 16
April August December
river (2.81 ± 0.21mg/L), (p = 0.007). These were the highest levels of iron that were recorded in water samples along the river. Levels of iron in water were significantly higher in December, followed by April, then August at the upstream study sites (F = 10.17, p = 0.012), and also at the downstrean study sites along the river (F = 141.90, p < 0.001) (Figur 4.2).
Figure 4.2: Levels of iron in water (mg/L) during the months of April, August and December at the upstream and downstream study sites along River Ruiru.
4.4 Levels of lead in sediments
The levels of lead in sediments showed an increasing trend from the month of April, August to December both at the upstream and downstream study sites along River Ruiru. The differences in the mean levels of lead in sediments at the upstream and downstream study sites were not statistically significant in April, August and December. However, the levels of lead in sediments during the three months were found to be significantly higher in December, followed by August, then April both at the upstream study sites (F = 43.10, p < 0.001) and at the downstream study sites along River Ruiru (F = 41.84; p < 0.001) (Figure 4.3).
1.64 0.82 2.81 2.31 0.88 4.26 0 0.5 1 1.5 2 2.5 3 3.5 4 4.5 5
April August December
Figure 4.3: Levels of lead in sediments (mg/kg) during the months of April, August and December at the upstream and downstream study sites along River Ruiru.
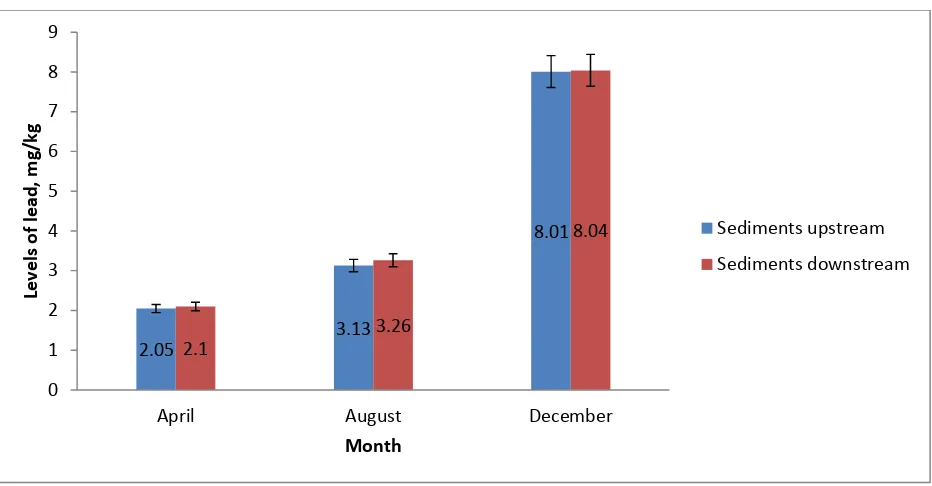
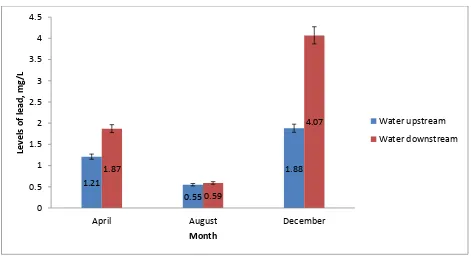
4.5 Levels of lead in water
The differences in mean levels of lead in water at the upstream and downstream study sites were not statistically significant in April and in August. During the month of December, there were significantly higher levels of lead in water at the downstream sampling sites (4.07 ± 0.53mg/L) compared to the mean levels of lead in water at the upstream sampling sites along River Ruiru (1.88 ± 0.54mg/L), (p = 0.044) (Figure 4.4). In this study, it was also found that the differences in levels of lead in water during the three months of April, August and December were not statistically significant at the upstream study sites along River Ruiru (F = 1.501, p = 0.296). However, the levels of lead in water were significantly higher in December, followed by April, then August at the downstream study sites (F = 33.199, p = 0.0006) (Figure 4.4).
2.05 3.13 8.01 2.1 3.26 8.04 0 1 2 3 4 5 6 7 8 9
April August December
Figure 4.4: Levels of lead in water (mg/L) during the months of April, August and December at the upstream and downstream study sites along River Ruiru.
4.6 Levels of chromium in sediments
Levels of chromium were lower in sediments sampled from the upstream sections along River Ruiru compared to the levels in samples from the upstream sections. In April, there were significantly higher levels of chromium in sediments at the downstream study sites along the river (3.27 ± 0.25mg/kg) compared to the levels of chromium in sediments at the upstream sections along the river (1.86 ± 0.24mg/kg), (p = 0.015) (Figure 4.5). The differences in mean levels of chromium in sediments at the upstream and downstream study sites were not statistically significant in August and in December. However, comparison by months of sampling shows that levels of chromium in sediments were significantly higher in December, followed by April, then August at the upstream study sites (F = 14.48, p = 0.0051), and also at the downstream study sites (F = 64.20, p = 0.0001) (Figure 4.5).
1.21 0.55 1.88 1.87 0.59 4.07 0 0.5 1 1.5 2 2.5 3 3.5 4 4.5
April August December
Figure 4.5: Levels of chromium in sediments (mg/kg) during the months of April, August and December at the upstream and downstream sampling sites along River Ruiru.
4.7 Levels of chromium in water
The levels of chromium in water were higher in the downstream study sites along River Ruiru compared to the upstream sampling sites. In April, there were significantly higher levels of chromium in water at the downstream study sites along the river, (2.36 ± 0.19 mg/L) compared to the levels of chromium in water at the upstream study sites (1.67 ± 0.14 mg/L) (p = 0.045) (Figure 4.6). In December, the differences in mean levels of chromium in water at the upstream study site (2.22 ± 1.01 mg/L) and at the downstream study sites, (5.30 ± 0.31 mg/L), were found to be statistically significant (p = 0.043). There were significantly higher levels of chromium in water during the month of December, followed by April, then August at the downstream study sites (F = 125.63, p < 0.001) (Figure 4.6).
1.86 1.04 4.67 3.27 1.43 6.05 0 1 2 3 4 5 6 7
April August December
Figure 4.6: Levels of chromium in water (mg/L) during the months of April, August and December at the upstream and downstream study sites along of River Ruiru.
4.8 Correlation between levels of iron, lead and chromium in sediments and water during the three months of sampling
There was a significant positive correlation in levels of iron in sediments and water at the upstream study sites along River Ruiru during the months of April, August and December (r = 0.7319, p = 0.025) (Table 4.2).
1.67 0.54 2.22 2.36 0.58 5.3 0 1 2 3 4 5 6
April August December
Table 4.2: Relationship between levels of metals in sediments (mg/kg ± SD) and in water (mg/L ± SD) at the upstream study sites along River Ruiru during the months of April, August and December
Upstream study sites
Sediments Water r p
Iron 5.81±1.62 1.75±0.32 0.731 0.025
Lead 4.39±0.94 1.21±0.33 0.3429 0.366
Chromium 2.52±0.60 1.47±0.38 0.534 0.138
(Correlation value is significant at P ≤ 0.05, Pearson linear correlation, α = 0.05).
Also, in the downstream sites along River Ruiru, there was a significant positive correlation (r = 0.8506, p = 0.0037) showing that high levels of iron in the sediments rose as levels of the metal in water increased (Table 4.3). There was no significant correlation in levels of lead in sediments and water at the upstream study sites (r = 0.343, p = 0.366) (Table 4.2). However at the downstream study sites, there was a significant correlation (r = 0.7523, p = 0.019) (Table 4.3).
Table 4.3: Relationship between levels of metals in sediments (mg/kg ± SD) and in water (mg/L ± SD) at the downstream study sites along River Ruiru during the months of April, August and December
Downstream study sites
Sediments Water R p
Iron 6.19±1.75 2.48±0.49 0.8506 0.0037
Lead 4.46±0.94 2.17±0.53 0.7523 0.01935
Chromium 3.58±0.68 2.74±0.69 0.9787 0.000
The levels of chromium in sediments and water at the upstream study sites along River Ruiru showed a positive correlation (r = 0.5339, p = 0.138), which was not statistically significant (Table 4.2). In the downstream study sites along the river, the value for r was 0.9787. This is a significant positive correlation, showing that higher levels of chromium in the sediments rose up as the levels of chromium in water increased (p < 0.001) (Table 4.3).
4.9 Levels of metals in the tissues of Clarias gariepinus and Oreochromis niloticus sampled from the upstream study sites along River Ruiru
In general, Clarias gariepinus recorded higher mean levels of the three metals compared toOreochromis niloticus, although the differences were not significant (Table 4.4).
Table 4.4: Mean levels of iron, lead and chromium (mg/kg ± SD) in the tissues of Clarias gariepinus and Oreochromis niloticus sampled from the upstream study sites along River Ruiru
Part of the body
Fish Species Fe
(mean±SE) mg/kg
Pb
(mean±SE) mg/kg
Cr
(mean±SE) mg/kg
Liver Clarias gariepinus 3.67±0.54 0.84±0.30 0.62±0.18
Oreochromis niloticus 2.71±0.44 0.555±0.21 0.50±0.14
p-value 0.1792 0.4834 0.619
Gills Clarias gariepinus 2.73±0.54 0.26±0.12 0.27±0.1
Oreochromis niloticus 1.85±0.30 0.26±0.10 0.15±0.04
p-value 0.165 0.9974 0.295
Muscles Clarias gariepinus 2.11±0.46 0.25±0.07 0.16±0.06
Oreochromis niloticus 1.38±0.23 0.15±0.05 0.13±0.04
4.10 Levels of metals in the tissues of Clarias gariepinus and Oreochromis niloticus sampled from the downstream study sites along River Ruiru
The results of this study show that all the tissues of Clarias gariepinus collected from the downstream study sites along River Ruiru had higher levels of all the studied metals compared to the tissues of Oreochromis niloticus obtained from the same sites. Both species of fish studied had higher levels of iron than lead in all the tissues. The level of chromium was lowest of the metals analyzed. Besides, both fish species accumulated the heavy metals in the same trend in the tissues, the liver containing higher levels of the metals than gills, while muscles contained the least levels (Table 4.5).
Table 4.5: Mean levels of iron, lead and chromium in the tissues of Clarias gariepinus and Oreochromis niloticus (mg/kg ± SD) sampled from the downstream study sites along River Ruiru
Part of the body
Fish species Fe
(mean±SE) mg/kg
Pb
(mean±SE) mg/kg
Cr
(mean±SE) mg/kg
Liver Clarias gariepinus 5.24±0.86 1.36±0.46 0.68±0.19
Oreochromis niloticus
3.55±0.58 0.69±0.28 0.56±0.15
p-value 0.112 0.225 0.631
Gills Clarias gariepinus 3.17±0.50 0.75±0.26 0.33±0.11
Oreochromis niloticus
2.08±0.30 0.44±0.14 0.17±0.06
p-value 0.072 0.306 0.211
Muscles Clarias gariepinus 2.34±0.42 0.46±0.15 0.20±0.06
Oreochromis niloticus
1.68±0.25 0.29±0.09 0.15±0.04
4.11 Levels of iron, lead and chromium in tissues of Clarias gariepinus from the upstream and downstream sites along River Ruiru
In Clarias gariepinus, all the three heavy metals showed higher levels in the tissues of fish collected from the downstream study sites compared to the levels in fish from the upstream study sites along the river. The mean differences were however not statistically significant (Table 4.6).
Table 4.6: Mean levels of iron, lead and chromium (mg/kg ± SD) in tissues of Clarias gariepinus from upstream and downstream study sites along River Ruiru during the months of April, August and December
Liver Gills Muscles
Iron Upstream 3.67±0.55 2.73±0.54 2.11±0.46
Downstream 5.24±0.87 3.17±0.50 2.34±0.42
p 0.132 0.277 0.718
Lead Upstream 0.84±0.3 0.26±0.12 0.25±0.07
Downstream 1.36±0.4 0.75±0.26 0.46±0.15
p 0.352 0.099 0.227
Chromium Upstream 0.62±0.18 0.27±0.1 0.16±0.06
Downstream 0.68±0.19 0.33±0.11 0.20±0.06
p 0.812 0.670 0.697
4.12 Levels of iron, lead and chromium in tissues of Oreochromis niloticus from the upstream and downstream study sites along River Ruiru
Table 4.7: Mean levels of iron, lead and chromium (mg/kg) in tissues of Oreochromis niloticus (mg/kg ± SD) from upstream and downstream study sites along River Ruiru during the months of April, August and December
Liver Gills Muscles
Iron Upstream 2.71±0.44 1.85±0.30 1.38±0.23
Downstream 3.55±0.58 2.09±0.30 1.68±0.25
p 0.254 0.592 0.398
Lead Upstream 0.55±0.21 0.26±0.10 0.15±0.05
Downstream 0.69±0.28 0.44±0.14 0.29±0.09
p 0.694 0.329 0.202
Chromium Upstream 0.50±0.14 0.15±0.04 0.13±0.04
Downstream 0.56±0.15 0.17±0.06 0.15±0.04
p 0.771 0.823 0.761
Table 4.8: Relationship between levels of iron (mg/kg) in selected tissues and fish morphometrics in Clarias gariepinus at the upstream and downstream study sites
Upstream Downstream
Length (cm) Weight (g) Length (cm) Weight (g)
Liver r = 0.151 p = 0.452
r = 0.171 p = 0.393
r = 0.153 p = 0.466
r = 0.147 p = 0.465 Gills r = 0.249
p = 0.210
r = 0.354 p = 0.070
r = 0.364 p = 0.062
r = 0.269 p = 0.174
Muscles r = 0.266 p = 0.180
r = 0.361 p = 0.064
r = 0.317 p = 0.107
r = 0.194 p = 0.332 (* Correlation value is significant at p ≤ 0.05, Pearson linear correlation, α = 0.05)
The results of this study shows that the levels of iron in gills of Oreochromis niloticus caught from the upstream study sites were significantly correlated to length (r = 0.504, p = 0.007), but not significantly correlated to weight in fish obtained from the downstream study sites although the correlation was positive (r = 0.343, p = 0.080). However, there were significant positive correlations between the levels of iron in the gills of Oreochromis niloticus and both length (r = 0.519, p = 0.006) and weight (r = 0.633, p = 0.001) in fish sampled from the downstream study sites along River Ruiru (Table 4.9).
Table 4.9: Relationship between levels of iron (mg/kg)in selected tissues and fish morphometrics in Oreochromis niloticus at the upstream and downstream study sites
Upstream Downstream
Length (cm) Weight (g) Length (cm) Weight (g)
Liver r = 0.535 p = 0.004**
r = 0.358 p = 0.067
r = 0.510 p = 0.007**
r = 0.618 p = 0.001 ** Gills r = 0.504
p = 0.007**
r = 0.343 p = 0.080
r = 0.519 p = 0.006**
r = 0.633 p = 0.001** Muscles r = 0.452
p = 0.018**
r =0.296 p = 0.134
r = 0.438 p = 0.022*
r = 0.507 p = 0.007** (* Correlation value is significant at p ≤ 0.05, Pearson linear correlation, α = 0.05)
in relationships between levels of iron in the muscles of Oreochromis niloticus and the length (r = 0.438, p = 0.022) and also the weight (r = 0.507, p = 0.007), in fish obtained from the downstream study sites (Table 4.9).
4.15 Relationship between levels of lead and fish morphometrics in Clarias gariepinus at the upstream and downstream study sites
In this study, it was found that the levels of lead in the liver, gills and muscles of Clarias gariepinus were positively correlated to both fish length and weight in fish from the upstream study sites, and to both length and weight in fish sampled from the downstream study sites. The relationships were however not statistically significant (Table 4.10).
Table: 4.10 Relationship between levels of lead (mg/kg) in selected tissues and fish morphometrics in Clarias gariepinus at the upstream and downstream study sites
Upstream Downstream
Length (cm) Weight (g) Length (cm) Weight (g)
Liver r = 0.241 p = 0.225
r = 0.156 p = 0.437
r = 0.068 p = 0.708
r = 0.021 p = 0.916 Gills r = 0.157
p = 0.435
r = 0.191 p = 0.340
r = 0.097 p = 0.631
r = 0.129 p = 0.522
Muscles r = 0.264 p = 0.184
r = 0.306 p = 0.121
r = 0.211 p = 0.291
4.16 Relationship between levels of lead and fish morphometrics in Oreochromis niloticus at the upstream and downstream study sites
In Oreochromis niloticus sampled from the upstream study sites along River Ruiru, the levels of lead in fish liver, gills and muscles were found to be positively correlated to fish length and weight but the correlations were not statistically significant(Table 4.11).
Table 4.11: Relationship between levels of lead (mg/kg)in selected tissues and fish morphometrics in Oreochromis niloticus at the upstream and downstream study sites
Upstream Downstream
Length (cm) Weight (g) Length (cm) Weight (g)
Liver r = 0.209 p = 0.295
r = 0.008 p = 0.970
r = 0.288 p = 0.145
r = 0.310 p = 0.115
Gills r =0.166 p = 0.408
r = 0.153 p = 0.445
r = 0.137 p = 0.495
r = 0.237 p = 0.235 Muscles r = 0.248
p = 0.212
r = 0.116 p = 0.563
r = 0.317 p = 0.107
r = 0.288 p = 0.146 (* Correlation value is significant at p ≤ 0.05, Pearson linear correlation, α = 0.05)
4.17 Relationship between levels of chromium and fish morphometrics in Clarias gariepinus at the upstream and downstream study sites
4.18 Morphological effects of iron, lead and chromium in the liver and gills of Clarias gariepinus and Oreochromis niloticus
In the current study, morphological changes in the gills and liver of Clarias gariepinus and Oreochromis niloticus were related to the levels of iron, lead and chromium in water and sediments along River Ruiru. Histology of fish liver from the upstream study site showed normal structure of liver without pathological lesions. The liver of fish comprises a continuous mass of large hexagonal hepatic cells (Plates 4.1 and 4.2). Hepatic cells were of polygonal shape containing spherical nuclei either exocentric or slightly centrally placed (Plates 4.1 and 4.2).
Plate 4.1: Liver of Clarias gariepinus obtained from the upstream study sites, showing normal hepatocytes with nuclei (a) (Haematoxylin and Eosin, × 400).
a
Plate 4.2: Liver of Oreochromis niloticus obtained from the upstream study sites, showing normal hepatocytes with nuclei (a) (Haematoxylin and Eosin, ×400).
In comparison, liver histology results of Clarias gariepinus and Oreochromis niloticus from the downstream sections along Ruiru River showed hepatocytes with loss of normal arrangement (Pates 4.3 and 4.4). Also, the liver of fish had enlarged hepatocytes with enlarged nuclei (Plates 4.3 and 4.4).
a
Plate 4.3: Liver of Clarias gariepinus obtained from the downstream study sites, showing enlarged hepatocytes (a) (Haematoxylin and Eosin, ×400).
a
Plate 4.4: Liver of Oreochromis niloticus obtained from the downstream study sites, showing enlarged nuclei (a) (Haematoxylin and Eosin, × 400).
Gills of Clarias gariepinus and Oreochromis niloticus obtained from the upstream study sites along River Ruiru exhibited normal gill structure. The primary gill filaments in each arch had two rows and were joined at the base by a gill septum. The primary gill lamellae had central supporting axes with rows of secondary gill lamellae on its sides (Plates 4.5 and 4.6). In contrast, fish gills from the downstream sections along the river showed proliferation of the intralamellar epithelial cells which also showed hyperplasia and fusion of the secondary lamellae (Plates 4.7 and 4.8).
a
Plate4.5: Gills of Clarias gariepinus obtained from the upstream study sites, showing gill filaments and lamellae (b) (Haematoxylin and Eosin, × 150).
Plate4.6: Gills of Oreochromis niloticus obtained from the upstream study sites, showing gill filament and lamellae(b) (Haematoxylin and Eosin, × 150).
b
Plate 4.7: Gills of Clarias gariepinus obtained from the downstream study sites, showing proliferation of intralamellar epithelial cells, which also show hyperplasia (c) (Haematoxylin and Eosin, × 150).
Plate 4.8: Gills of Oreochromis niloticus obtained from the downstream study sites, showing fusion of secondary lamellae and hyperplasia due to increased multiplication of the epithelial cells lining the secondary lamellae and primary lamellae (d) (Haematoxylin and Eosin, × 150).
c c
d
4.19 Permissible values of iron, lead and chromium in fish
The findings indicate that Clarias gariepinus had higher levels of the studied metals compared to Oreochromis niloticus. However, fish sampled from the downstream study sites accumulated higher levels of metals compared to samples obtained from the upstream study sites. The results also show that the levels of lead and chromium in the tissues of both fish species were higher compared to the permissible values in fish as indicated in table 4.12. The permissible limits set for iron by WHO (2011) and FAO, (2011) is 43 mg/kg, the levels set for lead by EU (2001) is 0.2 mg/ kg, while the level set for chromium by WHO (1985) and FEPA (2003) is 0.15 mg/ kg. Table 4.12: Comparison of levels of iron, lead and chromium in fish tissues, sediments and water in against permissible levels
Levels in mg/kg Upstream
study sites
Downstream study sites
p Permissible values (mg/kg dry weight)
References
Iron in tissues of Clarias gariepinus
2.84±0.30 3.58±0.38 0.018 43 WHO 2011and
FAO 2011 Iron in tissues of
Oreochromis niloticus
1.98±0.20 2.44±0.25 0.011 43
Lead in tissues of Clarias gariepinus
0.45±0.11 0.86±0.18 0.000 0.2 European Union,
2001 Lead in tissues of
Oreochromis niloticus
0.33±0.08 0.48±0.11 0.016 0.2
Chromium in tissues of Clarias gariepinus
0.35±0.07 0.41±0.08 0.178 0.15 FEPA 2003
Chromium in tissues of Oreochromis niloticus
0.26±0.05 0.29±0.06 0.183 0.15
Iron in sediments 0.58±0.16 0.62±0.18 0.112
Iron in water (mg/L) 0.18±0.03 0.25±0.05 0.018 20 FEPA 1999
0.2 NWQMS 2000
Lead in sediments 0.44±0.09 0.45±0.09 0.110 50 NWQMS 2000
Lead in water (mg/L) 0.12±0.03 0.22±0.05 0.059 0.1 FEPA 1999, 2006
2 NWQMS 2000
Chromium in sediments 0.25±0.06 0.36±0.07 0.002 80 NWQMS 2000
Chromium in water (mg/L) 0.14±0.04 0.28±0.07 0.044 <1 FEPA 1999