1071-412X/05/$08.00⫹0 doi:10.1128/CDLI.12.4.477–483.2005
Copyright © 2005, American Society for Microbiology. All Rights Reserved.
Simplified Fluorescent Multiplex PCR Method for Evaluation of the
T-Cell Receptor V

-Chain Repertoire
Sanjit Fernandes, Surendra Chavan, Vivek Chitnis, Nina Kohn, and Savita Pahwa*
Immunology and Inflammation Center of Excellence, North Shore—Long Island Jewish Research Institute, North Shore University Hospital—NYU School of Medicine, Manhasset, NY 11030
Received 11 March 2004/Returned for modification 20 July 2004/Accepted 19 November 2004
Rationale: evaluation of the T-cell receptor (TCR) V-chain repertoire by PCR-based CDR3 length analysis
allows fine resolution of the usage of the TCR Vrepertoire and is a sensitive tool to monitor changes in the
T-cell compartment. A multiplex PCR method employing 24 labeled upstream V primers instead of the
conventionally labeled downstream Cprimer is described. Method: RNA was isolated from purified CD4 and
CD8 T-cell subsets from umbilical cord blood and clinical samples using TRI reagent followed by reverse
transcription using a Cprimer and an Omniscript RT kit. The 24 Vprimers were multiplexed based on
compatibility and product sizes into seven reactions. cDNA was amplified using 24 Vprimers (labeled with
tetrachloro-6-cardoxyfluorescein, 6-carboxyfluorescein, and hexachloro-6-carboxyfluorescein), an unlabeled
C primer, and Taqgold polymerase. The fluorescent PCR products were resolved on an automated DNA
sequencer and analyzed using the Genotyper 2.1 software. Results: Vspectratypes of excellent resolution were
obtained with RNA amounts of 250 ng using the labeled Vprimers. The resolution was superior to that
obtained with the labeled Cprimer assay. Also the numbers of PCRs were reduced to 7 from the 12 required
in the Clabeling method, and the sample processing time was reduced by half. Conclusion: The method
described for T-cell receptor V-chain repertoire analysis eliminates tedious dilutions and results in superior
resolution with small amounts of RNA. The fast throughput makes this method suitable for automation and
offers the feasibility to perform TCR Vrepertoire analyses in clinical trials.
T cells recognize the antigen presented by antigen-present-ing cells in the context of major histocompatibility complex class I (MHC I) and II molecules through the T-cell receptors (TCR) (4). The diversity in recognition of innumerable anti-gens is dependent on the diversity in TCR (3). TCR is a heterodimeric glycoprotein consisting of an alpha and beta chain (6). Each chain is the product of a complex gene recom-bination rearrangement process that takes place during the intrathymic differentiation (16). During recombination, TCR variable (V) diversity (D) and junctional (J) region segments are coupled to a constant (C) gene domain. The immense diversity created by these random recombination events and other processes, such as random nucleotide insertion, make the V-D-J region extremely variable in nature. The variable length of the CDR3 region is a function of the non-germ line-encoded event of nucleotide insertion by TdT and is the most hypervariable region of the-chain. It is this region that has been predicted to confer fine specificity of recognition to the TCR for the peptide-MHC complexes. Analysis of the CDR3 region of the TCRchain can thus provide insights into the heterogeneity of the T-cell compartment and of immune mechanisms operative in infectious and autoimmune diseases (18).
The TCR Vrepertoire can be analyzed by different meth-ods (2), including anchor PCR (12), heteroduplex PCR analysis (20, 21), and flow cytometry (10). Anchor PCR analysis amplifies the entire gene segment of the known and unknown families of
the TCR repertoire but fails to resolve fine specificity of the CDR3 segment or the Vgene usage. In the heteroduplex assay, the amplified cDNA forms a duplex, and the output may com-promise the fine specificity of each Vfamily in comparison to that determined by the CDR3 length analysis. TCR repertoire analysis by flow cytometry utilizes monoclonal antibodies against the TCRchains and has the advantage of coupling the identifi-cation of TCR Vfamilies with phenotypic characterization of T cells. However, the method is limited by availability of monoclo-nal antibodies and its inability to determine diversity and restric-tions in TCR gene usage, as is feasible by PCR analysis.
The number of PCRs or probes needed to detect all Vgenes is a cumbersome feature of the assay, especially when multiple samples need to be analyzed. Several groups have applied the multiplex PCR method for the analysis of TCR genes (5, 7). Maslanka et al. (13) developed a system utilizing two specific T-cell receptor V-chain primers in each PCR for analysis of 23 T-cell receptor V-chain families coupled with spectratyping technology, and subsequently, a method (8, 14) that multiplexed two to three Vprimers with one primer specific for the TCR constant region was described. Another method (1) utilized a multiplex PCR system employing five PCRs combining 24 V primers. We have developed a multiplex PCR system that em-ploys seven PCRs with four to six primers in each tube for the detection of the 24 Vfamilies. In this study we demonstrate the specificity and sensitivity of this multiplex system with a relatively low cell input and illustrate the resolution of the assay in patient samples.
MATERIALS AND METHODS
Reagents.Human anti-CD4/CD8 antibody-coated magnetic beads were pur-chased from Dynal Corp, Inc. (Great Neck, NY). Molecular biology grade * Corresponding author. Mailing address: University of Miami
School of Medicine 712, Batchelor Children’s Research Institute, Uni-versity of Miami School of Medicine, 1580 N.W. 10th Avenue, Miami, FL 33136. Phone: (305) 243-7732. Fax: (305) 243-7211. E-mail: spahwa @med.miami.edu.
477
on August 17, 2020 by guest
http://cvi.asm.org/
chloroform, isopropanol, dimethyl formamide, and TRI reagent were obtained from Sigma-Aldrich (St. Louis, MO). Glycoblue and Superasin were purchased from Ambion, Inc. (Austin, TX). An Omniscript reverse transcription (RT) kit was purchased from QIAGEN (Valencia, CA). AmplTaq Gold polymerase, deoxynucleoside triphosphates (dNTPs), internal size standard 6-carboxytetra-methylrhodamine, AmpliTaq polymerase, dNTP mix, and the fluorescent dyes 6-carboxyfluorescein (FAM), which is blue, tetrachloro-6-cardoxyfluorescein (TET), which is green, and hexachloro-6-carboxyfluorescein (HEX), which is yellow, were procured from PE Applied Biosystems (Foster City, CA).
Samples.Umbilical cord blood samples were obtained under the guidelines of IRB-approved protocols from the North Shore—Long Island Jewish Research Institute University Hospital in heparinized tubes within 4 h of delivery. Heparinized venous blood was also obtained from human immunodeficiency virus-positive (HIV⫹) patients engaged in clinical protocols under informed consent and from healthy volunteers. The cord blood mononuclear cells (CBMC) and peripheral blood mononuclear cell samples were isolated by standard Ficoll-Hypaque gradient centrifugation. CD4 and CD8 T cells were separated from cord blood mononuclear cells and peripheral blood mononuclear cells by positive selection using immuno-magnetic beads coated with human anti-CD4 and anti-CD8 monoclonal antibodies (Dynal Corporation, Great Neck, NY), as previously described (2, 11, 19).
RNA extraction and cDNA synthesis.Total RNA was extracted from positively selected CD4 and CD8 T cells by a TRI reagent-chloroform extraction method (TRI reagent and molecular biology reagents, chloroform, isopropanol, and dimethyl formamide from Sigma, St. Louis, MO) according to the manufactur-er’s protocol. A total of 10l of 50g/ml of glycoblue (Ambion, Austin, TX) was added to each ml of aqueous phase, and the RNA was subsequently precipitated with an equal volume of isopropanol. The precipitated RNA was dissolved in 10
l of DEPC-treated water containing 1U/l of superasine (both from Ambion, Austin, TX). A total of 1 to 0.125g of RNA was reverse transcribed into cDNA by using an Omniscript RT kit according to the manufacturer’s protocol using an unlabeled C-Reverse primer (C-R) in a 40-l reaction mixture.
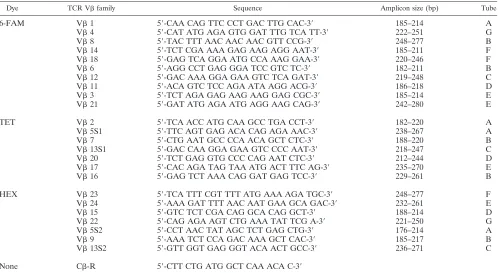
Multiplex PCR primer combination.Table 1 lists the TCR Vand the C-R primers used in this study. Locations of primers are shown in Fig. 1. Our first objective was to multiplex the Vfamilies into as few sets as possible without primer incompatibility and amplicon size differing in at least more than 10 nucleotides. Primer compatibility was analyzed using the Oligos 1998 to 2001 V.8.72 primer design freeware software available on the Internet site http:
//www.biocenter.helsinki.fi/bi/bare-1_html/ (Institute of Biotechnology, Univer-sity of Helsinki, Finland). Based on the amplicon size and primer compatibility, the Vfamilies were divided into three groups and labeled with fluorescent dyes FAM, TET, and HEX (Table 1).
Multiplex PCR by labeled Vprimer.In this new method, seven set multiplex PCRs were carried out on a PTC-225 Peltier thermal cycler (MJ Research, San Francisco, CA). Primer sequences and how they were mixed are shown in Table 1. The primer set mixtures in tubes A to F were as follows: A (V1, 2, 5.1, 5.2); B (V6, 7, 8, 9, 16); C (V12, 13.1, 13.2); D (V11, 20, 15); E (V3, 21, 17, 24); F (V14, 18, 23); G (V4, 22). Each multiplex reaction contained 1l cDNA, 1l each of TCR Vprimer set specific for 3 to 5 different Vfamilies, and 2M C-R, 1 mM dNTPs, 2 mM MgCl2, and 1U of AmpliTaq Gold DNA polymerase in a final reaction mixture of 12.5l. For the Vprimers 2, 7, 13.1, and 17, it was determined that the labeled primers had to be mixed with unla-beled primers at a ratio of 3:1 in order to prevent disproportionately high signal intensity. The PCR conditions were 94°C for 12 min for enzyme activation, followed by 35 cycles of 94°C for 20 s, 58°C for 20 s, and 72°C for 30 s, and finally one cycle of 72°C for 10 min. The titration of MgCl2and of each TCR Vprimer concentration was performed to optimize each multiplex reaction, to provide uniform amounts of amplified products.
Multiplex PCR by labeled Cprimer.In this previously described conven-tional method (2, 11, 19), 12 reaction tubes were used with two to three primers in each tube. Multiplex PCRs were carried out as before on a PTC-225 Peltier thermal cycler.
Analysis by spectratyping.The amplified PCR products were diluted 10 times with molecular biology grade water. The 2l of the diluted product was mixed with 12l of dimethyl formamide containing 0.5l of Tamara 350 as internal size standard. The mixture was denatured at 95°C for 5 min and immediately cooled in an ice water bath for 5 min and resolved and size fractionated on an ABI 310 genetic analyzer (PE Biosystems, Foster City, CA). Raw data were further analyzed using a Genotyper 2.1 apparatus (PE Biosystems, Foster City, CA).
RESULTS
The spectratype of cord blood T cells determined by
multi-plex PCR exhibits a Gaussian pattern. The spectratype of
TABLE 1. Primers used for TCR Vanalysis using labeled Vprimersa
Dye TCR Vfamily Sequence Amplicon size (bp) Tube
6-FAM V1 5⬘-CAA CAG TTC CCT GAC TTG CAC-3⬘ 185–214 A
V4 5⬘-CAT ATG AGA GTG GAT TTG TCA TT-3⬘ 222–251 G
V8 5⬘-TAC TTT AAC AAC AAC GTT CCG-3⬘ 248–277 B
V14 5⬘-TCT CGA AAA GAG AAG AGG AAT-3⬘ 185–211 F
V18 5⬘-GAG TCA GGA ATG CCA AAG GAA-3⬘ 220–246 F
V6 5⬘-AGG CCT GAG GGA TCC GTC TC-3⬘ 182–211 B
V12 5⬘-GAC AAA GGA GAA GTC TCA GAT-3⬘ 219–248 C
V11 5⬘-ACA GTC TCC AGA ATA AGG ACG-3⬘ 186–218 D
V3 5⬘-TCT AGA GAG AAG AAG GAG CGC-3⬘ 185–214 E
V21 5⬘-GAT ATG AGA ATG AGG AAG CAG-3⬘ 242–280 E
TET V2 5⬘-TCA ACC ATG CAA GCC TGA CCT-3⬘ 182–220 A
V5S1 5⬘-TTC AGT GAG ACA CAG AGA AAC-3⬘ 238–267 A
V7 5⬘-CTG AAT GCC CCA ACA GCT CTC-3⬘ 188–220 B
V13S1 5⬘-GAC CAA GGA GAA GTC CCC AAT-3⬘ 218–247 C
V20 5⬘-TCT GAG GTG CCC CAG AAT CTC-3⬘ 212–244 D
V17 5⬘-CAC AGA TAG TAA ATG ACT TTC AG-3⬘ 235–270 E
V16 5⬘-GAG TCT AAA CAG GAT GAG TCC-3⬘ 229–261 B
HEX V23 5⬘-TCA TTT CGT TTT ATG AAA AGA TGC-3⬘ 248–277 F
V24 5⬘-AAA GAT TTT AAC AAT GAA GCA GAC-3⬘ 232–261 E
V15 5⬘-GTC TCT CGA CAG GCA CAG GCT-3⬘ 188–214 D
V22 5⬘-CAG AGA AGT CTG AAA TAT TCG A-3⬘ 221–250 G
V5S2 5⬘-CCT AAC TAT AGC TCT GAG CTG-3⬘ 176–214 A
V9 5⬘-AAA TCT CCA GAC AAA GCT CAC-3⬘ 185–217 B
V13S2 5⬘-GTT GGT GAG GGT ACA ACT GCC-3⬘ 236–271 C
None C-R 5⬘-CTT CTG ATG GCT CAA ACA C-3⬘
aIn this method the Vprimers were labeled with appropriate fluorescent tags as described in the text. For multiplexing primers see Materials and Methods.
478 FERNANDES ET AL. CLIN. DIAGN. LAB. IMMUNOL.
on August 17, 2020 by guest
http://cvi.asm.org/
FIG. 1. TCR Vrepertoire in cord blood CD4 T cells, amplified by two different approaches. A, with labeled Vforward primer and unlabeled Creverse primer; B, with unlabeled Vforward primer and labeled Creverse primer. The resolution of TCR Vfamilies V14, 15, 21, and V24 is superior with labeled Vprimers.
479
on August 17, 2020 by guest
TCR Vrepertoire in cord blood CD4 T cells was performed using labeled Vforward primers and unlabeled Creverse primer (Fig. 1A) and with unlabeled Vforward primers and labeled Creverse primer, as illustrated in Fig. 1B. All the 24 known functional TCR Vfamilies could be amplified success-fully from CD4 and CD8 T cells. Each V family is repre-sented by a set of peaks, with each peak representing a set of T-cell clones bearing the same CDR3 length with different nucleotide sequences corresponding to different amino acid compositions. Within a TCR Vfamily, the difference between each successive peak is three nucleotides, i.e., one amino acid. An unperturbed polyclonal repertoire for any V family is represented by a set of peaks distributed in a Gaussian pattern, with the highest-intensity CDR3 segment lying in the center. Deviation from this Gaussian pattern or reduction in the num-ber of peaks is termed as perturbation and results either from overrepresentation, underrepresentation, or the absence of one or more CDR3 segments. Umbilical cord blood T cells have a relatively unperturbed repertoire and were used to create a standard profile against which the test sample is eval-uated. Each cord blood V profile was measured as a fre-quency histogram and translated into a relative frefre-quency
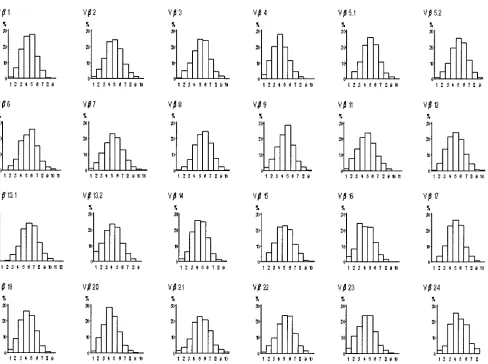
probability distribution, with a total area equal to 1, as previ-ously described (7). By averaging the frequency distributions obtained in 10 cord blood samples, a control composite profile was generated for each Vfamily (Fig. 2). Deviation from the control profile for each Vfamily in a test sample could the-oretically range from 0 (complete overlap) to 100% (complete nonoverlap) perturbation. In order to assess the variation be-tween the cord bloods themselves, percent perturbation was determined for each Vfamily in individual cord blood T cells against the composite profile.
Comparison of TCR Vrepertoire obtained using labeled
C versus labeled Vprimers. Both methods provide good
resolution of the different TCR transcripts. However, the mul-tiplex PCR method performed by the labeled V forward primer method resulted in better resolution and higher signal intensities compared to that performed using labeled C re-verse primers. The comparative analysis performed in 10 dif-ferent CD4 and CD8 T cells isolated from 10 difdif-ferent cord blood revealed that the resolution of TCR Vfamilies V14, 15, 21, and 24 improved significantly by using labeled V primers (Figs. 1A and 1B). The summary value of mean per-turbations for all Vfamilies in cord blood was determined to FIG. 2. Frequency distribution histograms of TCR Vfamilies derived from normal umbilical cord blood T cells. The frequency probability distributions (yaxis) of different CDR3 lengths (xaxis) of individual TCR Vfamilies from 10 cord blood samples were averaged to generate a control composite profile for each Vfamily, as described in the text.
480 FERNANDES ET AL. CLIN. DIAGN. LAB. IMMUNOL.
on August 17, 2020 by guest
http://cvi.asm.org/
be 8.83% with a standard deviation of 2.43 and an upper limit of 12.83% in the labeled Vprimer-7 tube method. For the 12 tube labeled C reverse primer method, the mean perturba-tion was 13.42% with a standard deviaperturba-tion of 1.48 and an upper limit of 15.86%. Importantly, the time and the reagents re-quired for multiplex PCR performed by labeled Vprimers to amplify TCR Vfamilies is approximately half of that required for the multiplex PCR performed with the labeled Creverse primer.
RNA titration to determine the sensitivity of multiplex PCR
using labeled Vprimers.The RNA input required to obtain
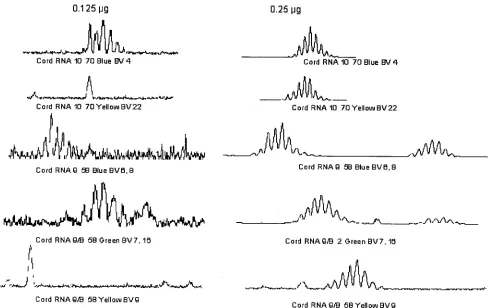
optimal resolution of the TCR Vrepertoire was determined using different concentrations of RNA ranging from 125 ng to 1,000 ng by double dilution in a 40-l RT reaction. The aver-age yield of RNA was approximately 1.0g per million cells. All TCR Vfamilies were amplified at 1,000 ng to 250 ng of starting RNA. As shown in Fig. 3, the TCR Vresolution was compromised at 125 ng RNA, resulting in a perturbed spec-tratype pattern, compared to that obtained with RNA input of 250 ng.
Analysis of TCR Vrepertoire in clinical samples.A
“con-trol” TCR V profile was developed using CD4 and CD8 T cells from normal umbilical cord blood samples to represent an unperturbed or naı¨ve T-cell repertoire as described above. For each study subject, percent perturbations within each V fam-ily were computed after summing the absolute differences be-tween each peak of the control profile and that of the study
subject’s profile. A single dominant peak constituting⬎50% of the total area of the other CDR3 segments in that particular Vfamily was designated as dominant, which was previously shown to be clonal in nature by sequence analysis (14). The 7-tube method using the labeled Vprimers has recently been used for assessing perturbations in clinical samples from HIV-infected and unHIV-infected adolescents (15). The percent pertur-bations in CD4 T cells were comparable to uninfected controls, but the incidence of clonal dominance was greater in patients CD4 T cells. In CD8 T cells, perturbations and clonal domi-nance in the infected patients was significantly greater than that of uninfected volunteers. Figure 4 is an example, showing the TCR Vprofiles of a subject with HIV infection. It can be noted that CD4 T cells showed perturbations in six TCR V families (mean perturbation, 15%), but almost all CD8 TCR Vfamilies were perturbed (mean perturbation, 29.5%) and five of them had a dominant profile.
DISCUSSION
The multiplex PCR using the labeled V forward primers described here was developed to facilitate the rapid qualitative analysis of the TCR V gene expression and to characterize alterations in the T-cell receptor repertoire. The method is very sensitive, is highly reproducible, and yields an improved resolution of the TCR Vfamilies in comparison to previously described methods. Additional advantages of this newly devel-FIG. 3. RNA titration to determine the optimal input in the multiplex PCR using labeled Vprimers: amplification of the TCR Vfamilies at 250 ng RNA input is superior to that observed at an RNA input of 125 ng.
on August 17, 2020 by guest
http://cvi.asm.org/
oped method are the feasibility of using small patient samples and the speed with which it can be performed relative to the old method.
A major requirement of TCR Vrepertoire studies is that of good quality cDNA which is reverse transcribed from RNA that is isolated from highly purified populations of CD4 and CD8 T cells and their subsets. The amount of RNA in the reaction is thus an important factor for maintaining specificity, especially when analyzing T-cell receptor repertoire from var-ious sources. Addition of an excessive amount of RNA can reduce the resolution of specific signals or generate spurious products. Excessive template is a potential cause for misprim-ing in allele-specific PCR (8). In developmisprim-ing this assay, the least amount of RNA that would yield optimal results was deter-mined by titration of different concentrations of RNA (0.125
g to 1.0g) for the RT into cDNA. RNA concentration of 0.25g was found to be sufficient for qualitative analysis of the 24 Vfamilies. This feature makes the test feasible in situa-tions where the clinical samples are limited, as in blood sam-ples from infants and young children.
Since each primer has different requirements for Mg⫹⫹and dNTPs and different affinities for the cognate target sequences, the optimal concentrations and number of reaction cycles re-quired for proper amplification will differ. Optimizing these factors individually for each multiplex set or for each primer is not realistic in a system designed to handle a large number of samples. Titration of MgCl2 (1.5 to 2 mM) revealed that 1.5
mM was best suited for the amplification in the multiplex PCR. Multiplex PCR can result in competition between different primers for templates, and thus, determination of intraprimer compatibility is necessary for achieving the best amplification efficiency of given primer pairs. Analysis of the TCR V rep-ertoire using 100% labeled Vprimers revealed that some of the primers (V2, 7, 13.1, and 17) were amplified at a signif-icantly higher level compared to the others. The high intensi-ties of these primers led them to bleed into the neighboring channels of the detector. This problem persisted even if the individual concentrations of the Vprimers were lowered, but it was overcome by adding corresponding unlabeled V
prim-ers, which competed with the labeled primers and resulted in lowering the signal intensity.
For comparison between the assays using labeled V prim-ers and the labeled C-R, we analyzed 10 cord blood samples by both methods. Cord blood provides an ideal source of an unperturbed TCR repertoire, because perturbation is a conse-quence of peripheral events (9). Moreover, it is fully diversi-fied, as the genetic mechanisms for T-cell repertoire diversifi-cation are developed in the fetus by 24 weeks of gestation (17). The overall resolution of all the 24 Vfamilies was found to be superior with the use of labeled Vprimers in comparison to labeled C-R. This change in the method to using labeled V primers also decreased the assay steps and reduced the assay time almost by half.
As shown in the example of the TCR Vrepertoire of one patient, this method of analysis provides excellent resolution of TCR Vrepertoire in clinical samples. It readily lends itself for studies requiring analysis of perturbations in sequential samples from the same patient, or between different patients, because the cord blood provides an unbiased standard that allows objective comparison of samples. Thus, the degree of perturbation in relation to the cord blood composite can be evaluated for each sample, allowing for objective analysis of clonal dominance and the change over time in each CDR3 length. This analysis can be performed in major subsets of T cells (e.g., in CD4 and CD8 T cells) as well as in functional subsets of CD4 and CD8 T cells, e.g., in naı¨ve, memory, and effector cells.
In conclusion, this method provides a tool for quantitative and qualitative assessment of the TCR Vrepertoire and can be used for few or many samples. The standardization proce-dure using the cord blood composite profile makes the results easier to interpret and to compare within and between subjects in longitudinal studies, making it feasible for analysis of TCR Vrepertoire in clinical trials.
REFERENCES
1.Akatsuka, Y., E. G. Martin, A. Madonik, A. A. Barsoukov, and J. A. Hansen.
1999. Rapid screening of T-cell receptor (TCR) variable gene usage by FIG. 4. Example of the TCR Vrepertoire in an HIV-infected patient using labeled Vprimers. The asterisks represent perturbations, and the arrows depict TCR Vfamilies exhibiting clonal dominance.
482 FERNANDES ET AL. CLIN. DIAGN. LAB. IMMUNOL.
on August 17, 2020 by guest
http://cvi.asm.org/
multiplex PCR: application for assessment of clonal composition. Tissue Antigens53:122–134.
2.Chitnis, V., and S. Pahwa.2002. Evaluation of the T cell receptor repertoire, p. 244–255.InN. R. Rose, R. G. Hamilton, and B. Detrick (ed.), Manual of clinical laboratory immunology, 6th ed. ASM Press, Washington, D.C. 3.Davis, M., and M. Muller.1997. T cell receptor biochemistry, repertoire
selection and general features of TCR and Ig structure. CIBA Found. Symp.
204:94–100.
4.Ehrich, E. W., B.Devaux, E. P. Rock, J. L. Jorgensen, M. M. Davis, and Y. H. Chien.1993. T cell receptor interaction with peptide/major histocompatibil-ity complex (MHC) and superantigen/MHC ligands is dominated by antigen. J. Exp. Med.178:713–722.
5.Fodinger, M., H. Buchmayer, I. Schwarzinger, I. Simonitsch, K. Winkler, U. Jager, R. Knobler, and C. Mannhalter.1996. Multiplex PCR for rapid detection of T-cell receptor-gamma chain gene rearrangements in patients with lymphoproliferative diseases. Br. J. Haematol.94:136–139.
6.Frank, M. M.1991. Structure/function analysis of the invariant subunits of the T cell antigen receptor. Semin. Immunol.3:299–311.
7.Gorochov, G., A. U. Neumann, A. Kereveur, C. Parizot, T. Li, C. Katlama, M. Karmochkine, G. Raguin, B. Austran, and P. Debre.1998. Perturbation of CD4⫹and CD8⫹T-cell repertoires during progression to AIDS and regu-lation of the CD4⫹repertoire during antiviral therapy. Nat. Med.4:215–221. 8.Gregersen, P. K., R. Hingorani, and J. Monteiro.1995. Oligoclonality in the CD8⫹T-cell population. Analysis using a multiplex PCR assay for CDR3 length. Ann. N. Y. Acad. Sci.756:19–27.
9.Halapi, E., M. Ehrani, A. Blucher, R. Andresson, P. Rossi, H. Wigzell, and J. Grunewald.1999. Diverse T-cell receptor CDR3 length patterns in human CD4⫹and CD8⫹T lymphocytes from newborns and adults. Scand. J. Im-munol.49:149–154.
10.Kharbanda, M., T. W. McCloskey, R. Pahwa, and S. Pahwa.2003. Alter-ations in T-cell receptor V repertoire of CD8 T lymphocytes in HIV-infected children. Clin. Diagn. Lab. Immunol.10:53–58.
11.Kharbanda, M., S. Than, V. Chitnis, M. Sun, S. Chavan, S. Bakshi, and S. Pahwa.2000. Patterns of CD8 T cell clonal dominance and response to antiretroviral therapy in HIV infected children. AIDS14:2229–2238. 12.Loh, E. Y., J. F. Elliott, S. Cwirla, L. L. Lanier, and M. M. Davis.1989.
Polymerase chain reaction with single-sided specificity: analysis of T cell receptor delta chain. Science243:217–220.
13.Maslanka, K., T. Pilatek, J. Gorski, M. Yassai, and J. Gorski.1995. Molec-ular analysis of T cell repertoires. Spectratypes generated by multiplex poly-merase chain reaction and evaluated by radioactivity or fluorescence. Hum. Immunol.44:28–34.
14.Monteiro, J., R. Hingorani, I. H. Choi, J. Silver, R. Pergolizzi, and P. K. Gregersen.1995. Oligoclonality in the human CD8⫹T cell repertoire in normal subjects and monozygotic twins: implications for studies of infectious and autoimmune diseases. Mol. Med.1:614–624.
15.Pahwa, S., V. Chitnis, R. M. Mitchell, S. Fernandez, A. Chandrasekharan, C. M. Wilson, and S. D. Douglas.2003. CD4⫹and CD8⫹T cell receptor repertoire perturbations with normal levels of T cell receptor excision circles in HIV-infected, therapy-naive adolescents. Res. Hum. Retrovir.19:487– 495.
16.Rosenberg, W. M., P. A. Moss, and J. I. Bell.1992. Variation in human T cell receptor V beta and J beta repertoire: analysis using anchor polymerase chain reaction. Eur. J. Immunol.22:541–549.
17.Schelonka, R. L., F. M. Raaphorst, D. Infante, E. Kraig, J. M. Teale, and A. J. Infante.1998. T cell receptor repertoire diversity and clonal expansion in human neonates. Pediatr. Res.43:396–402.
18.Soudeyns, H., P. Champagne, C. L. Holloway, G. U. Silvestri, N. Ringuette, J. Samson, N. Lapointe, and R. Sekaly. 2000. Transient T cell receptor beta-chain variable region-specific expansions of CD4⫹and CD8⫹T cells during the early phase of pediatric human immunodeficiency virus infection: characterization of expanded cell populations by T cell receptor phenotyp-ing. J. Infect. Dis.181:107–120.
19.Than, S., M. Kharbanda, V. Chitnis, S. Bakshi, P. K. Gregersen, and S. Pahwa.1999. Clonal dominance patterns of CD8 T cells in relation to disease progression in HIV-infected children. J. Immunol.162:3680–3686. 20.Uematsu, Y.1991. A novel and rapid cloning method for the T-cell receptor
variable region sequences. Immunogenetics34:174–178.
21.Yoshioka, T., T. Matsutani, S. Iwagami, Y. Tsuruta, T. Kaneshige, T. Toyo-saki, and R. Suzuki.1997. Quantitative analysis of the usage of human T cell receptor alpha and beta chain variable regions by reverse dot blot hybrid-ization. J. Immunol. Methods201:145–155.