Syndrome following Influenza Immunization: a Public Health Agency
of Canada/Canadian Institutes of Health Research Influenza Research
Network Study
Mona Al-Dabbagh,aKeswadee Lapphra,aDavid W. Scheifele,aScott A. Halperin,bJoanne M. Langley,bPatricia Cho,a Tobias R. Kollmann,aYan Li,cGaston De Serres,dEdgardo S. Fortuno III,aJulie A. Bettingera
Vaccine Evaluation Center, BC Children’s Hospital, University of British Columbia, Vancouver, British Columbia, Canadaa
; Canadian Center for Vaccinology, IWK Health Centre, Dalhousie University, Halifax, Nova Scotia, Canadab
; National Microbiology Laboratory, Public Health Agency of Canada, Winnipeg, Manitoba, Canadac ; Unité de Recherche en Santé Publique (CHUQ), Quebec, Quebec, Canadad
Oculorespiratory syndrome (ORS) is an infrequent adverse event following influenza vaccination. Its clinical presentation
suggests that ORS is an immune-mediated phenomenon, but studies of symptomatic individuals have been few. This study
measured cytokine levels in peripheral blood samples following influenza vaccination in those with and without current
ORS symptoms. Canadian adults receiving the 2010-2011 seasonal influenza vaccine were recruited and asked to promptly
report any adverse effects. ORS symptoms occurring 4 to 48 h after vaccination were identified using previously published
criteria. Two blood samples were collected from each subject to measure blood plasma cytokine and hemagglutination
in-hibition antibody (HAI) titers; visit 1 occurred during the acute disease phase or 4 to 72 h after vaccination for controls,
and visit 2 occurred another 21 days postimmunization. Nine ORS cases and 35 controls were enrolled. The median age of
ORS cases was 49 years, and 89% were female. Most cases had multiple symptoms, but none required medical care. HAI
titers before and after vaccination were similar for the cases and controls. Blood plasma cytokine concentrations did not
differ between the ORS cases and controls for most cytokines measured (interleukin 4 [IL-4], IL-5, IL-10, IL-13, IL-1
␣
,
IL-8, tumor necrosis factor alpha [TNF-
␣
], gamma interferon [IFN-
␥
], and IL-17A). However, ORS cases had higher levels
of IL-10 and IL-3 than the controls at visits 1 and 2, even after all symptoms had subsided. Persistent higher levels of IL-10
and IL-3 in ORS cases suggest that host factors may have predisposed these individuals to develop ORS following influenza
vaccination. Further investigations are warranted, as they might identify subjects who are at risk for ORS prior to
vaccination.
I
nfluenza infection is a major cause of morbidity and
mortal-ity worldwide, and vaccination is the cornerstone of infection
prevention. Administration of the seasonal influenza vaccine is
associated with a varied range of adverse events following
im-munization (AEFI) that include local (injection-site reaction)
and systemic manifestations. Oculorespiratory syndrome
(ORS) is an influenza vaccine-associated adverse event that was
first described in Canada during the 2000-2001 influenza
im-munization campaign (
1
). Patients usually presented within 24
h after vaccination with bilateral red eyes, facial edema, and/or
respiratory symptoms (
Table 1
). Manifestations frequently
re-solved within 48 to 72 h.
The specific cause of ORS is not understood. Studies in Canada
during the 2000-2001 season linked most ORS cases to a domestic
manufacturer’s vaccine that contained a higher-than-expected
content of unsplit and aggregated influenza virions (
2
). In
subse-quent seasons, although at a lower frequency, cases of ORS were
also associated with influenza vaccines from other manufacturers
(
3
). Although many ORS manifestations resemble allergic
reac-tions, results from affected individuals who were given skin testing
suggest that ORS is not a type-I hypersensitivity reaction (
4
).
However, an immune-based pathogenesis of ORS appears likely,
given the types and timing of symptoms (
5
).
The role of cytokine production has been investigated in a few
influenza vaccine-associated adverse events. A recent Australian
study demonstrated significantly higher levels of gamma
inter-feron (IFN-
␥
)-induced protein 10 (IP-10) and macrophage
in-flammatory protein 1 alpha (MIP-1
␣
) in children presenting with
febrile convulsions after trivalent influenza vaccine (TIV)
immu-nization than in healthy controls (
6
).
In vitro
stimulation of
pe-ripheral blood mononuclear cells (PBMCs) using the same
influ-enza vaccine as had been administered to the subjects resulted in
significantly higher levels of IFN-
␣
, IL-1

, IL-6, IL-10, IP-10, and
MIP-1
␣
than with use of other TIV vaccines, suggesting that this
pyrogenic response was related to a component of the implicated
vaccine (
6
). Skowronski et al. (
7
) conducted a study to assess the
association between
in vitro
cytokine balance (after stimulation of
PBMCs) and clinical ORS 6 months after influenza vaccination;
significantly more IFN-
␥
was produced by individuals who
re-ceived the influenza vaccine than by nonvaccinated individuals,
Received6 November 2012Returned for modification14 March 2013
Accepted13 May 2013
Published ahead of print22 May 2013
Address correspondence to Julie A. Bettinger, jbettinger@cfri.ca. Copyright © 2013, American Society for Microbiology. All Rights Reserved.
doi:10.1128/CVI.00659-12
on August 17, 2020 by guest
http://cvi.asm.org/
but the data failed to show any significant difference in IFN-
␥
levels between ORS-affected and -unaffected vaccinees.
To our knowledge, no studies have been done to assess
cyto-kine responses
in vivo
during the acute symptom phase of ORS or
other allergy-like AEFI. A preseason evaluation in Canada of the
2010/2011 TIV in adults identified a small number of cases that
met the ORS criteria. We aimed to evaluate a broad panel of
in vivo
inflammatory mediators in subjects with acute ORS symptoms
compared to unaffected individuals following vaccination. We
also aimed to evaluate hemagglutination inhibition (HAI)
anti-body responses in subjects experiencing ORS compared to
unaf-fected individuals following seasonal TIV vaccination, as titers
might differ between those with and without ORS.
MATERIALS AND METHODS
Study design.This was a prospective observational study conducted
dur-ing employee influenza immunization campaigns between October and December 2010 at two participating Canadian centers. The study was approved by the research ethics board of each center, and each participant provided informed consent.
Study population.Adults aged 20 to 65 years who experienced ORS
shortly after receiving the seasonal influenza vaccine (Fluviral, Glaxo-SmithKline, Inc.) and who were still symptomatic were enrolled as cases at one study center (Vancouver). Similarly vaccinated adults without symp-toms were enrolled as controls at two study centers (Halifax and Vancou-ver). To identify cases, participants were given an information card con-taining a list of ORS symptoms at occupational health-based influenza immunization clinics and were asked to call a study nurse by telephone if they experienced any of the listed symptoms after immunization.
Adults who reported postimmunization symptoms were eligible as cases if they experienced symptoms consistent with ORS starting 4 to 48 h after vaccination that were still present at the time of the first blood draw. Control subjects (those who were asymptomatic) were recruited from employee immunization clinics.
ORS cases were defined according to the 2001-2002 National Advisory Committee on Immunization ORS criteria (8), with the exclusion of the pres-ence of coryza, to minimize the possibility of enrolling cases with symptoms related to infection. Adults were excluded if they had received blood or any blood-derived products within the past 3 months, had an active disease of the immune system (such as transplantation, HIV infection, or congenital
im-TABLE 1Clinical manifestations of ORSa
Symptom type Specific symptoms
Ocular Bilateral red eyes (conjunctival erythema)
Respiratory Cough, sore throat, hoarseness, wheezing, chest tightness, difficulty breathing, difficulty swallowing
Facial edema Lip, tongue, or eyelid swelling
aORS cases can present with symptoms from one or more categories, and ORS
symptoms can be associated with other systemic manifestations.
TABLE 2Demographic characteristics of study participants
Characteristic Total ORS cases Controls P
n 44 9 35
Female (no. [%]) 26 (59) 8 (89) 18 (51) 0.06
Age (yr)
Mean 42.8 45.2 42.2 0.43
Median 43.5 49.0 41.0
Range 24–65 29–54 24–65
Ethnic background (no. [%])
White 39 (89) 8 (89) 31 (89) ⬎0.99
Other 5 (11) 1 (11) 4 (11)
Underlying medical conditiona(no. [%]) 24 (55) 7 (78) 17 (49) 0.15
Hypertension 3 1 2 —
Asthma 6 4 2 0.01
Allergies 7 3 4 0.14
Other 17 5 12 —
Previous ORSb(no. [%]) 2 (5)c 2 (22)c 0 —
Influenza vaccination status (no. [%])
Previous vaccination 44 (100) 9 (100) 35 (100) —
Pandemic 2009/2010 vaccine 39 (89) 8 (89) 31 (89) ⬎0.99
Seasonal vaccine last year 40 (91) 9 (100) 31 (89) 0.57
Received medication within the past 24 ha(no. [%]) 20 (48)e 6 (86)e 14(40) 0.04
NSAIDd 8 4 4 0.08
Antihistamine 5 2 3 0.53
Birth control or hormonal therapy 5 2 3 0.27
Other 8 3 5 —
aSome subjects had more than one condition. b
Previous ORS was following a past influenza vaccine. One of the cases experienced ORS twice, and one had it once previously.
cOne missing response from an ORS case (43 total valid responses, 8 among ORS cases). d
NSAID, nonsteroidal anti-inflammatory drugs.
eTwo missing responses in ORS cases (42 total valid responses, 7 among ORS cases).
on August 17, 2020 by guest
http://cvi.asm.org/
mune defects), or received immunosuppressive medications (chemothera-peutic agents for the treatment of cancer or autoimmune diseases, or systemic steroids for⬎2 weeks). Adults were also excluded if they had recovered from ORS symptoms, had any preexisting ocular or respiratory symptoms at the time of vaccination, or developed symptoms in⬍4 h after vaccination.
Study procedures.A blood sample was drawn at visit 1 to measure
inflammatory cytokines and HAI titers during the acute disease phase (for cases) or approximately 4 to 72 h postimmunization (for controls). A second blood sample was obtained 21 to 28 days postimmunization (visit 2) to measure inflammatory mediators and HAI titers. Case subjects were given memory aids during the first visit to record the perceived severity as mild (present, but does not interfere with daily activities), moderate (in-terferes with daily activities, but does not prevent them), or severe (pre-vents daily activities), date of maximum intensity, and duration of their symptoms for 7 days after vaccination. They were also asked to record any associated general symptoms (malaise, myalgia, arthralgia, fatigue, head-ache, rash, and itchiness) and to document the occurrence of any new
symptoms, including a runny nose, after the first visit. Cases were contacted by telephone 7 days after vaccination for safety debriefing and to assess the resolution of symptoms. Those with ongoing symp-toms were asked to continue documenting their sympsymp-toms, and their records were collected at the second visit. A third blood sample was drawn to measure select inflammatory cytokines 9 to 12 months after TIV immunization.
Subject characteristics, including demographic data, underlying med-ical conditions (including asthma or allergies), medication received prior to the first blood draw, previous influenza immunization history (includ-ing the pandemic influenza vaccine and/or seasonal influenza vaccine), and history of ORS were documented for all participants.
Blood sample processing.Blood samples were processed promptly to
recover plasma and serum fractions, which were stored at⫺70°C pending subsequent assays. Samples were transferred between sites on dry ice. Laboratory personnel were blinded to the case and control statuses of the participants. Paired samples were analyzed concurrently.
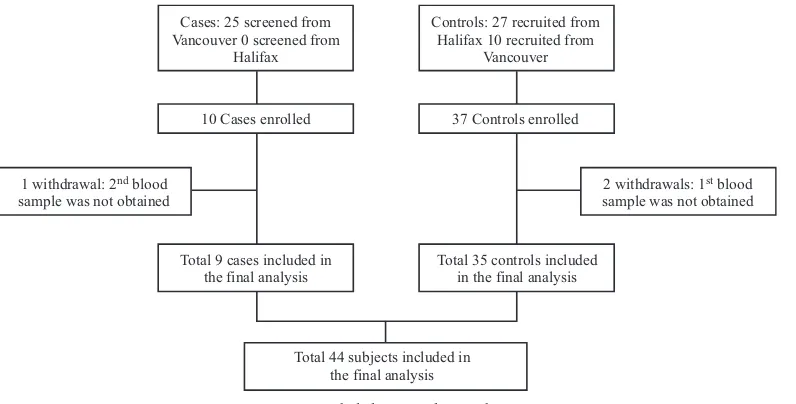
Cases: 25 screened from Vancouver 0 screened from
Halifax
Controls: 27 recruited from Halifax 10 recruited from
Vancouver
10 Cases enrolled 37 Controls enrolled
Total 9 cases included in the final analysis 1 withdrawal: 2nd blood
sample was not obtained
2 withdrawals: 1st blood sample was not obtained
Total 35 controls included in the final analysis
Total 44 subjects included in the final analysis
FIG 1Included cases and controls.
TABLE 3ORS symptoms among the ORS-affected group and their severity
ORS symptom
No. experiencing symptom (%) (totaln⫽9)
Median duration (range [days])a
No. (%) experiencing maximum severity of symptomsb
Mild Moderate Severe
Redness in both eyes 4 (44) 3 (2 to⬎21)c 3 (33) 1 (11) 0
Respiratory
Coughing 5 (56) 4 (3–6) 3 (33) 2 (22) 0
Sore throat 6 (67) 3 (2 to⬎21)c 3 (33) 3 (33) 0
Hoarseness 5 (56) 4 (3–6) 4 (44) 1 (11) 0
Wheezing 2 (22) 4.5 (3–6) 1 (11) 1 (11) 0
Chest tightness 7 (78) 4 (2–7) 5 (56) 2 (22) 0
Difficult breathing 1 (11) 4 0 1 (11) 0
Difficulty swallowing 3 (33) 8 (2–17) 0 3 (33) 0
ⱖ2 symptoms 8 (89) — — — —
Facial swelling
Lip swelling 1 (11) 2 0 1 (11) 0
Other swelling 0 — — — —
a
All cases had onset of symptoms 4 to 48 h after vaccination, as defined by the study protocol.
bMild, symptom(s) was present but did not interfere with daily activities; moderate, symptom(s) interfered with daily activities but did not prevent an individual from engaging in
them; severe, symptom(s) prevented engagement in daily activities.
cOne subject had ongoing symptoms at 21 days postvaccination; the end date of those symptoms is unknown.
on August 17, 2020 by guest
http://cvi.asm.org/
Plasma cytokines.Cytokines were measured in pg/ml using a com-mercial kit (Milliplex MAP human cytokine/chemokine, premixed 39-plex; Millipore, Billerica, MA) on the Luminex platform (Luminex, Aus-tin, TX), as described in previous studies (9). Undetectable cytokines were assigned a value of half the minimal level of detection. Samples were analyzed for 39 different plasma cytokines: epidermal growth factor (EGF), eotaxin, basic fibroblast growth factor (FGF-2), FMS-like tyrosine kinase-3 (Flt-3) ligand, fractalkine, granulocyte colony-stimulating factor (G-CSF), granulocyte macrophage colony-stimulating factor (GM-CSF), growth regulated oncogene (GRO), IFN-␣2, IFN-␥, IL-10, IL-12 (p40), IL-12 (p70), IL-13, IL-15, IL-17, IL-1R␣, IL-1␣, IL-1, IL-2, IL-3, IL-4, IL-5, IL-6, IL-7, IL-8, IL-9, IP-10, monocyte chemoattractant protein-1 (MCP-1), MCP-3, macrophage-derived chemokine (MDC) (CCL22), MIP-1␣, MIP-1, transforming growth factor-alpha (TGF-␣), TNF-␣, TNF-, vascular endothelial growth factor (VEGF), soluble CD40 ligand (sCD40L), and soluble IL-2 receptor alpha (sIL-2R␣).
Hemagglutination inhibition test (HAI).Serum samples were tested
for the presence of HAI antibodies against the homologous antigens of the 3 influenza strains in the 2010/2011 vaccine (A/California/07/09 [H1N1], A/Perth/16/09 [H3N2], and B/Brisbane/60/08) with chicken red blood cells, following standard procedures (10). Seroprotection was defined as an HAI titer ofⱖ40.
Statistical analysis.Descriptive statistics were used to report the
base-line characteristics of the participants. Continuous variables were com-pared using a two-sample Student’sttest, and categorical variables were compared using the chi-square or Fisher’s exact test.
The primary outcome of the study was the difference in mean individ-ual blood plasma cytokine concentrations between ORS cases and con-trols at visit 1. To assess the normalization of cytokine concentrations, mean differences between acute and convalescent values (visit 1⫺visit 2) were calculated. Logarithmic transformations were used prior to analysis to ensure the assumptions of normality, and comparison was done using a two-samplettest. Calculations included the 95% confidence interval. For the primary outcome, significance was determined using a Bonferroni correction for the adjustment of multiple comparisons; an alpha of 0.0013 was selected as the corrected level of statistical significance.
The secondary outcome was the mean difference in HAI titers between visit 1 and visit 2 for cases and controls. Logarithmic transformation to geometric mean titers (GMT) was done to meet a normality assumption, and the two-samplettest was used. Seroconversion rates, final HAI titers, and GMTs in cases and controls were compared among H1N1, H3N2, and B strains, including the calculation of the 95% confidence intervals. Data analysis was done using SAS 9.2 software (Cary, NC).
RESULTS
Description of study sample.
Nine ORS cases and 35 controls were
enrolled (
Fig. 1
), and all attended the follow-up visit between days 21
and 28 postvaccination. All cases came from one center (Vancouver),
where the study information was provided to 3,172 immunized
indi-viduals. The mean time from vaccination to the first blood draw was
similar in cases and controls (49.4 h versus 48.3 h, respectively;
P
⫽
0.89). Baseline characteristics were similar between cases and controls
in all clinical categories (
Table 2
). Two of the ORS cases reported a
history of ORS following previous influenza immunizations.
Description of AEFI symptoms.
Among the nine ORS cases,
the most commonly reported symptom was chest tightness,
fol-lowed by sore throat, hoarseness, and cough (
Table 3
). ORS
symp-toms ranged from mild to moderate in severity and were generally
well tolerated. One case who rated her symptoms as moderate
reported staying at home for 4 days due to symptoms. This case
was the only one with ORS symptoms persisting for
⬎
21 days and
she had experienced ORS twice previously after TIV vaccination.
None of the ORS cases sought medical advice or required
hospi-talization.
Seven of the ORS cases (78%) had systemic symptoms
follow-ing vaccination, with fatigue (67%), headache (56%), and
myal-gia/malaise (44%) reported most commonly. Most of these cases
rated their symptoms as mild or moderate, with only four
report-ing severe symptoms (two with headache, one with malaise, and
one with itchiness).
Description of study outcomes. (i) Cytokine levels.
At visit 1,
we found that the mean production level of IL-10 in ORS-affected
0.4
0.2
1.0
2.0
4.0
Cytokine Level (pg/ml)
Visit 1
IL-3
Control ORS Control ORS
Visit 2
10.0
40.0
100.0
Cytokine Level (pg/ml)
Visit 1
IL-10
Control ORS Control ORS
Visit 2
0.4
0.2
1.0
2.0
4.0
10.0
40.0
100.0
A
B
FIG 2IL-10 and IL-3 levels at visits 1 and 2 for ORS cases and controls. (A and
B) Mean and median plasma levels (pg/ml) (means and 95% confidence in-tervals are shown with closed circles and vertical lines, respectively, and medi-ans and quartiles are shown with horizontal lines and boxes, respectively). Open circles represent outliers, which are values more than 1.5 times higher than 75% of the values.
on August 17, 2020 by guest
http://cvi.asm.org/
cases was higher than that in controls, 33.6 pg/ml (95% confidence
interval [CI], 22.4 to 50.5) versus 4.9 pg/ml (2.5 to 9.5),
respec-tively (
P
⬍
0.0001), as was the mean IL-3 concentration: 26.8
pg/ml (95% CI, 16.3 to 44.1) versus 6.0 pg/ml (3.41 to 10.7) (
P
⫽
0.0002) (
Fig. 2
). We found a slightly higher concentration of
MCP-1 (
P
⫽
0.0049) in cases than in controls during acute
dis-ease, although the difference fell short of statistical significance.
None of the other 36 cytokine concentration levels evaluated were
found to be elevated in cases compared with controls. Of note, the
concentrations of IL-10, IL-3, and MCP-1 remained elevated in
cases (
P
⬍
0.0001,
P
⫽
0.0002, and
P
⫽
0.001, respectively) 21 to
28 days after vaccination. Seven ORS cases had an additional
blood draw 9 to 12 months after vaccination to measure IL-10 and
IL-3 concentrations; no change in the mean cytokine levels was
evident (data not shown).
To determine if certain cytokine concentrations were acutely
elevated following vaccination in both cases and controls, the
mean difference in measured values between the first and second
samples was computed for all 39 measured cytokines. No
signifi-cant change (including decline) in values was evident with any
cytokine (data not shown).
(ii) Hemagglutination inhibition (HAI) antibody response.
Seroprotection rates were similar in cases and controls for all three
strains contained in the influenza vaccine. In general, the baseline
seroprotection rate was higher for the B strain than the A strain in
both cases and controls. The postimmunization seroprotection
rates were highest for the B strains (100% and 100%), followed by
H1N1 (100% and 88%) and H3N2 (67% and 57%) in cases and
controls, respectively, but the differences between the groups were
not significant. The fold increase in GMTs was not significantly
different between ORS cases and controls for the H1N1, H3N2, or
B influenza strains (
Fig. 3
).
DISCUSSION
The mechanism for developing ORS post-influenza
immuniza-tion is not well understood. Our results indicate that ORS cases
had greater concentrations of particular cytokines (IL-10 and
IL-3) than did controls. No elevations were evident between cases
or controls for the IL-4, IL-5, IL-13, IL-1
␣
, IL-8, TNF-
␣
, IFN-
␥
, or
IL-17A cytokines. However, the cytokines that were elevated in
symptomatic ORS cases were still high 21 to 28 days and 9 to 12
months later. This suggests that the symptoms of ORS in affected
subjects were not due to a sudden increased production of
inflam-matory cytokines in response to influenza vaccination. Instead,
elevated concentrations of these cytokines may represent a
bio-marker for susceptibility to ORS without necessarily playing a
direct role in its pathogenesis.
We also found that there was no difference in the mean
anti-body response from baseline to 21 to 28 days after immunization
in ORS cases compared to controls for any of the three influenza
5
10
25
50
100
Visit 1
Geometric Mean and Median T
iters (Log Scale)
A/California/07/09 (H1N1)
Control ORS Control ORS
Visit 2
250
500
2500
Visit 1
A/Perth/16/09 (H3N2)
Control ORS Control ORS
Visit 2
5
10
25
50
100
Geometric Mean and Median T
iters (Log Scale)
250
500
2500
Visit 1
B/Brisbane/60/08
Control ORS Control ORS
Visit 2
5
10
25
50
100
Geometric Mean and Median T
iters (Log Scale)
250
500
2500
A
B
C
FIG 3Hemagglutination inhibition (HAI) antibody response in ORS cases
and controls. Means and 95% confidence intervals are shown with closed circles and vertical lines, respectively, and medians and quartiles are shown with horizontal lines and boxes, respectively. Open circles represent outliers, which are values more than 1.5 times higher than 75% of the values. (A) Mean and median HAI titers for the A/California H1N1 strain; (B) mean and median HAI titers for the A/Perth H3N2 strain; (C) mean and median HAI titers for the B/Brisbane strain.
on August 17, 2020 by guest
http://cvi.asm.org/
strains contained in the vaccine; this indicates that ORS does not
result in higher antibody responses. The increase in cytokines may
be related to genetically determined differences in the baseline
production of these two cytokines.
The mechanism by which IL-10 and IL-3 might be associated
with the development of ORS is not clear. IL-3 has been described
to play an important role in inducing chronic inflammation by
supporting cell-mediated immune responses, and it is also
in-volved in eosinophil activation, B-cell differentiation, and control
of IgE synthesis (
11
). In contrast, IL-10 is a potent
anti-inflamma-tory cytokine with several important immunoregulaanti-inflamma-tory
func-tions (
12
). It has the capability of inhibiting proinflammatory
cytokines, such as TNF-
␣
, IL-1, and IL-6. IL-10 also has an
anti-inflammatory effect on eosinophils, basophils, and mast cells, and
thus, it plays a major role in the control and regulation of allergy
and asthma (
12
,
13
). It is thus difficult to implicate these cytokines
in specific cause-and-effect relationships with ORS.
An association between host genetic factors and the
develop-ment of AEFI has been hypothesized (
14–16
). Stanley et al. (
19
)
demonstrated that certain haplotypes in the IL-1 gene complex
and in the IL-18 gene were associated with the development of
fever after smallpox vaccination, whereas a haplotype in the IL-4
gene was associated with a significant reduction in susceptibility to
such an event. In addition, Vestergaard et al. (
15
) found that at 15
to 17 months of age, the risk difference of febrile seizures within 2
weeks following measles, mumps, and rubella (MMR) vaccination
was 3.97 per 1,000 (95% CI, 2.90 to 5.40) for siblings of children
with a history of febrile seizures compared to siblings of children
with no history of febrile seizure, strongly suggesting an
underly-ing genetic predisposition. Finally, the Finnish data, which found
the occurrence of narcolepsy following immunization with a
pan-demic influenza vaccine to be increased among individuals with a
particular genetic factor (human leukocyte antigen DQB1*0602
allele), support a potential genetic basis for this rare adverse event
(
17
).
Our study was exploratory, and its major limitation is its
small sample size. Our numbers in this pilot study were
insuf-ficient to detect all but the greatest differences between cases
and controls for most cytokines. The reliance on self-reporting
of ORS symptoms is another limitation of our study. This
lim-ited our ability to identify all ORS cases that occurred during
the campaign season. It is unclear to us why no ORS cases were
documented in Halifax, as the same vaccine was used in both
provinces; this may be due to an actual difference in the
inci-dence of ORS between Nova Scotia and British Columbia and
deserves further investigation. Finally, although our
propor-tion of females to males was not significantly unbalanced
among cases and controls, female predominance in ORS cases
has been documented in all previous reports (
1–3
,
8
,
16
,
18
),
and the effect of gender should be examined in future studies.
This study demonstrates that in adults with ORS, a
persis-tent elevation in blood plasma levels of specific cytokines
(IL-10 and IL-3) compared to vaccine recipients without ORS
can be detected. The persistent nature of the elevation suggests
that underlying host factors may predispose certain individuals
to develop ORS following influenza vaccination. Given the
ex-ploratory nature of our data, further investigation of these
phe-nomena in a study with a larger sample size may be warranted.
ACKNOWLEDGMENTS
The Public Health Agency of Canada and the Canadian Institutes of Health Research provided the funding for this study. The funders had no role in study design, data collection and analysis, decision to publish, or preparation of the manuscript. T.R.K. is supported in part by a Burroughs Wellcome Career Award in the biomedical sciences. T.R.K and J.A.B. are supported by Michael Smith Foundation for Health Research Career In-vestigator Awards.
The Canadian Association for Immunization Research and Evaluations (CAIRE) provided networking assistance for this study. We gratefully ac-knowledge the expert assistance provided by the Vaccine Evaluation Center (Carol LaJeunesse, Arlene Kallos, Kim Marty, and Shu Yu Fan), the Canadian Center for Vaccinology, and the National Microbiology Laboratory. We also acknowledge the laboratory personnel and technicians at BC Children’s Hos-pital, the Wadsworth Center, and the National Microbiology Laboratory, as well as all participants in the study. Mona Al-Dabbagh, Keswadee Lapphra, and Patricia Cho were PCIRN trainees.
M.A.-D., J.A.B., T.R.K., P.C., K.L., E.S.F., and Y.L. disclose no conflicts of interest. D.W.S., S.A.H., and J.M.L. disclose that they have received funding from GlaxoSmithKline, Sanofi Pasteur, and Novartis Vaccines for performance of other influenza-related clinical trials and have served onad hocadvisory boards for these companies. G.D.S. has received fund-ing from GSK and Sanofi Pasteur for clinical trials not related to influenza and reimbursement for travel expenses to attend a GSK advisory board meeting.
REFERENCES
1.Skowronski DM, Strauss B, De Serres G, MacDonald D, Marion SA,
Naus M, Patrick DM, Kendall P.2003. Oculo-respiratory syndrome: a
new influenza vaccine-associated adverse event? Clin. Infect. Dis.36:705– 713.
2.Public Health Agency of Canada.2001. An Advisory Committee
State-ment (ACS). National Advisory Committee on Immunization (NACI). Statement on influenza vaccination for the 2001-2002 season. Can. Com-mun. Dis. Rep.27:1–24.
3.De Serres G, Boulianne N, Duval B, Rochette L, Grenier JL, Roussel R,
Donaldson D, Tremblay M, Toth E, Ménard S, Landry M, Robert Y. 2003. Oculo-respiratory syndrome following influenza vaccination: evi-dence for occurrence with more than one influenza vaccine. Vaccine21: 2346 –2353.
4.Skowronski DM, De Serres G, Hebert J, Stark D, Warrington R,
Macnabb J, Shadmani R, Rochette L, MacDonald D, Patrick DM, Duval B.2002. Skin testing to evaluate oculo-respiratory syndrome (ORS) asso-ciated with influenza vaccination during the 2000-2001 season. Vaccine 20:2713–2719.
5.Spellberg B, Edwards JE, Jr.2001. Type 1/type 2 immunity in infectious
diseases. Clin. Infect. Dis.32:76 –102.
6.Blyth CC, Currie AJ, Wiertsema SP, Conway N, Kirkham LA, Fuery A,
Mascaro F, Geelhoed GC, Richmond PC. 2011. Trivalent influenza
vaccine and febrile adverse events in Australia, 2010: clinical features and potential mechanisms. Vaccine29:5107–5113.
7.Skowronski DM, Lu H, Warrington R, Hegele RG, De Serres G,
Hay-Glass K, Stark D, White R, Macnabb J, Li Y, Manson HE, Brunham RC. 2003. Does antigen-specific cytokine response correlate with the experi-ence of oculorespiratory syndrome after influenza vaccine? J. Infect. Dis. 187:495– 499.
8.Public Health Agency of Canada.2001. An Advisory Committee
State-ment (ACS). National Advisory Committee on Immunization (NACI). Supplementary statement for the 2001-2002 season: influenza vaccination of persons who experienced oculo-respiratory syndrome following previ-ous influenza vaccination. Can. Commun. Dis. Rep.27:1–7.
9.Kollmann TR, Crabtree J, Rein-Weston A, Blimkie D, Thommai F,
Wang XY, Lavoie PM, Furlong J, Fortuno ES, III, Hajjar AM, Hawkins
NR, Self SG, Wilson CB.2009. Neonatal innate TLR-mediated responses
are distinct from those of adults. J. Immunol.183:7150 –7160.
10. Kendal AP, Pereira MS, Skehel J.1982. Concepts and procedures for
laboratory-based influenza surveillance. World Health Organization, Ge-neva, Switzerland.
on August 17, 2020 by guest
http://cvi.asm.org/
11. Feghali CA, Wright TM.1997. Cytokines in acute and chronic inflam-mation. Front. Biosci.2:d12– d26.
12. Donnelly RP, Dickensheets H, Finbloom DS.1999. The interleukin-10
signal transduction pathway and regulation of gene expression in mono-nuclear phagocytes. J. Interferon Cytokine Res.19:563–573.
13. Chung F.2001. Anti-inflammatory cytokines in asthma and allergy:
in-terleukin-10, interleukin-12, interferon-gamma. Mediators Inflamm.10: 51–59.
14. Poland GA, Ovsyannikova IG, Jacobson RM.2008. Personalized
vac-cines: the emerging field of vaccinomics. Expert Opin. Biol. Ther.8:1659 – 1667.
15. Vestergaard M, Hviid A, Madsen KM, Wohlfahrt J, Thorsen P,
Schen-del D, Melbye M, Olsen J.2004. MMR vaccination and febrile seizures:
evaluation of susceptible subgroups and long-term prognosis. JAMA292: 351–357.
16. De Serres G, Toth E, Ménard S, Grenier JL, Roussel R, Tremblay M,
Landry M, Robert Y, Rochette L, Skowronski DM. 2005.
Oculo-respiratory syndrome after influenza vaccination: trends over four influ-enza seasons. Vaccine23:3726 –3732.
17. National Institute for Health and Welfare.2011. National Narcolepsy
Task Force Interim Report. National Institute for Health and Welfare (THL), Helsinki, Finland.http://www.thl.fi/thl-client/pdfs/dce182fb-651
e-48a1-b018-3f774d6d1875.
18. Ahmadipour N, Tam T, Walop W, King A, Pless R. 2005.
Oculo-respiratory syndrome following influenza vaccination: review of post-marketing surveillance through four influenza seasons in Canada. Can. Commun. Dis. Rep.31:217–225.
19. Stanley SL, Jr, Frey SE, Taillon-Miller P, Guo J, Miller RD, Koboldt DC,
Elashoff M, Christensen R, Saccone NL, Belshe RB.2007. The
immu-nogenetics of smallpox vaccination. J. Infect. Dis.196:212–219.