ISSN 2286-4822 www.euacademic.org
Impact Factor: 3.1 (UIF) DRJI Value: 5.9 (B+)
Credit Risk Analysis for SME Bank Financing –
Albanian Case
EVIS KUMI
Faculty of Economics Tirana University, Tirana Albania
Abstract:
Due to bankruptcy risk especially for SMEs, we developed a credit risk model by using logistic regression methods. The studies based on SME data are rare and this study might be a help in the measurement of credit risk for SMEs in an emerging market such as Albanian one. This is because the SMEs play important role in our economy and almost in all the economies in the world.
During 2013, the quality of the loan portfolio continued its downward progress, where the non performing loans to total gross loans rose to 22.5 %, while the latest rapports show more increased level of NPLs up to nearly 25% in the end of the year. Credit quality is deteriorated for both businesses and individuals so as to loans in local currency and foreign currency ones. In the context of facing potential losses from this risk we are trying to build a model to predict the possibility for a SME to have financial distress during the period of loan repayment.
The SPSS program is used to analyze the selected variables for the logistic model, which had a predictive accuracy level of 66.3% for our sample. It is necessary to note that the independent variables used consisted in financial and non financial data. Financial institutions can also benefit from developing their own models by following the process as shown in this study.
JEL Classification: C350, G320, G210
1. Introduction
Both in developing countries and developed ones, small and medium sized firms (SMEs) play an important role in the process of industrialization and economic growth. SMEs are the predominant type of business in all the European economies and contribute for 2/3 of all employment. In Albania, as in most countries, SMEs already make major economic and social contributions. They provide goods and services that are essential for modern living, employment, and tax revenues. They also stimulate innovation and encourage competition. As a result, a growing number of banks are giving more attention to SMEs and taking special steps to serve this important market well and profitably, to avoid mistakes in credit application files. This study aims to evident the importance of SME sector to Albanian economy, explaining the definition of SMEs according to Albanian law. Subsequently, we describe the banking developments and SME financing in our market. The banking sector today suffers from the high level of nonperforming loans, and this raises the problem of the efficiency of the financial and non financial analyze of the loan applications, that are brought to the bank from the SME clients.
and propose future research lines.
2. SME sector development in Albania
In Albania, until recently, there was no clear definition on the SMEs. Before '90, unlike many countries in Central and Eastern Europe which had a stable activity of the private sector, in Albania there was no sign of this sector, because it was prohibited by law. Private sector development in Albania occurred with the collapse of the centralized economy system and opening the doors to a market economy. In this period, small and medium enterprises had an outstanding growth, which played a crucial role in the economic development of the country during the last twenty years.
Since SMEs are the bulk of the private sector in Albania, it is reasonable to be provided a multidimensional attention. The total number of private companies operating in 2012 was 80,722, which increased 2.9 percent compared to 2011. The enterprises that operate in trade sector comprise 46.8 percent of the whole economic activity, while enterprises with 1-4 employees are those which prevail with 91 percent.
The trade sector (including trade of vehicles, wholesale and retail trade) has contributed with 48.9 percent in the realization of total turnover of all enterprises together. This sector engaged 27.6 percent of the total number of employed. In trade sector investments are only 16 percent of the total value of investments made in all economic activities.
3. Banking system developments and SME financing
is dominated from five banks, which together represent 67.8% of the loan portfolio and 74.4% of the deposits of the whole system.
The banking sector remains a key segment of financial intermediation in Albania. Its assets represent 87.9% of GDP in the beginning of 2013. During the same year, the financing of the economy with bank loans has been low and focused on specific market segments. Its annual growth is slowed significantly and stands at the end of the year to 2.4%. The credit granted to the economy at the end of the year reached the level of 42.7% of the GDP.
During 2013, banks slightly tightened lending standards for businesses and individuals. We can compare the growth of lending standards in Albania during the same period, with that of the Euro area. Credit standards for euro-zone countries, which usually precede the development of those in our country, are tight for both businesses and individuals during this period. Tightening standards for businesses and unwillingness to ease standards for the individuals is influenced by several factors. For businesses, the main factors were the specific problems of the sector, the macroeconomic situation and condition of nonperforming loans. The determining factors that caused the decline in loan demand from the individuals were: financial condition of the consumers, financial performance of the real estate market, low confidence in the economy and the use of alternative sources.
The loan portfolio represents 29.8 % of banking system assets. It is dominated with 66.6 % of its loans to businesses. Banks grant to SMEs is 61 % of the loans provided to businesses. Crediting in Tirana and Durres district constitutes 75 % of total loans, while the rest is distributed as follows: 5 % for districts in the north of the country, 6% for districts in central Albania and 16 % for districts in south.
3.1The situation of nonperforming loans.
conditions economic developments contains in itself a certain level of risk, especially in terms of the economic uncertainty. The quality of the loan portfolio continued its downward progress, where the non performing loans to total gross loans rose to 22.5 % at the end of 2012, versus 18.8 % a year ago, while the latest rapports show more increased level of NPLs up to nearly 25% in the end of 2013. Credit quality is deteriorated for both businesses and individuals so as to loans in local currency and foreign currency ones. In the context of facing potential losses from this risk, the banking sector has created reserve funds (provisioning), which in 2013 increased by about 17 billion or about 30.89 % compared to the previous year.
4. The models of credit risk measurement
The financial crisis and the Basel II agreement about the regulatory capital highlighted the need for lending institutions to make appropriate adjustments in risk management models for the corporate and SMEs, to have a granted quality of their loan portfolios. Relying on the provisions of Basel II, banks consider a company in financial difficulties if it delays in payment of the loan over 90 days. In relation to risk management models for large companies listed on the stock exchange, the literature is very broad, but focuses primarily on two main theories: Z Score model, which is based on accounting data to predict failure, (Altman 1968); Models based on the information on capital markets (Merton 1974).
and methodologies designed especially for them (Altman and Sabato 2007). Many studies are accomplished in the field of finance for the SME’s sector, as the sector is seen very important and critical to economic growth, but in terms of lending, scientific research are scarce. The best way to improve SME financing is improving the quality of information and to develop appropriate risk models for the sector.
Later research on the probability of corporate bankruptcy, involves the application of time hazard models, instead of static models. Shumaway (2001) argues that the issue of static models combined with data models that include many periods, leads us to conclusions and estimates which are biased, inconsistent, and inefficient, therefore he proposed to use time hazard models. Later innovations in risk modeling include combination of market information and accounting (Hillegeist 2004).
5. The definition of SMEs in Albania
The definition of SMEs is described in Article IV of the Law no. 8957, dated 17-10-2002 "For Small and Medium Enterprises". The definition embodies only small staff criteria - and states that entities that employ less than 5 people will be classified as micro enterprises. Definition of small and micro enterprises, except the staff number criteria, added also financial indicators, such as balance, turnover, and ownership.
Small enterprises are those entities that employ 6-20 people, and have an annual turnover not exceeding 40 million Lek. The capital must be owned by entities which are classified on the basis of this law as small enterprises.
Medium enterprises are entities that employ 21-80 persons, entities with annual turnover not exceeding 80 million Lek and at least 25 % of the equity of the firm does not belong to an enterprise that is not small and medium enterprises.
6. The data sample and methodology:
57 cases are classified as successful and 62 are classified as successful cases.
From a financial standpoint, a general definition of a failure to SMEs, will be considered a lack of liquidity, bankruptcy, and liquidation of the company. Karels and Prakash (1987) used the company's net worth as an index for the failure, and Lau (1987) used as an indicator of failure, the fall in the share price , or non-payment of dividends, failure to pay the loan, applying for bankruptcy, lack liquidity. Ongoing Neaver (1996) used the lack of liquidity and failure in the payment of the loan installments. In this study, SMEs are considered as firms involved in one of these situations: delay in payment of the bank loan installments for over 90 days, a bad credit history from the Registry of Credit Bank of Albania, as well as a debt to total assets ratio less than 50%. In order to increase the reliability of financial information it is consulted also the expert opinion on the balance sheets for the given companies.
According to previous literature of the abovementioned authors, we have taken into account the 12 financial ratios that belong to profitability, activity, liquidity and structure ratios. In addition to information from financial reports, 3 non-financial data are added to the model: age of the business, the sector and the geographical area where the company is operating.
6.1Statistical model, Logistic Regression Analysis
Charitou and Trigeorgis 2002; Becchetti and Sierra 2002; Altman and Sabato 2007; Altman, Sabato, and Wilson 2008)
Successful companies
No. Type Financial Ratio Mean St. dev.
1 Structure s1= Capital/Total Assets
0.66
0.19 2 Structure s2= Total liabilities/Total Assets
0.33
0.17 3 Structure
s3= Operative income/Total liabilities
5.27
21.73 4 Profitability
r1= Operative income/Total assets
0.47
0.47 5 Profitability r2= Net income/Total Assets
0.22
0.17 6 Profitability r4= Net income/Sales
0.19
0.11 7 Profitability
r5= Net working capital/Total assets
0.40
0.22 8 Liquidity
l1= Current assets/Current liabilities
7.47
14.03 9 Liquidity
l2=(Current assets-Inventories)/Current liabilities 3.61 7.04 10 Activity a1= Sales/Fixes assets
8.18
10.77 11 Activity a2= Sales/Total Assets
1.21
0.73 12 Activity a4= Sales/Receivables
30.24 98.86 Unsuccessful companies
No. Type Financial Ratio Mean St. dev.
1 Structure s1= Capital/Total Assets
0.28
0.20 2 Structure s2= Total liabilities/Total Assets
0.72
0.20 3 Structure
s3= Operative income/Total liabilities
0.45
0.92 4 Profitability
r1= Operative income/Total assets
0.20
0.11 5 Profitability r2= Net income/Total Assets
0.08
0.06 6 Profitability r4= Net income/Sales
0.12
assets 0.24 0.24 8 Liquidity
l1= Current assets/Current liabilities
2.44
2.07 9 Liquidity
l2=(Current
assets-Inventories)/Current liabilities
1.56
1.88 10 Activity a1= Sales/Fixes assets
4.07
4.42 11 Activity a2= Sales/Total Assets
0.73
0.40 12 Activity a4= Sales/Receivables
3.49
3.73 Table1. Descriptive statistics for the data sample.
The selection of the financial ratios that would be tested for their performance prediction capacity was done considering the recommendations of the literature, as well as the limitations of the data available. In our model, the data are analyzed with SPSS and we have input:
Z represents the zone of operation; it takes value 1, if the zone of activity is in capital Tirana and Durresi Area, and it takes value 0 if it is the contrary.
V represents the age of the company; it takes value 0 if the age is less than three years, and it takes value 1 if the age is more than that.
A4 is an activity financial ratio, Sales/Receivables
STR3 is a structure financial ratio, Operative income/Total liabilities
REN2 is a rentability financial ratio, Net income/Total Assets
LOGISTIC REGRESSION VARIABLES S /METHOD = ENTER Z V A4 STR3 REN2 /PRINT = GOODFIT
/CRITERIA = PIN(.05) POUT(.10) ITERATE(20) CUT(.5) .
based on the construction of hypotheses.
H0 – There are at least some assessment capacity Ha - There are no assessment capacity
Chi-square df Sig. Step 1 Step 81.169 5 .000 Block 81.169 5 .000 Model 81.169 5 .000 Table2: Omnibus Tests of Model Coefficients
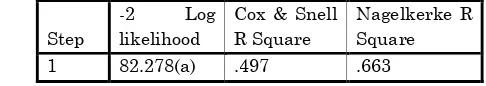
The table shows that the p-values are very small, so that the null hypothesis is true and that the model has evaluation capacity that are statistically significant. In the table below we have a summary of the results of our model. This table gives an overall capacity assessment model that we have built. In the first column we have the value logarithm -2 (log likelihood) which is used for other tests. The definition of opportunities logarithm is expressed for both categories of dependent variables and has the following form:
1
log [ ln( ) (1 ) ln(1 )]
N i i i ii
m Y Y Y Y
This estimation has a chi-square distribution which is expressed as:
X2=2[(log - for greater values)-(log - for smaller values)]
This value can be compared with a critical value of chi-square. We also have two values of R2, the Cox & Snell and Nagelkerke. These values are similar to the value of R2 that we have been using for other models that are more regressive and they do not have the same meaning. However, these values may have a similar use in the case of the R2 general. Unlike the case of OLSs where we ask for the minimum amount of squares of errors, in logistic models we care to maximize the possibilities of occurrence of a category.
opportunities ratio reflects all model upgrades versus partial model. The smaller this ratio, the greater is this improvement. R2 in this case can be expressed as:
2 2 ) ) N pjesshëm CS Plot LogM R LogM where:
L (M) is the conditional probability of dependent variables issued by the independent variables.
The problem with this indicator is that it amounts to 1 as would prefer to interpret the meaning of this indicator, therefore, a form of his adjusted Nagelkerke's R2 which can be expressed as:
2
2
2
1
1 ( )
N pjesshëm Plot N N pjesshëm LogM LogM R LogM
This coefficient is an adjusted form of the Cox & Snell R2 which can take values from 0 to 1 allowing us a more accurate approximation of the indicator with R2 to use in general.
Nagelkerke R2 should be used in most logistic models to indicate the quality of the model. In our model Nagelkerke R2 which serves to see explanatory ability of model, takes a value of 66.3%. So our model explanatory capacity is at these levels.
Step
-2 Log likelihood
Cox & Snell R Square
Nagelkerke R Square 1 82.278(a) .497 .663 Table 3: Model Summary
a Estimation terminated at iteration number 9 because parameter estimates changed by less than .001.
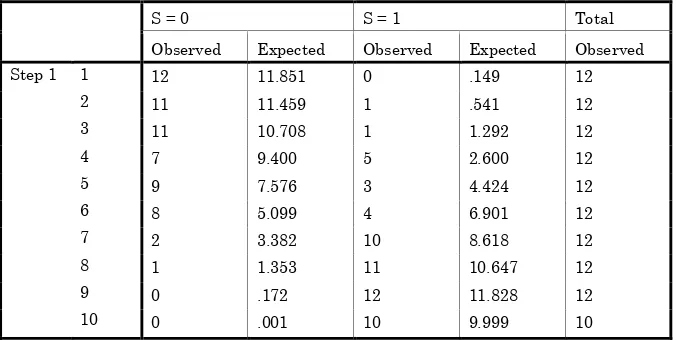
purpose Hosmer and Lemeshow in 1989 proposed a new way of testing which has a chi-square distribution and is valid only for the case of variables with only two categories. Hosmer-Lemeshow test used to check the quality of the model. It is a version of the modified chi-square test. In this case we expect that the p-value is greater than 0.05 in order to confirm that our model is good.
Step Chi-square df Sig.
1 8.122 8 .422
Table 4: Hosmer and Lemeshow Test
In the case of our model shows that it has a value of 0.422> 0.05, leading us to understand that our model is good. To evaluate this test we study the values into 10 major groups in ascending order, as shown in the table below.
S = 0 S = 1 Total
Observed Expected Observed Expected Observed
Step 1 1 12 11.851 0 .149 12
2 11 11.459 1 .541 12
3 11 10.708 1 1.292 12
4 7 9.400 5 2.600 12
5 9 7.576 3 4.424 12
6 8 5.099 4 6.901 12
7 2 3.382 10 8.618 12
8 1 1.353 11 10.647 12
9 0 .172 12 11.828 12
10 0 .001 10 9.999 10
Table 5: Contingency Table for Hosmer and Lemeshow Test
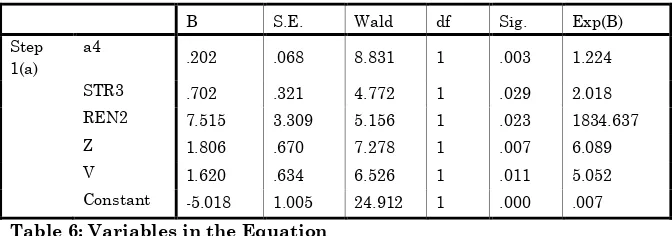
B S.E. Wald df Sig. Exp(B) Step
1(a) a4
.202 .068 8.831 1 .003 1.224
STR3 .702 .321 4.772 1 .029 2.018
REN2 7.515 3.309 5.156 1 .023 1834.637
Z 1.806 .670 7.278 1 .007 6.089
V 1.620 .634 6.526 1 .011 5.052
Constant -5.018 1.005 24.912 1 .000 .007
Table 6: Variables in the Equation
a Variable(s) entered on step 1: a4, STR3, REN2, Z, V.
From the table above we see that the p-values are all smaller than 0.05 leaving us to understand that the variables included in the model are statistically significant.
7. Conclusions
Due to bankruptcy risk especially for SMEs, numerous studies have attempted to analyze credit risk or default prediction models by using several statistical methods. The studies based on SME data are rare and this study might be a bit of help for studding the credit risk of SMEs in an emerging market such as Albanian one. This is because the SMEs play important role in our economy and almost to all the economies in the world.
The Sales to Clients ratio is a ratio that attempts to estimate how long it takes for the company to collect the receivables, within one year. A long collection period induces higher trade credit, thus affecting the liquidity negatively, or in other words, higher the rate sales/clients, better is for the success of the company. A study performed by Don B. Bradley III and Michael J. Rubach (Bradley and Rubach 2002) showed that the difficulties for cashing the receivables from the customers was the main factor that caused the financial distress among the sample of companies.
the business in using its assets to generate net income. In a study made by Ohlson (2006) on the financial ratios and the probabilistic prediction of bankruptcy, this ratio resulted to be statistically significant for purposes of assessing the probability of bankruptcy.
The ability of a company to pay off its debts is measured by the ratio of operation incomes to total liabilities, ignoring the factors of interest, taxes, depreciation and amortization. This ratio is an important metric used by rating agencies to measure the probability of default from the issued debt. Higher values of this ratio, means that the company can afford to take more debt for financing the activity.
As a conclusion, the financial reporting must be complemented by other non accounting of information, capturing important elements that accounting-based financial ratios are missing (Peel et al. 1986; Keasey and Watson 1987). Indeed, information regarding the economic importance of the geographic zone of the company and company age, have been found to be statistically important for the overall credit risk prediction of models developed specifically for SMEs in Albania. In the pursuit of better decisions in the lending to SMEs, further investigation of the usefulness of financial and non-financial variables, is to be done in this field and might be subject to further researches.
BIBLIOGRAPHY:
Altman, Edward, Gabriele Sabato, and Nicholas Willson. 2008. “The value of qualitative information in SME risk management” Journal of Credit Risk 6(2): 95-127.
Bank of Albania. 2012. “Bank Lending Survey Results for the Second Quarter of 2012.” htpp http://www.bankofalbania.org/web/Vrojtimi_per_aktivite tin_kreditues_T4_2012_6532_1.php.
Banking system, analysis of the developments in this field.”http://www.bankofalbania.org/web/Sistemi_Bankar _ne_Shqiperi_Probleme_te_zhvillimit_te_tij_Analize_vro jtimi_Permbledhese_1886_1.php.
Civici, A.. 2012. “From Basel I to Basel III – Three decades in pursuit of banking stability.” “Bankieri” Magazine 24. European bank for reconstruction and development. 2003.
“Enterprise policy Performance assessment of Republic
of Albania”
http://www.oecd.org/countries/albania/30632915.pdf Fullani, Ardian. Ed. 2009. “Monetary policy strategies for small
economies.” Bank of Albania.
IMF. 2013. “Regional Economic Issues Central, Eastern and
Southeastern Europe.”
https://www.imf.org/external/pubs/ft/reo/2013/eur/eng/er eo1013.htm.
Instat. 2012. “Results on structural survey of economic enterprises” (2012), https://www.instat.gov.al.
Meka, E. 2012. “The sustainable Classic Banking System.” Albanian Association of Banks.
Ohlson, J.A. 1980. “Financial ratios and the probabilistic prediction of bankruptcy.” Journal of Accounting Research 18(1): 109-131.
World Bank. 2006. “Report on the observance of standards and
codes (ROSC) Albania.”