1556-6811/11/$12.00 doi:10.1128/CVI.00289-10
Copyright © 2011, American Society for Microbiology. All Rights Reserved.
Development and Validation of a Multiplex Microsphere-Based Assay
for Detection of Domestic Cat (
Felis catus
) Cytokines
䌤
Britta A. Wood, Kevin P. O’Halloran, and Sue VandeWoude*
Department of Microbiology, Immunology and Pathology, College of Veterinary Medicine and Biomedical Sciences, Colorado State University, Fort Collins, Colorado
Received 16 July 2010/Returned for modification 12 September 2010/Accepted 22 December 2010
Cytokines are essential signaling molecules that mediate the innate immune response, and therefore their presence can be of diagnostic, prognostic, and pathogenic significance. Microsphere-based immunoassays allow rapid and accurate evaluation of cytokine levels in several species, including humans, dogs, and mice;
however, technology to evaluate domestic cat (Felis catus) cytokines has been limited to single-analyte
enzyme-linked immunosorbent assays (ELISAs). Microsphere-based immunoassays provide an attractive alternative
technology for detecting and quantifying multiple analytes in a single assay using as little as 50l of sample.
We describe the development and validation of a microsphere-based assay for three commonly analyzed domestic cat cytokines (gamma interferon, interleukin-10, and interleukin-12/interleukin-23 p40) using re-agents from commercially available ELISAs. The assay was optimized for capture and detection antibody concentrations, streptavidin-phycoerythrin concentration, and number of microspheres. The validated lower and upper quantitation limits were 31 and 1,000 pg/ml for gamma interferon, 63 and 2,000 pg/ml for interleukin-10, and 39 and 625 pg/ml for interleukin-12/interleukin-23 p40. Cytokine concentrations in pe-ripheral blood mononuclear cell supernatants were measured, and results obtained by the microsphere assay were correlated with values obtained with commercially available ELISA kits. This technology is a convenient and reproducible assay to evaluate domestic cat cytokine responses elicited by a variety of diseases.
Cytokines are small proteins secreted by cells to coordinate cellular communication in response to inflammation or infec-tion. As such, these molecules have important roles in innate immune responses during an infection and contribute to the activation of the adaptive immune response (reviewed in ref-erence 13). Therefore, characterization of the cytokine re-sponse is crucial for understanding host-pathogen dynamics. Because cytokines are often secreted in small amounts locally and may have short half-lives, detection of cytokines during disease processes has not been routinely performed; however, new technologies that allow cytokine detection, either during disease states in hosts or in tissue culture systems, would pro-vide additional tools for understanding immune modulation.
Frequently, cytokines are assessed by quantitative PCR (qPCR) or by enzyme-linked immunosorbent assay (ELISA); however, both of these methods have limitations (reviewed in references 19 and 20). Although qPCR assays can be devel-oped to detect multiple cytokines simultaneously, relative mRNA expression may not correlate with protein levels. ELISAs, on the other hand, have the capability to quantify protein, but only one cytokine can be detected in a single ELISA. Additionally, these assays are labor-intensive and re-quire a significant sample volume. The latter is of particular importance with laboratory animals because of the limited sample volume (e.g., serum, plasma, or peripheral blood mononuclear cells [PBMC]) that can be safely obtained.
Microsphere-based assays are a relatively new technology
capable of detecting multiple analytes simultaneously (re-viewed in references 9 and 20). Microspheres with spectrally unique internal dyes act as the solid support for individual immunoassays. Using flow cytometry technology, the analyte concentration is determined by the fluorescence intensity of the reporter dye. Currently, there are 100 spectrally unique microspheres available; theoretically, 100 different analytes could be detected in a single sample. There are commercially available cytokine-multiplex kits for humans, nonhuman pri-mates, mice, rats, and dogs; however, no kits are currently available for domestic cats. The availability of human and mouse reagents has allowed the analysis of cytokine levels in a variety of disease states, including sickle cell disease (1), sepsis (5), and viral infection in humans (8) and bacterial pneumonia in mice (6). The capacity to accurately and reproducibly eval-uate cytokine profiles in domestic cats, in both naturally oc-curring and experimentally induced disease states, would po-tentially provide valuable information regarding disease pathogenesis, progression, and prognosis.
The purpose of this study was to develop a microsphere-based immunoassay for the simultaneous quantitation of the feline cytokines gamma interferon (IFN-␥), interleukin-10 (IL-10), and IL-12/IL-23 p40. These cytokines were selected be-cause their mRNA expression during the acute stage of feline immunodeficiency virus (FIV) infection has been evaluated and differences in temporal or relative expression may be rel-evant to immunodeficiency pathogenesis (2, 7, 15). IFN-␥and IL-12 are critical for the differentiation of T-helper 1 (Th1) cells, while IFN-␥is critical for the activation of cytotoxic T lymphocytes (CTLs). CTLs are an important component of the host defense against viral pathogens. IL-10, on the other hand, is a suppressor of a Th1 immune response. Our laboratory * Corresponding author. Mailing address: Department of
Microbi-ology, Immunology and PathMicrobi-ology, Colorado State University, 1619 Campus Delivery, Fort Collins, CO 80523. Phone: (970) 491-7162. Fax: (970) 491-0603. E-mail: [email protected].
䌤Published ahead of print on 5 January 2011.
387
on August 17, 2020 by guest
http://cvi.asm.org/
intends to apply this technology to evaluate cytokine profiles of domestic cats during infection with FIV, a naturally occurring feline virus with many parallels to human immunodeficiency virus (HIV) (14, 16). Measurements of cytokines secreted from cells in culture following experimental infections with different FIV strains could offer new insights into disease pathogenesis and progression. This assay could also be used to study other feline diseases with human applications, such as cancer and inflammatory diseases.
MATERIALS AND METHODS
Capture antibody coupling to microspheres.Carboxylated magnetic micro-spheres (Luminex, Austin, TX) were conjugated with feline IFN-␥, IL-10, and IL-12/IL-23 p40 capture antibodies from DuoSet ELISA Development kits (R&D Systems, Minneapolis, MN) according to the manufacturer’s recommen-dations for two-step carbodiimide coupling of protein to MagPlex-C magnetic carboxylated microspheres (Luminex) (Table 1). Briefly, lyophilized capture antibody was resuspended in 1 ml of sterile phosphate-buffered saline (PBS). Magnetic microspheres were washed with 100l of distilled water and resus-pended in 80l of activation buffer (0.1 M sodium phosphate monobasic, anhydrous, pH 6.2). Carboxyl groups on the surface of the microspheres were chemically activated using 10lN-hydroxysulfosuccinimide (50 mg/ml) and 10l 1-ethyl-3-(3-dimethylaminopropyl)carbodiimide hydrochloride (50 mg/ml) (Fisher Scientific, Pittsburgh, PA). Activated microspheres were washed twice with 250l of coupling buffer [0.05 M 2(N-morpholino)ethanesulfonic acid, pH 5.0] and then resuspended in 100l of the buffer. Capture antibody was added, and the final volume was brought to 500l with coupling buffer. The mixture was incubated for 2 h at room temperature in the dark with gentle rotation. After incubation, coupled microspheres were washed three times (500l and two 1-ml washes) with blocking/storage buffer (PBS, 0.1% bovine serum albumin [BSA], 0.02% Tween 20, 0.05% azide, pH 7.4). The microspheres were then resus-pended in blocking/storage buffer (150l per 106microspheres) and stored at 4°C in the dark for 2 to 4 months. Microsphere concentrations were determined using an automated counter (Invitrogen, Carlsbad, CA).
To confirm antibody coupling, microspheres (⬃5,000) were incubated with a phycoerythrin (PE)-labeled secondary antibody (R&D Systems) according to the manufacturer’s recommendations (Bio-Plex amine coupling kit instruction man-ual: protein coupling validation [Bio-Rad, Hercules, CA]). A median fluores-cence intensity (MFI) of⬎2,000 indicated successful coupling.
Microsphere assay protocol.The immunoassay protocol used in these exper-iments was modified from a protocol for a washed capture sandwich immuno-assay using magnetic microspheres (Luminex). Aliquots of coupled microspheres were combined in assay buffer (PBS, 1% BSA, pH 7.4) for a final concentration of either 50 or 100 microspheres/l per analyte. A 50-l aliquot of the multiplex microsphere solution (i.e.,⬃5,000 or 2,500 microspheres/analyte per well) was then added to each well in a 96-well, round-bottom polystyrene plate (Fisher Scientific). Wells were washed twice with 100l assay buffer using a 96-well magnetic separator (Ambion, Austin, TX) and again after each subsequent incubation. Plates were incubated for 30 min at⬃800 rpm in the dark at room temperature. Microspheres were incubated in 50l of solution in the following order: (i) sample, standard, spike, or cell culture medium control (5 to 20% heat-inactivated fetal bovine serum, 2% glutamine, 0.5% 2-mercapto ethanol, 1% penicillin-streptomycin, quantity sufficient [q.s.] RPMI 1640); (ii) detection antibody; and (iii) streptavidin-PE (Invitrogen). After the final incubation and washes, the microspheres were resuspended in 100l of assay buffer and ana-lyzed.
A Bio-Plex 200 instrument (Bio-Rad) was calibrated before each analysis and
validated monthly to ensure optimal performance of optics, reporters, fluidics, and classification per the manufacturer’s recommendations. Each plate included an eight-point standard curve (2-fold dilution series) and four control wells, in addition to samples with known or unknown analyte concentrations. All stan-dards and samples were run in duplicate. Median fluorescence intensity was calculated fromⱖ100 microspheres per analyte per well. Bio-Plex Manager 5.0 (Bio-Rad) was used for data collection and analysis. A five-parameter logistic standard curve was generated for each analyte from the standards by plotting concentration versus fluorescence. The computer program calculated the con-centration of each sample or spike using the respective analyte standard curve. Acceptable standard recovery was 70 to 130% of the nominal value (Bio-Plex cytokine assay instruction manual; Bio-Rad).
Microsphere assay development.Assay development and optimization were conducted in the following order: (i) optimization of capture antibody concen-trations, (ii) optimization of detection antibody concenconcen-trations, (iii) determina-tion of standard curve ranges, (iv) evaluadetermina-tion of cross-reactivity among analytes, (v) comparison of MFI between single and multiplex standard curves, (vi) opti-mization of streptavidin-PE concentration, and (vii) optiopti-mization of the number of microspheres per well. Capture antibody concentrations tested were 1, 2.5, 5, 7.5, 10, and 15g per 106microspheres. Detection antibody concentrations tested were 1⫻, 2⫻, and 3⫻the recommended concentration for ELISA pro-tocols. Standard curve ranges evaluated were based upon the recommendations of the ELISA protocols (7-point curves), with three additional lower concentra-tions (i.e., a 10-point curve was tested). To test for cross-reactivity among ana-lytes, each cytokine standard curve was individually tested with multiplex micro-spheres and detection antibody. Additionally, to determine if the MFI was affected by multiplexing analytes, single and multiplex standard curves were compared. Streptavidin-PE concentrations tested were 2, 3, and 4g/ml. The numbers of microspheres tested per well were approximately 1,000, 2,000, 2,500, and 5,000 microspheres per analyte to determine the minimum number required per well.
Multiplex assay validation.Intra- and interassay experiments were conducted to determine both the accuracy and precision of the multiplex assay. In these experiments, the spike concentrations tested were based upon the dilution series of the standard curve. The stock solution of each standard provided by the ELISA kit manufacturer was diluted to three concentrations and spiked into cell culture medium to test the accuracy of detecting sample concentrations based upon the standard curves generated. Spike concentrations were as follows: (i) 31, 250, and 1,000 pg/ml for IFN-␥; (ii) 63, 500, and 2,000 pg/ml for IL-10; and (iii) 39, 156, and 625 pg/ml for IL-12/IL-23 p40. For the intra-assay experiment, 10 wells with each spike concentration were run in a single experiment. For the interassay experiments, spiked samples (duplicate or quadruplicate wells) were run in nine separate experiments.
Acceptable spike recovery was 70 to 130% of the nominal value (Assay qual-ification guidelines for Luminex assays; Panomics, Santa Clara, CA). The coef-ficient of variation (CV) for the mean spike recoveries at each concentration was required to be⬍20% for the intra-assay experiment and⬍30% for the interassay experiments (Bio-Rad, personal communication). The lower limit of quantita-tion (LLOQ) was the lowest concentraquantita-tion tested that was repeatedly recovered. The upper limit of quantitation (ULOQ) was the highest concentration tested that was repeatedly recovered.
Generation of supernatant from domestic cat PBMC.We compared cytokine values determined by commercially available, unvalidated ELISAs (DuoSet ELISA Development kits; R&D Systems) to those determined by the multiplex assay using cell culture supernatant samples generated from domestic cat PBMC. The ELISA kits are marketed as a reagent resource for analysis of cytokines in cell culture supernatant. Cell culture supernatant samples generated in our laboratory were tested to verify that the multiplex assay was capable of detecting TABLE 1. Components used for the development of the domestic cat microsphere assaya
Analyte Microsphere
region Capture antibody Detection antibody Standard
Feline IFN-␥ 15 Goat anti-feline IFN-␥ Biotinylated goat anti-feline IFN-␥ Recombinant feline IFN-␥ Feline IL-10 33 Mouse anti-feline IL-10 Biotinylated goat anti-feline IL-10 Recombinant feline IL-10 Feline IL-12/IL-23 p40 55 Goat anti-feline IL-12/IL-23 p40 Biotinylated goat anti-feline IL-12/
IL-23 p40
Recombinant feline IL-12/ IL-23 p40
a
The analyte, capture antibody, detection antibody and standard were from the DuoSet ELISA (R&D Systems). The microsphere region (MagPlex-C microspheres; Luminex) was assigned by the manufacturer based on the ratio of two internal dyes.
on August 17, 2020 by guest
http://cvi.asm.org/
natural cytokines produced by domestic cat cells (i.e., other than the recombi-nant cytokine standards).
Specific-pathogen-free domestic cats were housed in Association for Assess-ment and Accreditation of Laboratory Animal Care International (AAALAC, Intl.) approved facilities and handled under protocols approved by the Colorado State University Institutional Animal Care and Use Committee (IACUC). He-parinized blood was collected from both naïve and FIV-positive cats sedated with ketamine-acepromazine. PBMC were isolated using a Histopaque gradient (Sig-ma-Aldrich, St. Louis, MO) and resuspended in medium. Cells were grown in the presence of 0, 0.5, or 5g/ml of concanavalin A (ConA) (Sigma-Aldrich). Additionally, PBMCs from naïve cats were infectedin vitrowith one of two FIV strains, as a component of other ongoing experiments. Supernatants were har-vested from 1 to 10 days postculture and stored in aliquots of 0.5 to 1 ml at
⫺80°C until tested with both assays.
ELISA and multiplex cytokine analysis of supernatant samples.The manu-facturer’s protocol was followed for each ELISA, although the standard curve range was altered to reflect the range used in the microsphere assay. IFN-␥, IL-10, and IL-12/IL-23 p40 concentrations in all samples were tested simulta-neously by both assays to minimize freeze-thaw and sample storage variability. Samples were included in the assay comparison analysis if the concentrations obtained from both assays were within the standard range tested (i.e., a sample was excluded if one or both assays resulted in a concentration above or below the standard range). Values were compared using a Spearman’s rank correlation for nonparametric data and 95% prediction intervals (GraphPad Prism 5.0; Graph-Pad, La Jolla, CA).
RESULTS
Microsphere assay conditions.Each component of the
mi-crosphere assay was tested individually. The findings from these experiments (summarized in Table 2) are as follows.
(i) Capture antibody concentration.The optimal
concentra-tion was the highest point in the linear range (i.e., before saturation). Five micrograms of capture antibody per 106
crospheres was found to be the optimal concentration for mi-crosphere coupling for each analyte.
(ii) Detection antibody concentration. Concentrations that
resulted in MFIs of⬎2,000 for a high standard and⬍100 for a low standard were selected. For IL-10, the concentration of detection antibody that met these criteria was the same as the concentration recommended in the ELISA protocol (200 ng/ ml). For IFN-␥and IL-12/IL-23 p40, the concentrations that met these criteria were 3⫻the recommended ELISA concen-trations (2.4 g/ml and 300 ng/ml, respectively). Detection antibody saturation was not determined.
(iii) Standard curve range. All 10 tested concentrations
were detected for each analyte (Table 3). The lowest concen-tration (8 pg/ml for IFN-␥, 16 pg/ml for IL-10, and 5 pg/ml for IL-12/IL-23 p40) was eliminated from future standard curves because the MFI was only slightly higher than that of unspiked controls. The highest concentration (4,000 pg/ml for IFN-␥, 8,000 pg/ml for IL-10, and 2,500 pg/ml for IL-12/IL-23 p40) was also eliminated because this was above the expected concen-tration for cell culture supernatant samples.
(iv) Testing for cross-reactivity among analytes. Minimal
cross-reactivity was observed among analytes (data not shown). (v) Comparison of MFI between single and multiplex
stan-dard curves.Each analyte had only minor differences between
single and multiplex standard curves (Fig. 1), indicating that these analytes could be analyzed in multiplex format.
TABLE 2. Optimized concentrations of reagents
Cytokine
Capture antibody (g/106 microspheres)
Detection antibody
(ng/ml)
Streptavidin-PE (g/ml)
Microsphere input (per region per well)
IFN-␥ 5 2,400 3 2,500
IL-10 5 200 3 2,500
IL-12/IL-23 p40 5 300 3 2,500
TABLE 3. Standardized range for each analyte using the microsphere assay compared to the recommended
standard range for the ELISAs
Assay and parameter pg/ml
IFN-␥ IL-10 IL-12/IL-23 p40
ELISA, standard curve 63–4,000 125–8,000 39–2,500
Microsphere assay
Standard range tested 8–4,000 16–8,000 5–2,500 Standard curve 16–2,000 31–4,000 10–1,250
LLOQ 31 63 39
ULOQ 1,000 2,000 625
FIG. 1. Single and multiplex standard curves are comparable. (a) IFN-␥; (b) IL-10; (c) IL-12/IL-23 p40.
on August 17, 2020 by guest
http://cvi.asm.org/
(vi) Streptavidin-PE concentration. The streptavidin-PE concentration used up to this stage of the optimization process (i to v) was 4 g/ml as per the microsphere manufacturer’s recommendations. All standards were detectable when the concentration of streptavidin-PE was decreased to 3 g/ml. The lowest concentration of the IL-12/IL-23 p40 standard curve was not detected when the streptavidin-PE concentra-tion was decreased to 2g/ml; therefore, 3g/ml was used for all further experiments.
(vii) Microsphere concentration.The microsphere input per
well for each analyte used throughout the optimization process (i to vi) was 5,000 as per the microsphere manufacturer’s rec-ommendations. Standard concentrations and microsphere readings were unaffected by decreasing the microsphere input to 2,500 per analyte (i.e., the minimum of 100 microspheres were read for each analyte). Decreasing the microsphere input to 2,000 per well or below did not always result in the reading of 100 microspheres; therefore, we determined 2,500 to be the lower limit for assay reproducibility.
Multiplex assay validation.For all three analytes, the
indi-vidual spike concentration recoveries (accuracy) were within the manufacturer-recommended acceptable range of 70 to 130%. The mean recoveries for each analyte at each concen-tration for the inter- and intra-assay experiments were within these limits (Table 4). Precision was measured as the percent CV of the individual recoveries for spikes at each concentra-tion per analyte. All of the percent CVs for the inter- and intra-assay experiments were also within the validation re-quirements recommended by the manufacturer (⬍20% in the intra-assay experiments and ⬍30% in the interassay experi-ments) (Table 4).
The validated limits of quantitation per analyte are summa-rized in Table 3. The lowest standard used for each analyte in the microsphere assay is one-fourth the concentration of the lowest standard recommended for each ELISA protocol.
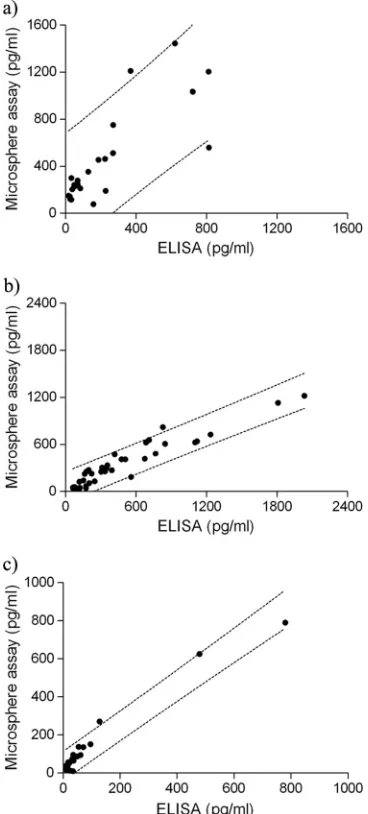
Comparison to commercially available ELISAs.The
num-ber of supernatant samples in which cytokine concentrations were quantifiable by both ELISA and the microsphere assay varied for each analyte (Fig. 2) (n⫽24 for IFN-␥,n⫽38 for IL-10, andn ⫽27 for IL-12/IL-23 p40). The Spearman rank correlation (Rs) was 0.79 for IFN-␥, 0.93 for IL-10, and 0.86 for IL-12/IL-23 p40. The values indicate a positive linear relation-ship between cytokine concentrations obtained by ELISA and by the multiplex microsphere assay. Most data fell within the
95% prediction interval (Fig. 2), further demonstrating high correlation between the assays.
DISCUSSION
This study demonstrates the successful development and validation of a microsphere-based immunoassay for the quantification of the domestic cat cytokines IFN-␥, IL-10 and IL-12/IL-23 p40. To our knowledge, this is the first microsphere-based assay developed for the domestic cat.
The microsphere assay has several advantages over commer-cially available ELISAs. The time required for the microsphere assay is less than the time required for the three ELISAs, and the microsphere assay is much simpler to conduct. The micro-sphere assay detects lower concentrations of the analytes than the standard ranges recommended by the ELISA protocols (Table 3). Additionally, the microsphere assay requires only 50
FIG. 2. Cytokine concentrations in domestic cat PBMC samples measured by ELISA and the microsphere assay are correlated. (a) IFN-␥; (b) IL-10; (c) IL-12/IL-23 p40. Dashed lines represent the 95% prediction intervals.
TABLE 4. Assay precision and accuracy over a range of analyte concentrations
Expt and spike level
Mean % recovery (% CV)
IFN-␥ IL-10 IL-12/IL-23 p40
Intra-assay
High 120 (5) 106 (4) 114 (4)
Medium 120 (4) 99 (13) 116 (4)
Low 109 (11) 95 (7) 110 (10)
Interassay
High 105 (5) 107 (8) 108 (5)
Medium 109 (5) 107 (6) 111 (5)
Low 103 (16) 109 (8) 112 (9)
on August 17, 2020 by guest
http://cvi.asm.org/
l of sample for analysis, compared to 300l of sample re-quired for performing the three corresponding cytokine ELISAs. Finally, the microsphere assay has been optimized and validated using industry-recommended requirements, en-suring reproducible quantification of cytokine values both within and among experiments.
The true quantifiable range of each cytokine is likely broader than the range tested (i.e., the true ULOQ is likely higher and the true LLOQ is likely lower than the concen-trations tested in this assay). The high spikes had the same concentration as the second-highest standard, whereas the low spikes had the same concentration as either the second-or third-lowest standard. Although the true ULOQs of the assay were not reached, the majority of the cell culture supernatant samples for each analyte were below the high spike concentration. This is demonstrated in Fig. 2 by de-tectable levels of cytokines in PBMC cultures; most concen-trations were detected in the lower 30 to 50% of the stan-dard range. The highest values tended to occur in supernatants from PBMC stimulated with high concentra-tions of a ConA, a potent T cell mitogen.
Cytokine concentrations of biologically relevant samples in the microsphere assay and ELISAs were compared. Since the ELISAs were not validated, we cannot state with cer-tainty that the absolute values obtained by both assays are equivalent; however, correlation analysis does demonstrate that values were proportionate and fell within the 95% pre-dictive limits for the vast majority of data points. This anal-ysis indicates that the multiplex assay has been properly established to predict cytokine concentrations in samples and that these values would be similar to those obtained with the commercially available ELISAs.
During intra- and interassay validation, it was noted that fluorescence decreased across the plate (i.e., MFI was higher in the first samples read and the values decreased over time), though recoveries were still within the accept-able range. Experiments conducted after assay validation revealed that resuspension of microspheres in a 0.1% for-malin solution before analysis decreased MFI drift (10, 12; see Technology tips: stop solution or fixative [Luminex]). It is possible that the accuracy and precision of the validation experiments would have improved if this fixation step had been included; however, the values reported here are similar to those reported for other assays with (10) and without (4, 11) fixation. We therefore recommend that a formalin fixa-tion step be considered as a component of cytokine multi-plex procedures to stabilize MFI and to increase assay ac-curacy and precision.
Microsphere-based assay development has expanded the number of analytes that can be simultaneously detected in biological samples (e.g., cytokines, antigens, and antibod-ies). Commercially available cytokine kits and assays devel-oped by individual research groups (e.g., for porcine [4] and horse [21] cytokines) provided valuable insights into the innate immune response of a host against infection. For example, microsphere-based assays have been used to char-acterize the cytokine response in the lymph nodes of chron-ically infected HIV patients (3) and cytokine production during acute HIV-1 infections (17). Both studies demon-strate quantifiable differences in cytokine levels between
HIV-infected tissues/patients and control/comparison groups. These differences stress the importance of charac-terizing the innate immune response in HIV infections in order to gain insights into future vaccine and drug develop-ment. Additionally, in a translational study for human acute lung injury (ALI), investigators characterized the cytokine response of canines with induced ALI and the effect of sphingosine 1-phosphate (S1P) treatment (18). Although there was variation in cytokine production and S1P was found to reduce lung injury, this appeared to be indepen-dent of the cytokine response. We speculate that the do-mestic cat cytokine assay described here may have both experimental and clinical applications for defining disease states.
In summary, this study describes an optimized and vali-dated assay for the simultaneous quantification of three domestic cat cytokines in a convenient and reproducible platform. Commercially available reagents that could be used to expand this panel for the detection of additional cytokines include those for IL-1, IL-2, IL-4, IL-6, and/or tumor necrosis factor alpha, adding to the utility of this assay. Further efforts will be directed toward the develop-ment of a similar assay for the detection of cytokines in domestic cat plasma/serum samples.
ACKNOWLEDGMENTS
We thank Martha MacMillan for assistance in performing ELISAs, Paul Morley (Colorado State University) for assistance with assay validation analyses and statistical interpretation, and Sarah Bevins for critical review of the manuscript. Matthew Myles, Susan Cushing, and Elena Kocher (University of Missouri, Columbia), Laxmi Chokhani and Jamie Eveleigh (Luminex technical support), and Janette Walters (Bio-Rad technical support) assisted with assay development and trou-bleshooting.
This work was supported by NIH-NHLBI grant 5R01HL092791.
REFERENCES
1.Asare, K., et al.2010. Plasma interleukin-1beta concentration is associated with stroke in sickle cell disease. Cytokine49:39–44.
2.Avery, P. R., and E. A. Hoover.2004. Gamma interferon/interleukin 10 balance in tissue lymphocytes correlates with down modulation of mucosal feline immunodeficiency virus infection. J. Virol.78:4011–4019.
3.Biancotto, A., et al.2007. Abnormal activation and cytokine spectra in lymph nodes of people chronically infected with HIV-1. Blood109:4272–4279. 4.Bjerre, M., T. K. Hansen, A. Flyvbjerg, and E. Tønnesen.2009. Simultaneous
detection of porcine cytokines by multiplex analysis: development of mag-netic bioplex assay. Vet. Immunol. Immunopathol.130:53–58.
5.Bozza, F. A., et al.2007. Cytokine profiles as markers of disease severity in sepsis: a multiplex analysis. Crit. Care11:R49.
6.Buff, S. M., et al.2010. IL-10 delivery by AAV5 vector attenuates inflam-mation in mice with Pseudomonas pneumonia. Gene Ther.17:567–576. 7.Dean, G. A., and N. C. Pedersen.1998. Cytokine response in multiple
lym-phoid tissues during the primary phase of feline immunodeficiency virus infection. J. Virol.72:9436–9440.
8.Jiang, B., et al.2003. Cytokines as mediators for or effectors against rotavirus disease in children. Clin. Diagn. Lab Immunol.10:995–1001.
9.Kellar, K. L., and M. A. Iannone.2002. Multiplexed microsphere-based flow cytometric assays. Exp. Hematol.30:1227–1237.
10.Kellar, K. L., et al.2001. Multiplexed fluorescent bead-based immunoassays for quantitation of human cytokines in serum and culture supernatants. Cytometry45:27–36.
11.Martins, T. B., et al.2002. Determination of cytokine responses using a multiplexed fluorescent microsphere immunoassay. Am. J. Clin. Pathol.118:
346–353.
12.McCutcheon, K.2008. A multiplex approach to isotyping antigen-specific antibodies using biotinylated antigen/streptavidin-phycoerythrin. Methods Mol. Biol.418:187–208.
13.Medzhitov, R., and C. A. Janeway, Jr.1997. Innate immunity: impact on the adaptive immune response. Curr. Opin. Immunol.9:4–9.
14.Pedersen, N. C., J. K. Yamamoto, T. Ishida, and H. Hansen.1989. Feline
on August 17, 2020 by guest
http://cvi.asm.org/
immunodeficiency virus infection. Vet. Immunol. Immunopathol.21:111– 129.
15.Ritchey, J. W., J. K. Levy, S. K. Bliss, W. A. Tompkins, and M. B. Tompkins.
2001. Constitutive expression of types 1 and 2 cytokines by alveolar macro-phages from feline immunodeficiency virus-infected cats. Vet. Immunol. Immunopathol.79:83–100.
16.Sparger, E. E.2006. FIV as a model for HIV: an overview, p. 149–237.InM. Bendinelli, H. Friedman, and S. Specter (ed.), In vivo models of HIV disease and control. Springer, New York, NY.
17.Stacey, A. R., et al.2009. Induction of a striking systemic cytokine cascade prior to peak viremia in acute human immunodeficiency virus type 1 infec-tion, in contrast to more modest and delayed responses in acute hepatitis B and C virus infections. J. Virol.83:3719–3733.
18.Szczepaniak, W. S., et al.2008. Sphingosine 1-phosphate rescues canine LPS-induced acute lung injury and alters systemic inflammatory cytokine production in vivo. Transl. Res.152:213–224.
19.Vandebriel, R. J.2007. Cytokine measurement tools for immunotoxicology, p. 17–30.InR. V. House and J. Descotes (ed.), Cytokines in human health. Immunotoxicology, pathology, and therapeutic applications. Humana Press Inc., Totowa, NJ.
20.Vignali, D. A.2000. Multiplexed particle-based flow cytometric assays. J. Im-munol. Methods243:243–255.
21.Wagner, B., and H. Freer.2009. Development of a bead-based multiplex assay for simultaneous quantification of cytokines in horses. Vet. Immunol. Immunopathol.127:242–248.