SAR Imaging on HEO Satellites with an Improved
Frequency-Domain Algorithm
Po-Chih Chen and Jean-Fu Kiang*
Abstract—The possibility of employing highly-elliptical-orbit (HEO) satellites for SAR imaging is investigated. A constellation of two satellites in the Tundra orbits, which are capable of covering all the high-latitude areas, are chosen as the platforms for SAR imaging. The received signal is processed with an improved frequency-domain algorithm (FDA) to reconstruct the image. Simulation results verify that the proposed method can produce better SAR images with less computational load and memory than the conventional FDA.
1. INTRODUCTION
Geosynchronous (GEO) satellites have been used for radio/TV broadcast, weather monitoring [1–3] and image processing [4–10]. Compared with medium-earth-orbit (MEO) and low-earth-orbit (LEO) satellites, the GEO satellites have the advantages of wider coverage, longer life-time, lower gateway cost and higher stability. The orbit of a GEO satellite is close to a complete circle, leading to steady free-space loss and link budget. However, GEO satellites require higher transmission power, while producing images with relatively poorer resolution.
Highly-elliptical-orbit (HEO) satellites have been used for communications over high-latitude areas, where signals from GEO satellites are frequently blocked by the terrains [11]. Typically, a number of satellites are deployed on complementary orbits to provide complete coverage over a specific area [11]. Satellites were employed on the Molniya and the Tundra orbits [12–16] by the former Soviet Union, for TV broadcast to high-latitude cities. A constellation of three satellites can be deployed in a Molniya orbit to provide continuous coverage at a specific longitude. Each satellite has a 12-hour period and is operational over an 8-hour window around the apogee. Similar coverage can be provided to a point on the ground in the same hemisphere but 180◦ of longitude apart. For example, the same Molniya orbit can provide good coverage to both Siberia and North America. The apogee of a Tundra orbit lies at almost twice the altitude of a GEO orbit. The period of satellites on a Tundra orbit is 24 hours, and only two satellites are required to provide continuous coverage to a specific area, with each operating for 12 hours.
In this work, HEO satellites are envisioned as platforms for SAR imaging. A constellation of two satellites in the Tundra orbit are simulated to detect a point target on the ground. In such a HEO SAR mission, the Doppler centroid is extremely large when the satellite is far away from the apogee, due to high eccentricity of the orbit. Thus, a large number of azimuth samples are required to obtain an image with compatible resolution to that achieved in a low-squint mode. In addition, the difference between the maximum and the minimum distances between the satellite and the target area is extremely large, demanding a much larger number of range samples than that in a low-squint mode. As a result, the computational load and the memory size are significantly increased. To resolve all these issues, a modified frequency-domain algorithm (FDA), suitable for high-squint SAR imaging, is proposed to
Received 13 January 2017, Accepted 28 February 2017, Scheduled 9 April 2017
* Corresponding author: Jean-Fu Kiang ([email protected]).
support the envisioned HEO SAR missions, which takes much lower computational load and memory size than those demanded by the conventional FDA.
This paper is organized as follows. The proposed method is presented in Section 2, and the satellite orbit and ephemeris are briefly reviewed in Section 3. Simulation results, including the image quality as well as the computational load and memory size, over six mission events are discussed in Section 4. Finally, some conclusions are drawn in Section 5.
2. PROPOSED METHOD
Figure 1 shows a flowchart of the proposed method for high-squint SAR imaging, which is similar to the conventional FDA [4], and the processes different from those in the latter are enclosed with parentheses. The received baseband signal is rotated in the τ-η plane before being Fourier transformed to the fτ-fη plane. The reference function multiply (RFM) filter is rotated in the fτ-fη plane with the same angle. Finally, the processed signal is reversely rotated in theτ-η plane to form the final image.
Figure 1. Flowchart of proposed method for high-squint SAR imaging. The processes enclosed with parentheses are different from those in the conventional FDA [4].
The received baseband signal can be represented as
srb(τ, η) =A0(x, y)we(τ −2Rs(η, x, y)/c)e−j4πf0Rs(η,x,y)/c+jπKr[τ−2Rs(η,x,y)/c] 2
(1)
whereτis the range (fast) time;A0(x, y) is a complex amplitude associated with the scattering amplitude
of a point target at (x, y,0); f0 is the carrier frequency, cis the speed of the light;Kr is the FM rate of
the LFM pulse with duration Tr; we(τ) = rect(τ /Tr) is the range window with duration Tr; rect(τ) is a rectangular function defined as
rect(τ) =
1, |τ| ≤1/2
0, otherwise (2)
The received baseband signal is stored in a matrix of dimension Na ×Nr, where the azimuth sampling number (Na) determines the resolution in the azimuthal direction, and the range sampling number (Nr) should be large enough to record all the echoed signals from the target area. For the convenience of applying the fast Fourier transform (FFT) algorithm, bothNaand Nr are incremented, respectively, to the nearest integers that are powers of two.
2.1. Rotation in τ-η Plane
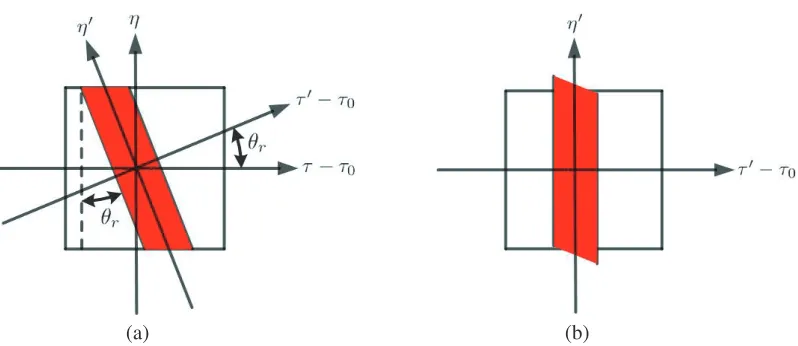
Figures 2(a) and 2(b) show the schematic of the received baseband signal in the coordinates (τ −τ0, η)
and (τ−τ0, η), respectively, where τ0 = 2Rs0/c and Rs0 is the distance from the center point of the
(a) (b)
Figure 2. Schematic of received baseband signal represented in coordinates (a) (τ −τ0, η) and (b)
(τ−τ0, η).
samples has been significantly reduced in the coordinates of (τ−τ0, η). The rotation angleθr between
these two coordinate systems is determined as θr = tan−1 2L/VD/cp, whereLis the total length of the flight path, and D is the length difference between the line segments that connect the BCP to the starting point and the ending point, respectively, of the flight path. Explicitly, these two coordinate systems are related as
τ −τ0
η
=
cosθr −sinθr sinθr cosθr
τ−τ0
η
=
(τ−τ0) cosθr−ηsinθr
(τ−τ0) sinθr+ηcosθr
(3) or τ η =
(τ−τ0) cosθr−ηsinθr+τ0
(τ−τ0) sinθr+ηcosθr
=
g(τ, η)
h(τ, η)
The received baseband-signal originally stored with respect to the (τ, η) coordinates can be represented in the (τ, η) coordinates as
srb(τ, η) =srb(τ, η)
τ=g(τ,η),η=h(τ,η)
(4)
which are stored in a matrix of dimensionNa×Nr. For the convenience of applying the FFT algorithm, bothNa and Nr are incremented, respectively, to the nearest integers that are powers of two. Without loss of generality, we choose Δτ = Δτ and Δη = Δη.
2.2. DRM-5
The slant range in a GEO SAR mission can be represented as [4]
Rs(η) =|¯rs(η)−r¯g(η)| (5)
where ¯rs(η) and ¯rg(η) are the positions of the satellite and the target, respectively, at azimuth timeη. Define
¯
R(η) = ¯rs(η)−r¯g(η), V¯(η) = d ¯
R(η)
dη = ¯vs(η)−¯vg(η)
¯
A(η) = dV¯(η)
dη = ¯as(η)−¯ag(η),
¯
B(η) = dA¯(η)
dη = ¯bs(η)−
¯bg(η)
¯
D(η) = d ¯
B(η)
dη = ¯ds(η)−
¯
dg(η), E¯(η) = d ¯
D(η)
where ¯vs(η) and ¯vg(η) are the velocity vectors of the satellite and the target, respectively, at azimuth time
η; ¯as(η) and ¯ag(η) are the satellite acceleration vector and the target acceleration vector, respectively; ¯bs(η) and ¯bg(η) are the time derivatives of ¯as(η) and ¯ag(η), respectively; ¯ds(η) and ¯dg(η) are the time derivatives of ¯bs(η) and ¯bg(η), respectively; ¯es(η) and ¯eg(η) are the time derivatives of ¯ds(η) and ¯dg(η), respectively; all at azimuth timeη. A fifth-order Doppler parameter range model (DRM-5) is represented as [4].
Rs(η) =Rc+
5
n=1
knηn (6)
whereRc =|R¯(0)|is the slant range at η= 0, and
k1 =
¯
Rt(0)·V¯(0)
|R¯(0)| , k2=
¯
Rt(0)·A¯(0) + ¯Vt(0)·V¯(0)−k12
2|R¯(0)|
k3 =
¯
Rt(0)·B¯(0) + 3 ¯Vt(0)·A¯(0)−6k1k2
6|R¯(0)|
k4 =
¯
Rt(0)·D¯(0) + 4 ¯Vt(0)·B¯(0) + 3 ¯At(0)·A¯(0)
24|R¯(0)| −
k22+ 2k1k3
2|R¯(0)|
k5 =
¯
Rt(0)·E¯(0) + 5 ¯Vt(0)·D¯(0) + 10 ¯At(0)·B¯(0)
120|R¯(0)| −
k2k3+k1k4 |R¯(0)|
2.3. Modified RFM Filter
The RFM filter used in the conventional FDA is represented as [4]
HRFM(fτ, fη) =e−j[φr(fτ)+φRCM(fτ,fη)+φa(fη)+φc(fτ,fη)] (7)
where φr(fτ), φRCM(fτ, fη), φa(fη) and φc(fτ, fη) are the phases to conduct range compression, range
cell migration (RCM) correction, azimuth compression and decoupling, respectively. Their explicit forms are
φr(fτ) = −πf
2
τ
Kr
φRCM(fτ, fη) = −
4πfτ
c
Rc+λ
2 0A1
8
2fdc(fη−fdc)+(fη−fdc)2
−λ30A2
24
3fdc(fη−fdc)2+2(fη−fdc)3
+λ
4 0A3
64
4fdc(fη −fdc)3+ 3(fη −fdc)4
−λ50A4
160
5fdc(fη−fdc)4+ 4(fη−fdc)5
φa(fη) = −4πRc
λ0
+πλ0A1
2 (fη−fdc)
2−πλ20A2
6 (fη−fdc)
3+πλ30A3
16 (fη−fdc)
4−πλ40A4
40 (fη−fdc)
5
φc(fτ, fη) =
πfτ2fη2 f2
0
λ0A1
2 −
λ20A2
2 (fη−fdc) + 3λ30A3
8 (fη−fdc)
2− λ40A4
4 (fη −fdc)
3
+
πfτ3fη2 f3
0
−λ0A1
2 +
λ20A2
6 [4(fη−fdc)+fdc]−
λ30A3
8
5 (fη−fdc)2+2fdc(fη−fdc)
+λ
4 0A4
4
2 (fη−fdc)3+fdc(fη −fdc)2
where
A1=
1 2k2
, A2 =−
3k3
8k3 2
, A3 =
9k23−4k2k4
16k5 2
, A4=−
135k33−120k2k3k4+ 20k22k5
Before applying the RFM filter, it is first rotated to thefτ-fη domain as [17]
HRFM(fτ, fη) =HRFM(fτ, fη)
fτ=g1(fτ,fη),fη=h1(fτ,fη)
(8)
where the (fτ, fη−fdc) and the (fτ, fη −fdc) coordinates are related by the same rotation angleθr as
fτ
fη−fdc
=
cosθr −sinθr sinθr cosθr
fτ fη −fdc
=
fτ cosθr−(fη −fdc) sinθr
fτ sinθr+ (fη −fdc) cosθr
or
fτ
fη
=
fτ cosθr−(fη −fdc) sinθr
fτsinθr+ (fη −fdc) cosθr+fdc
=
g1(fτ, fη)
h1(fτ, fη)
3. SATELLITE ORBIT AND EPHEMERIS
Table 1 lists the parameters of a Tundra orbit [12]. A constellation of two satellites are deployed to detect a point target specified in the Earth-centered Earth-fixed (ECEF) coordinate system. The right-of-ascending-node and true anomaly of the second satellite differ from those of the first one by 180◦, and the other parameters are the same.
Figure 3 shows the ephemeris of the two Tundra satellites. The solid circle marks a point target randomly selected for testing. Along each ephemeris, the thick part marks the working period, which is centered around the apogee and lasts for half of the period.
Figure 4 shows the time history of squint angles (θs) measured from the two Tundra satellites. The period (T) of each Tundra satellite is 24 hours, and the first satellite passes the apogee att= 0. Thus,
Table 1. Parameters of Tundra orbit [12].
parameter symbol magnitude unit
semi-major axis a 42,164 km
eccentricity e 0.3
right of ascending node Ω 40 deg. orbital inclination i 63.4 deg.
argument of perigee ω 270 deg.
true anomaly ν 180 deg.
Figure 3. Ephemeris of two Tundra satellites, the solid circle marks a point target randomly selected for testing.
the first satellite operates in 0< t < T /4 and 3T /4< t < T, and the second one operates for the rest of the period.
4. SIMULATIONS AND DISCUSSIONS
Table 2 lists the parameters of a GEO SAR mission, which will be used for simulations in this work [4]. Table 3 lists the number of multiplications (NOMs) which are required by the proposed method and the conventional FDA, respectively. The memories required by the conventional FDA and the proposed method to store the received signal are on the order of Nr×Na and Nr×Na, respectively.
Table 2. Parameters of a SAR mission [4].
parameter symbol magnitude unit
carrier frequency f0 1.2 GHz
chirp pulse duration Tr 50 µs
range chirp rate Kr 620 GHz
bandwidth Br 31 MHz
range sampling rate Fr 64 / 128∗ MHz range sampling interval Δτ 15.63 / 7.81∗ ns
azimuth sampling rate Fa 120 / 240∗ Hz azimuth sampling interval Δη 8.33 / 4.17∗ ms
a/b∗: ais used in Events E1-E4 and bis used in Events E5,E6.
Table 3. Number of multiplications in algorithms.
operation conventional FDA proposed method
signal rotation none 4NrNa
spectrum rotation none 4NrNa
range FFT 2NrNalog2Na 2NrNalog2Na
azimuth FFT 2NaNrlog2Nr 2NaNrlog2Nr fτ2, fτ3,fη2 2Nr+Na 3NrNa
(fη−fdc)2 - (fη −fdc)5 4Na 4NrNa
φr Nr NrNa
φRCM 8Na+NrNa 9NrNa
φa 4Na 4NrNa
φc 12Na+ 2NrNa 14NrNa
HRFM 2NrNa 2NrNa
date blocking none none
residual phase compensation none none
range IFFT 2NrNalog2Na 2NrNalog2Na
azimuth IFFT 2NaNrlog2Nr 2NaNrlog2Nr
coordinate mapping Na+Nr 2NrNa
The SAR images of the target point are taken at six locations, marked as eventsE1-E6 in Figs. 3
and 4. The four extreme events (E1-E4) involve high squint angles, the moderate event (E5) involves a
FDA and the proposed method are applied to reconstruct the images of the point target. The four extreme events are expected to impose more stringent challenges on applying the HEO satellites for SAR imaging. In each event, the responsible satellite is determined first, then both the conventional FDA and the proposed method are applied to reconstruct the image of the point target.
4.1. Event E1
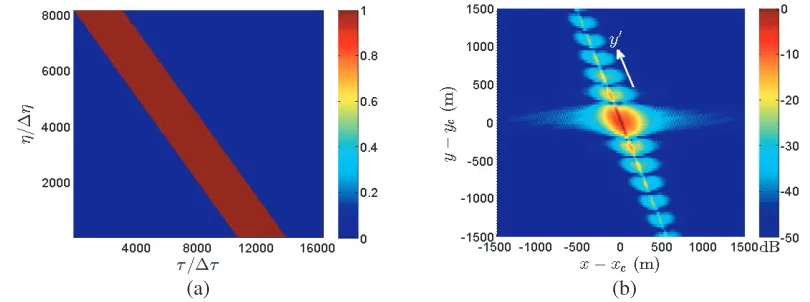
Figure 5(a) shows the received signal in the τ-η plane, which is computed by using Eq. (1). Fig. 5(b) shows the image reconstructed with the conventional FDA, in which local maxima are observed along thex axis andy axis.
(a) (b)
Figure 5. (a) Received signal in τ-η plane and (b) image reconstructed with the conventional FDA,
Nr = 16,384, Na= 8,192.
Figure 6(a) shows the received signal in theτ-η plane, computed by using Eq. (4), and Fig. 6(b) shows the image reconstructed with the proposed method. The number of range samples is reduced to Nr = 4,096, which is large enough to store the received baseband signal after rotation; and the number of azimuth samples remains asNa = 8,192. The choice of these two sampling numbers is called scheme A.
(a) (b)
Figure 6. (a) Received signal in τ-η plane and (b) image reconstructed with the proposed method under scheme A, Nr = 4,096, Na = 8,192.
(a) (b)
Figure 7. Image profiles along (a)xaxis and (b)y axis, extracted from Fig. 5(b) (−−−) and Fig. 6(b) (———).
(a) (b)
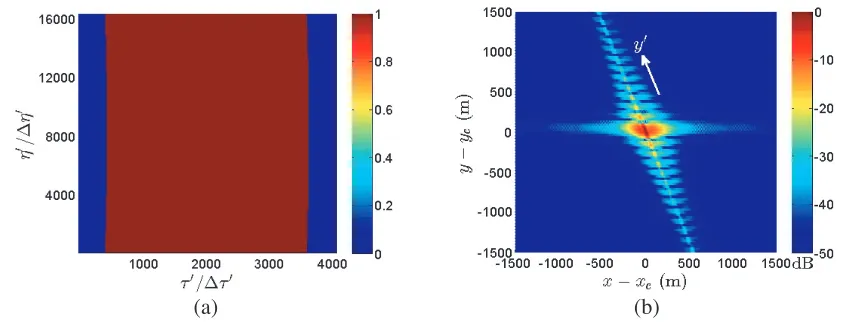
Figure 8. (a) Received signal inτ-η plane, and (b) image reconstructed with the proposed method under scheme B, Nr = 4,096, Na = 16,384.
A second set of sampling numbers, Nr = 4,096 and Na = 16,384, are chosen and called scheme B. The number of range samples is the same as that in scheme A, but that of the azimuth samples is doubled. The NOMs and memory required under scheme B is larger than that under scheme A because
Na of the former is twice that of the latter.
Figure 8(a) shows the received signal in theτ-η plane, computed by using Eq. (4), and Fig. 8(b) shows the image reconstructed with the proposed method. The number of range samples required by the proposed method is only a quarter that required by the conventional FDA. The number of azimuth samples applied in the proposed method is twice that of the conventional FDA. The reconstructed image appears to have finer spatial resolution in the y direction because the synthetic aperture length is doubled.
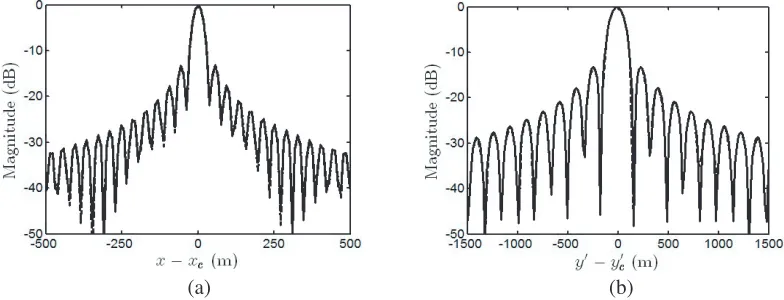
Figures 9(a) and 9(b) show the profiles alongxandy axes, respectively, extracted from the images shown in Figs. 5(b) and 8(b).
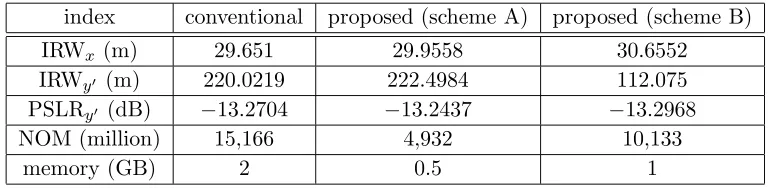
Table 4 lists the performance indices of the reconstructed images in eventE1. The spatial resolution
(a) (b)
Figure 9. Image profiles along (a)xaxis and (b)y axis, extracted from Fig. 5(b) (−−−) and Fig. 8(b) (———).
(a) (b)
Figure 10. (a) Received signal in τ-η plane and (b) image reconstructed with the conventional FDA,
Nr = 16,384, Na= 16,384.
B takes 205% of NOMs and twice memory as compared to the proposed method under scheme A. However, the former takes only 67% of NOMs and one half of memory as compared to the conventional FDA. The proposed method under scheme B turns out to perform better than the conventional FDA in all aspects, including the spatial resolution in y direction, NOMs and memory. The same approach is applied to the other extreme events (E2-E4), the results are similar to those in event E1 and hence
are not presented.
Table 4. Indices of reconstructed image in eventE1.
index conventional proposed (scheme A) proposed (scheme B)
IRWx (m) 29.651 29.9558 30.6552
IRWy (m) 220.0219 222.4984 112.075
PSLRy (dB) −13.2704 −13.2437 −13.2968
NOM (million) 15,166 4,932 10,133
(a) (b)
Figure 11. (a) Received signal inτ-η plane and (b) image reconstructed with the proposed method,
Nr = 8,192, Na = 16,384.
(a) (b)
Figure 12. Image profiles along (a) x axis and (b) y axis, extracted from Fig. 10(b) (− − −) and Fig. 11(b) (———).
4.2. Event E5
Figure 10(a) shows the received signal, computed by using Eq. (1), in the τ-η plane. Fig. 10(b) shows the image reconstructed with the conventional FDA, in which local maxima are observed along the x
and y axes.
Figure 11(a) shows the received signal in the τ-η plane, computed by using (4), and Fig. 11(b) shows the image reconstructed with the proposed method. The number of range samples is reduced to
Nr = 8,192, which is large enough to store the received baseband signal after rotation; and the number of azimuth samples remains as Na = 16,384.
Figures 12(a) and 12(b) show the profiles along x and y axes, respectively, extracted from the images shown in Figs. 10(b) and 11(b). The image reconstructed with the proposed method has similar quality to that with the conventional FDA because the lengths of synthetic aperture are similar.
Table 5 lists the performance indices of the reconstructed images in event E5. The images
reconstructed with the conventional FDA and the proposed method are similar. However, the proposed method takes only 66% of NOMs and one half memory as compared to the conventional FDA.
4.3. Event E6
Figure 13(a) shows the received signal, computed by using Eq. (1), in the τ-η plane. Fig. 13(b) shows the image reconstructed with the conventional FDA, in which local maxima are observed along x and
Table 5. Indices of reconstructed image in eventE5.
index conventional proposed
IRWx (m) 33.425 33.2845 PSLRx (dB) −13.0985 −13.1341
IRWy (m) 144.074 145.2704 PSLRy (dB) −13.2202 −13.2274 NOM (million) 31,407 20,803
memory (GB) 4 2
(a) (b)
Figure 13. (a) Received signal in τ-η plane and (b) image reconstructed with the conventional FDA,
Nr = 8,192, Na= 16,384.
Figures 14(a) and 14(b) show the profiles alongxandyaxes, respectively, extracted from the image shown in Fig. 13(b).
(a) (b)
Figure 14. Image profiles along (a) x axis and (b)y axis, extracted from Fig. 13(b).
Table 6 lists the performance indices of reconstructing image in event E6. The proposed method
Table 6. Indices of reconstructed image in eventE6.
index conventional
IRWx (m) 51.3879 PSLRx (dB) −13.2813
IRWy (m) 118.6994 PSLRy (dB) −13.2111 NOM (million) 15,167
memory (GB) 2
5. CONCLUSION
Two HEO satellites in a Tundra orbit are envisioned for SAR imaging, which are capable of providing a complete coverage over high-latitude areas. The received baseband signal is rotated in the time domain to significantly reduce the required memory storage. The conventional FDA is also modified to be compatible with the coordinate rotation. Six events with a wide range of squint angles are chosen to evaluate the efficacy of the proposed algorithms. The simulation results confirm the efficacy of the proposed method in terms of spatial resolution, computational load and memory size.
ACKNOWLEDGMENT
This work is partly sponsored by the Ministry of Science and Technology, Taiwan, R.O.C., under contract MOST 105-2221-E-002-035.
REFERENCES
1. Velde, R. V. D., M. S. Salama, O. A. Eweys, J. Wen, and Q. Wang, “Soil moisture mapping using combined active/passive microwave observations over the east of the Netherlands,”IEEE J. Select. Topics Appl. Earth Observ. Remote Sensing, Vol. 8, No. 9, 4355–4372, Sep. 2015.
2. Reiche, J., C. M. Souza, D. H. Hoekman, J. Verbesselt, H. Persaud, and M. Herold, “Feature level fusion of multi-temporal ALOS PALSAR and landsat data for mapping and monitoring of tropical deforestation and forest degradation,”IEEE J. Select. Topics Appl. Earth Observ. Remote Sensing, Vol. 6, No. 5, 2159–2173, Oct. 2013.
3. Lucas, R., et al., “An evaluation of the ALOS PALSAR L-band backscatter above ground biomass relationship Queensland, Australia: Impacts of surface moisture condition and vegetation structure,” IEEE J. Select. Topics Appl. Earth Observ. Remote Sensing, Vol. 3, No. 4, 576–595, Dec. 2010.
4. Zhao, B., Y. Han, W. Gao, Y. Luo, and X. Han, “A new imaging algorithm for geosynchronous SAR based on the fifth-order Doppler parameters,” Progress In Electromagnetics Research B, Vol. 55, 195–215, 2013.
5. Hu, C., Z. Liu, and T. Long, “An improved CS algorithm based on the curved trajectory in geosynchronous SAR,” IEEE J. Select. Topics Appl. Earth Observ. Remote Sensing, Vol. 5, No. 3, 795–808, Jun. 2012.
6. Li, D.-X., M.-Q. Wu, Z.-Y. Sun, F. He, and Z. Dong, “Modeling and processing of two-dimensional spatial-variant geosynchronous SAR data,” IEEE J. Select. Topics Appl. Earth Observ. Remote Sensing, Vol. 8, No. 8, 3999–4010, Aug. 2015.
8. Hu, C., T. Long, Z. Liu, T. Zeng, and Y. Tian, “An improved frequency domain focusing method in geosynchronous SAR,”IEEE Trans. Geosci. Remote Sensing, Vol. 52, No. 9, 5514–5528, Sep. 2014. 9. Ding, Z., B. Shu, W. Yin, T. Zeng, and T. Long, “A modified frequency domain algorithm based on optimal azimuth quadratic factor compensation for geosynchronous SAR imaging,” IEEE J. Select. Topics Appl. Earth Observ. Remote Sensing, Vol. 9, No. 3, 1119–1131, Mar. 2016.
10. Rodon, J. R., A. Broquetas, A. M. Guarnieri, and F. Rocca, “A Ku-band geosynchronous synthetic aperture radar mission analysis with medium transmitted power and medium-sized antenna,”IEEE Int. Geosci. Remote Sensing Symp., 2456–2459, Vancouver, BC, Canada, Jul. 2011.
11. Wood, L., Y. Lou, and O. Olusola, “Revisiting elliptical satellite orbits to enhance the O3b constellation,” https://arxiv.org/ftp/arxiv/papers /1407/1407.2521.pdf.
12. Ilcev, S. D., Global Mobile Satellite Communications for Maritime, Land and Aeronautical Applications, Springer, 2005.
13. Ilcev, S. D., “Highly elliptical orbits (HEO) for high latitudes and polar coverage,” IEEE Int. Crimean Conf. Microwave Telecom. Tech., 396–399, Sevastopol, Crimea, Ukraine, Sep. 2010. 14. Cavallaro, G., D. Pham-Minh, and M. Bousquet, “HEO constellation design for tactical
communications,”IEEE Euro. Conf. Satellite Telecom., Toulouse, France, Oct. 2012.
15. Tsimbal, M. and S. Panko, “Features of the HEO satellite communication systems,” IEEE Int. Siberian Conf. Control Commun., Omsk, Russia, May 2015.
16. AgrawaIt, B. N., “High latitude communications satellite,” http://digitalcommons.usu.edu /cgi/viewcontent.cgi article=2770 & context=smallsat.
![Figure 1 shows a flowchart of the proposed method for high-squint SAR imaging, which is similar to theconventional FDA [4], and the processes different from those in the latter are enclosed with parentheses.Finally, the processed signal is reversely rotated](https://thumb-us.123doks.com/thumbv2/123dok_us/1982728.1262047/2.612.259.357.264.437/owchart-proposed-theconventional-processes-dierent-parentheses-processed-reversely.webp)
![Table 1 lists the parameters of a Tundra orbit [12]. A constellation of two satellites are deployed todetect a point target specified in the Earth-centered Earth-fixed (ECEF) coordinate system](https://thumb-us.123doks.com/thumbv2/123dok_us/1982728.1262047/5.612.66.547.129.222/parameters-constellation-satellites-deployed-todetect-specied-centered-coordinate.webp)
![Table 2. Parameters of a SAR mission [4].](https://thumb-us.123doks.com/thumbv2/123dok_us/1982728.1262047/6.612.165.456.233.369/table-parameters-of-a-sar-mission.webp)