Relation between Bank Loans and Unemployment
in the European Countries
İSMET GÖÇER
Department of Economy and Finance Aydin Economy Faculty Adnan Menderes University, Aydin Turkey
Abstract:
In this study; relationship between total credit volume of the banking sector and unemployment in fourteen selected European Union countries was analyzed for the 1980-2012 period by means of panel data analysis method that takes into consideration structural breaks and cross-section dependence. In the result of the analysis it has been determined that credit increases has been reducing effect on the unemployment rate in these countries.
Key words: Bank Loans, Unemployment, Panel Data Analysis with Multiple Structural Breaks.
Jel Codes: E24, E58, G21.
1. Introduction
providing easy and cheap financing, and thus support new employment in the economies (Bernanke and Blinder 1992; Pojatina 2008). Rising in the credit volume of banking sector will increase investment and consumption expenditures and hence employment ratio will increase (Lipsey et al. 1994, 228). Consumer loans provided by the banking sector increase household consumption expenditures and encourage the firms for further production, investment and employment (Pagano and Pica 2012).
Banks support real sector by providing loans in terms of investment, production, economic growth and employment, especially in crisis periods. In this respect, there is a strong relationship between the real sector and the finance sector (Castillo 2009).
Expansionary monetary policies increase available loan volume, thus credit supply of the banks raise. Increased loan supply results in enhancing in investment and consumption expenditures of firms and thus total production level of firms increase, and new employment opportunities are created (Mishkin 1996). On the other hand, increases in microcredits used for the financing of small-scale enterprises reduce unemployment (Armendariz and Jonathan 2005) and increases the efficiency and volume of business of small enterprises (Robinson 2001).
Research on the relationship between credit volume and employment emphasize that these variables are generally correlated. Bernanke and Blinder (1992) tested the relationship between bank credits and unemployment ratio using 1959:01-1989:12 period data of the USA and concluded that the narrowing in credit volume increases unemployment ratio at the same time. Ordine and Rose (2008) tested the relationship between bank loans efficiency and employment for Italia and reported that a 10% increase in banking sector credit volume increased employment by 5%. Han (2009) analyzed the relationship between financial difficulties and unemployment for the USA and reported that the difficulties in accessing financial sources caused employment loss in the economy. Benmelech et al. (2010) found that there was a correlation between the unemployment and the difficulties in accessing credits in 1993-2009 period in the USA metropolitan cities. Pagano and Pica (2012) analyzed the relationship between employment and wages for 63 countries using the data of 1970-2003 period and found that the increase in credit volume positively affected employment, however didn’t have a significant impact on wages. Shabbir et al. (2012) analyzed the relationship between credit volume and employment for Pakistan using the data of 1973-2007 period with bounds testing approach and reported that 1% increase in credit volume reduced unemployment by 2.3%. Feldman (2012) analyzed the effects of bank loans in 53 countries for 1977-2005 period using two-stage generalized least squares method and found that a 1% increase in banking sector credit volume reduced unemployment in these countries by 2.94%.
situation increased the amount of unemployment compensation, on the other hand that disrupted budget balances and decelerates economic growth of countries. As the USA showed 2.2% growth in 2012, the economies of Greece, Portugal and Spain shrank by 6.4%, 3.2% and 1.7% respectively. Countries and international organizations still continue to find a solution to this problem.
It has been considered that the loans increases provided by the banking sector can be a policy proposal for unemployment because loans have a potential to stimulate domestic demand, to encourage investments and to create new employment opportunities (Saint-Paul 2007; Pagano and Pica 2012; Shabbir et al. 2012). In this study, the relationship between unemployment ratio and the credit volume was analyzed for fourteen EU countries1, whose unemployment
ratio higher than 10% in 2012, by using 1980-2012 period data via panel cointegration method that takes into consideration cross-sectional dependence and multiple structural breaks. The study uses a quite actual subject and analysis method; therefore it is expected to contribute to the literature.
2. Analysis
2.1. Data Set and Model
In this study, unemployment rate (UR) and domestic credit provided by banking sector credit volume (% of GDP) (CV) data at 1980-2012 period of fourteen EU countries were used. The data have been obtained from the IMF and the World Bank web sites. The following model was used in this study:
1 Bulgaria, Croatia, Cyprus, France, Greece, Hungary, Ireland, Italy, Latvia,
2.2. Cross-Section Dependence Test
Whether the cross-sectional dependence is taken into account or not significantly affects the results (Breusch and Pagan 1980; Pesaran 2004). Therefore, the presence of cross-section dependence in the series and cointegration equation should be tested before starting the analysis. This situation should be taken into consideration while selecting unit root and cointegration test methods. Otherwise, the analysis may give biased and inconsistent results (Pesaran et al. 2008).
The first studies to test the presence of cross-sectional dependence started with Berusch-Pagan (1980) CDLM (Cross-Sectional Dependence Lagrange Multiplier) test. However, this test is biased when group average is zero but individual averages are different from zero. Pesaran et al. (2008) adjusted this deviation by adding the variance and the average into test statistics. Therefore, the test is called adjusted CDLM test (CDLMadj). Null hypothesis of the test is; “There is no
cross-section dependence” (Pesaran, et al. 2008). In this study, the presence of cross-section dependence among the countries was tested by using CDLMadj test. The results are presented in
Table 1.
Table 1:CDLMadj Test Results
Test Statistics Probability Value
UR 5.164 0.000
CV 6.705 0.000
Cointegration Equation 10.031 0.000
stages of the analysis test methods based on cross-sectional dependence were used.
2.3. Panel Unit Root Test
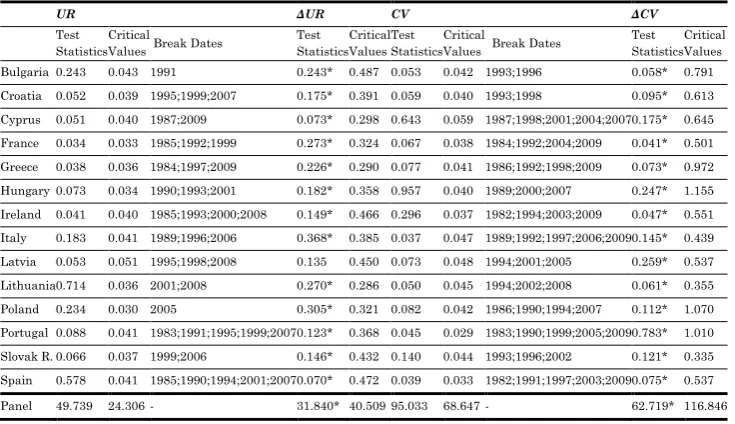
MADF (Taylor and Sarno 1998), SURADF (Breuer et al. 2002), Bai and Ng (2004) and CADF (Pesaran 2006a) can be listed among panel unit root tests that take into account cross-section dependence. However, these tests don’t take into consideration structural breaks in the series. When presence of the structural breaks in series, these methods give biased results (Charemza and Deadman 1997, 119). To eliminate this deficiency, Carrion-i-Silvestre et al. (2005) developed PANKPSS (Panel Kwiatkowski, Phillips, Schmidt and Shin) unit root test that takes into account cross-section dependence and up to five structural breaks in the series. Null hypothesis of the test is; “stationary”. Test statistics were compared with the critical values calculated by bootstrap. PANKPSS test was applied and results were presented in Table 2.
Table 2: PANKPSS Unit Root Test Results
UR ΔUR CV ΔCV
Test Statistics
Critical
Values Break Dates
Test Statistics
Critical Values
Test Statistics
Critical
Values Break Dates
Test Statistics
Critical Values Bulgaria 0.243 0.043 1991 0.243* 0.487 0.053 0.042 1993;1996 0.058* 0.791 Croatia 0.052 0.039 1995;1999;2007 0.175* 0.391 0.059 0.040 1993;1998 0.095* 0.613 Cyprus 0.051 0.040 1987;2009 0.073* 0.298 0.643 0.059 1987;1998;2001;2004;2007 0.175* 0.645 France 0.034 0.033 1985;1992;1999 0.273* 0.324 0.067 0.038 1984;1992;2004;2009 0.041* 0.501 Greece 0.038 0.036 1984;1997;2009 0.226* 0.290 0.077 0.041 1986;1992;1998;2009 0.073* 0.972 Hungary 0.073 0.034 1990;1993;2001 0.182* 0.358 0.957 0.040 1989;2000;2007 0.247* 1.155 Ireland 0.041 0.040 1985;1993;2000;2008 0.149* 0.466 0.296 0.037 1982;1994;2003;2009 0.047* 0.551 Italy 0.183 0.041 1989;1996;2006 0.368* 0.385 0.037 0.047 1989;1992;1997;2006;2009 0.145* 0.439 Latvia 0.053 0.051 1995;1998;2008 0.135 0.450 0.073 0.048 1994;2001;2005 0.259* 0.537 Lithuania 0.714 0.036 2001;2008 0.270* 0.286 0.050 0.045 1994;2002;2008 0.061* 0.355 Poland 0.234 0.030 2005 0.305* 0.321 0.082 0.042 1986;1990;1994;2007 0.112* 1.070 Portugal 0.088 0.041 1983;1991;1995;1999;2007 0.123* 0.368 0.045 0.029 1983;1990;1999;2005;2009 0.783* 1.010 Slovak R. 0.066 0.037 1999;2006 0.146* 0.432 0.140 0.044 1993;1996;2002 0.121* 0.335 Spain 0.578 0.041 1985;1990;1994;2001;2007 0.070* 0.472 0.039 0.033 1982;1991;1997;2003;2009 0.075* 0.537
Note: Critical values were obtained by using bootstrap for 1000 replications. *; express stationary at 5% significance level. Δ;express first difference. The model that allows for structural break in level and trend was selected as the test model.
According to the results in Table 2, reveals that the series non-stationary in levels and they became stationary when the first differences are taken. In this case, it was decided that the presence of cointegration relationship between the series can be tested. The test method successfully detected structural break dates in the countries. It points out to 1998 Russian crisis, 1999 transition to common monetary currency (Euro) in EU and 2008 global economic crisis.
2.4. Slope Homogeneity Test
The first studies to determine whether the slope coefficient is homogenous or not in cointegration equation were started with Swamy (1970) and developed by Pesaran and Yamagata (2008). Null hypothesis of the test is: “slope coefficients are homogenous”. Slope homogeneity test was conducted in the study and obtained results are presented in Table 3.
Table 3: Slope Homogeneity Test
Test Statistics Probability Value
0.939 0.174adj
0.983 0.163Note:
: test statistics of small samples,
adj: test statistics of largesamples.
2.5. Panel Cointegration Test with Multiple Structural Breaks
This test was developed by Basher and Westerlund (2009). It tests the presence of cointegration relationship between series in case of the presence cross-section dependence and structural breaks. Null hypothesis of the test is “cointegration”. Basher and Westerlund (2009) panel cointegration tests was performed and results are presented in Table 4.
Table 4: Panel Cointegration Test Results
Test Statistics Probability Value Decision
No breaks in
constant & trend 2.749 0.003 No Cointegration
Breaks in
constant & trend 10.157 0.585 Cointegration
Note: Critical values were obtained by using bootstrap for 1000 replications. The model that allows for structural break in stationary and trend were selected as the test model.
According to Table 4, when structural breaks are ignored, no cointegration relationship was identified between the series. However, when the structural breaks were taken into account, it was observed that cointegration relationship was identified between the series. Structural break dates obtained from cointegration analysis are presented in Table 5.
Table 5: Structural Break Dates
Country Break Dates Country Break Dates
Bulgaria 1991;2004 Italy 1992;2000
Croatia 1989;2005 Latvia 1995;2006
Cyprus 1987 Lithuania 1989
France 1985;1992;1999 Poland 1988;1999;2006
Greece 2004 Portugal 1988;1998
Hungary 1990;1987;2006 Slovak Rep. 1987;1998;2005
Structural break dates obtained from the cointegration analysis were added to the analysis with dummy variables in estimate cointegration coefficients.
2.6. Estimation to Cointegration Coefficients
Individual cointegration coefficients were estimated by using CCE (Common Correlated Effects) method developed by Pesaran (2006b). This method considers cross-section dependence. CCE is an estimator that can produce consistent results that provide asymptotic normal distribution when time dimension is smaller or greater than cross-section dimension and can calculate separate long-term balance values for cross-section units (Pesaran 2006b). Cointegration coefficient of the panel was estimated by using CCMGE (Common Correlated Mean Group Effects) method developed by Pesaran (2006b). The results are presented in Table 6.
Table 6: Cointegration Coefficients
Country CV D1 D2 D3
Bulgaria -0.053[-1.96]** -0.469[-0.54] 0.796[0.74] -
Croatia 0.009[0.40] 0.219[0.29] 0.88[3.53]*** -
Cyprus -0.006[-0.85] 0.95[2.50] - -
France -0.037[-1.60]*** 0.429[1.01] - -
Greece 0.086[1.53]*** 0.092[0.188] - -
Hungary 0.03[0.01] -0.459[-0.34] 1.565[1.41]* 1.575[1.27]
Ireland -0.188[-3.61]* -0.282[-0.112] - -
Italy 0.065[2.40]* -2.061[-3.90]*** -0.01[-0.021] -
Latvia -0.14[-4.0]* -3.524[-2.09]** -1.95[-1.01] -
Lithuania -0.019[-0.22] 0.504[0.676] - -
Poland -0.243[-2.38]* -4.05[-4.69]*** -4.561[-4.44]*** -6.882[-3.81]***
Portugal -0.011[-0.282] 1.63[1.88]** 1.31[0.97] -
Slovak R. -0.198[-3.24]* -1.37[-2.04]** -3.034[-2.48]*** 0.767[0.49]
Spain -0.209[-1.47]*** -0.363[-0.35] - -
Panel -0.064[-2.38]* -0.57[-1.42]* -0.36[-0.85] -0.31[-0.64]
The results in Table 6 show that the increases in credit volume of Bulgaria, France, Ireland, Latvia, Poland, Slovak Republic, Spain and the general of the panel had a reducing effect on unemployment and this effects were statistically significant. However, credit increases in Greece and Italy were found enhancing effects on unemployment.
2.7. The Error Correction Model
At this stage of the analysis, using one period lagged error correction terms (ECTt-1) and differenced series,
individual error correction model coefficients were estimated by CCE method and error correction model coefficients for the general of the panel were estimated by CCMGE. The results are presented in Table 7.
Table 7: Error Correction Model Coefficients
Country ΔCV ECTt-1 Country ΔCV ECTt-1
Bulgaria -0.035[-2.05]** -0.203[-1.82]** Italy -0.038[-2.71]* -0.097[-2.06]** Croatia -0.012[-0.57] -0.265[-2.52]* Latvia -0.085[-1.41]*** -0.357[-2.38]* Cyprus -0.004[-0.57] -0.073[-0.84] Lithuania 0.079[0.84] -0.205[-1.70]** France -0.018[-2.57]* -0.235[-3.26]* Poland 0.048[0.69] -0.306[-1.70]** Greece 0.023[1.15] -0.13[-1.10] Portugal 0.001[0.025] 0.033[0.50] Hungary 0.028[1.16] -0.006[-0.14] Slovak R. -0.089[-1.89]** 0.074[0.66] Ireland 0.02[1.05] 0.108[1.16] Spain 0.12[1.96]** 0.081[1.01] Panel -0.010[-0.79] -0.098[-2.58]*
Note:t statistics were calculated by using Newey-West standard errors. *, **, *** express 1%, 5% and 10% significance level respectively.
According to the results in Table 7, error correction term coefficients were negative and statistically significant in Bulgaria, Croatia, France, Italy, Latvia, Lithuania, Poland and panel. In other words, short run deviations converge to long run balance level. Error correction mechanism of the model operates. This indicates that cointegration coefficients estimation results are reliable.
3. Conclusion and Evaluation
countries by using 1980-2012 period data by means of panel cointegration method that takes into consideration cross-section dependence and multiple structural breaks.
Presence of cross-section dependence among the countries was analyzed by using CDLMadj. It was concluded
that cross-section dependence was present among these countries. Therefore, it was concluded that coming banking or employment shock in these countries, affects the other countries. That's why; it is believed that while countries making banking and employment policies, the developments in related countries should be taken into account in these countries. Stationary of the series was tested by PANKPSS method and it was observed that the series were non-stationary and that they became stationary when their first differences were taken. In this case, it was concluded that the presence of cointegration relationship between the series can be analyzed. Slope homogeneity test was used to analyze the homogeneity of cointegration coefficients. It was concluded that the coefficients were homogenous, in other words, cointegration interpretations for the general of the panel were reliable.
and CCMGE methods. It was observed that error correction term coefficients were negative and statistically significant in Bulgaria, Croatia, France, Italy, Latvia, Lithuania, Poland and the panel. In other words, the deviances that occur in the short-term are eliminated between the series and series converge to the long-term balance value. Error correction mechanism of the model operates efficiently. This also indicates that long-term analysis results are reliable.
In conclusion, it was observed that a 10% increase in credit volume decreased unemployment ratio by 0.64% in the general of the panel. This value is lower than expected and indicates that credit volumes in the mentioned countries have an insignificant effect on employment. One of the reasons might be liquidity trap, because the real interest rate in these countries decreased to the lowest possible levels. It becomes difficult to stimulate investments and total demand, revive the business life and reach full employment level by increasing the money supply in such economies which are in the liquidity trap. It might be considered as another reason that the labor-intensive production in the EU has been shifted to the Far East.
BIBLIOGRAPHY:
Acemoglu, D. 2001. “Credit Market Imperfections and Persistent Unemployment.” European Economic Review 45(4): 665-679.
Armendariz, B. A. and J. Morduch. 2005. The Economics of Microfinance. Massachusetts Institute of Technology, Massachusetts: The MIT Press.
Bai, Jushan and S. Ng. 2004. “A PANIC Attack on Unit Roots and Cointegration.” Econometrica 72(4): 1127-1177.
Basher, S. A. and J. Westerlund. 2009. “Panel Cointegration and the Monetary Exchange Rate Model.” Economic Modelling 26: 506-513.
Benmelech, E., N.K. Bergman, and A. Seru. 2011. “Finance and Unemployment.” NBER Working Paper, No. 17144.
Bernanke, B. and S.A. Blinder. 1992. “The Federal Funds Rate and the Channels of Monetary Transmission.” The American Economic Review 82(4): 901-921.
Breuer, J.B., R. Mcnown, and M. Wallace. 2002. “Series-Specific Unit Root Test with Panel Data.” Oxford Bulletin of Economics and Statistics 64(5): 527-546.
Breusch, T.S and A.R. Pagan. 1980. “The Lagrange Multiplier Test and Its Applications to Model Specification Tests in Econometrics.” Review of Economic Studies 47: 239-53.
Carrion-i-Silvestre, J.L., T.D. Barrio-Castro, and E. Lopez-Bazo. 2005. “Breaking the Panels: An Application to the GDP Per Capita.” Econometrics Journal 8:159-175.
Charemza, W.W. and D.F. Deadman. 1997. New Directions in Econometric Practice: General to Specific Modelling, Cointegration and Vector Autoregression. Second Edition Chelthenham: Edward Elgar Publishing.
Feldman, H. 2012. “Banking Deregulation around the World, 1970s to 2000s: The Impact on Unemployment.” International Review of Economics & Finance 24: 26-42.
Gatti, D., C. Rault, and A.G. Vaubourg. 2012. “Unemployment and Finance: How do Financial and Labour Market Factors Interact?” Oxford Economic Papers 64(3): 464-489.
Han, C.K. 2009. “Unemployment, Financial Hardship, and Savings in Individual Development Accounts.” Journal of Poverty 13(1): 74-95.
IMF. 2013. World Economic Outlook Database, April, http://www.imf.org/external/pubs/ft/weo/2013/01/weodata/weose lser.aspx.
Lakstutiene, A. R. Krusinskas, and J. Platenkoviene. 2011. “Economic Cycle and Credit Volume Interaction: Case of Lithuania.” Inzinerine Ekonomika-Engineering Economics 22(5): 468-476.
Lipsey, R.G., D.D. Purvis, P.N. Courant, and P.O. Steiner. 1994. Economics. 9th edition. Longman Higher Education.
Mishkin, F.S. 1996. “The Channels of Monetary Transmission: Lessons for Monetary Policy.” Banque de France Bulletin Digest 27: 33-44.
Ordine, P. and G. Rose. 2008. “Local Banks Efficiency and Employment.” Labour 22(3): 469-493.
Pagano, M. and G. Pica. 2012. “Finance and Employment.” Economic Policy 27(69): 5-55.
Pesaran, M.H. 2004. “General Diagnostic Tests for Cross Section Dependence in Panels.” Cambridge Working Papers in Economics No. 435.
Pesaran, M.H. 2006b. “Estimation and Inference in Large Heterogeneous Panels with a Multifactor Error Structure.” Econometrica 74(4): 967-1012.
Pesaran, M.H. and T. Yamagata. 2008. “Testing Slope Homogeneity in Large Panels.” Journal of Econometrics 142(1): 50-93.
Pesaran, M.H., A. Ullah, and T. Yamagata. 2008. “A Bias-Adjusted LM Test of Error Cross-Section Independence.” EconometricsJournal 11: 105-127.
Pojatina, K. 2008. “Credit Risk, Credit and Economic Cycles in Croatian Banking.” Economic Research 21(4): 19-33.
Robinson, M.S. 2001. The Micro Finance Revolution (Sustainable Finance for the Poor). The World Bank, Washington D.C.
Saint-Paul, G. 2007. “Alternative Strategies for Fighting Unemployment: Lessons from the European Experience.” IDEI Working Papers No. 446.
Shabbir, G., S. Anwar, Z. Hussain, and M. Imran. 2012. “Contribution of Financial Sector Development in Reducing Unemployment in Pakistan.” International Journal of Economics and Finance 4(1): 260-268.
Swamy, P.A.V.B. 1970. “Efficient Inference in a Random Coefficient Regression Model.” Econometrica 38(2): 311-323.
Taylor, M. and L. Sarno. 1998. “The Behavior of Real Exchange Rates during the Post-Bretton Woods Period.” Journal of International Economics 46: 281-312.
Wasmer, E. and P. Weil. 2004. “The Macroeconomics of Labor and Credit Market Imperfections.” American Economic Review 94(4): 944-963.