F U L L P A P E R
Open Access
Transition from continental collision to tectonic
escape? A geophysical perspective on lateral
expansion of the northern Tibetan Plateau
Yangfan Deng
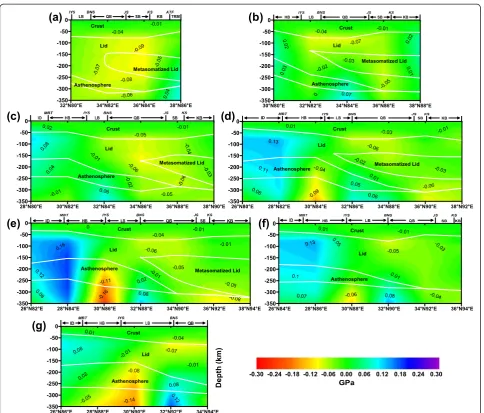
1,2*, Giuliano F Panza
3,4,5, Zhongjie Zhang
1, Fabio Romanelli
3,5, Ting Ma
1, Carlo Doglioni
6,
Peng Wang
2, Xuemei Zhang
1and Jiwen Teng
1Abstract
A number of tectonic models have been proposed for the Tibetan Plateau, which origin, however, remains poorly understood. In this study, investigations of the shear wave velocity (Vs) and density (ρ) structures of the crust and upper mantle evidenced three remarkable features: (1) There are variations in Vs andρof the metasomatic mantle wedge in the hanging wall of the subduction beneath different tectonic blocks of Tibet, which may be inferred as related to the dehydration of the downgoing slab. (2) Sections depicting gravitational potential energy suggest that the subducted lithosphere is less dense than the ambient rocks, and thus, being buoyant, it cannot be driven by gravitational slab pull. The subduction process can be inferred by the faster SW-ward motion of Eurasia relative to India as indicated by the plate motions relative to the mantle. An opposite NE-ward mantle flow can be inferred beneath the Himalaya system, deviating E and SE-ward toward China along the tectonic equator. (3) The variation in the thickness of the metasomatic mantle wedge suggests that the leading edge of the subducting Indian slab reaches the Bangoin-Nujiang suture (BNS), and the metasomatic mantle wedge overlaps with a region with poor Sn-wave propagation in north Tibet. The metasomatic layer, north of the BNS, deforms in the E-W direction to accommodate lithosphere shortening in south Tibet.
Keywords:Tibetan plateau; Continental collision; System transition; Net rotation of the lithosphere
Background
The Tibetan Plateau is the highest (with an average altitude of 4,000 m) and largest (with an area of about 2.5 Mkm2) plateau on the earth (Yin and Harrison 2000; England and Houseman 1988). The crustal thickening and uplift history of the Tibetan Plateau is fairly well understood (due to the efforts of multi-disciplinary international programs con-ducted during the last century) as its crustal thickness is twice the normal crustal thickness and it has shown uplift since the early Cenozoic time (Hirn et al. 1984; Dewey et al. 1988; Nelson et al. 1996; Searle 1996; Zhao et al. 2001; Kind et al. 2002; Shapiro et al. 2004; Andronicos et al. 2007; Nábělek et al. 2009; Kind and Yuan 2010; Carosi et al. 2013; and references therein). However, the
plateau's growth mechanism is still unclear (Tapponnier et al. 2001) despite the proposal of the tectonic escape and lower crustal flow models to explain the plateau growth (Royden et al. 1997; Beaumont et al. 2001, 2004). GPS mea-surements show a N-S convergence rate across the plateau of 1 to 2 cm/yr, and a W-E extension rate of about 1 to 2 cm/yr (Gan et al. 2007). The mechanism producing such a tectonic system transition from N-S convergence (south of the BNS) to W-E escape (north of the BNS) (Figure 1) is still unknown. Tectonic escape and gravitational collapse have been proposed to explain the mechanism underlying this transition (Peltzer and Tapponnier 1988; Peltzer and Saucier 1996; Burchfiel and Royden 1985; Coleman and Hodges 1995). However, gravitational collapse could only explain the temporal tectonic system transition from compression to ex-tension, but it fails to explain the tectonic transition across the BNS. Moreover, the tectonic escape mechanism still does not consider the constraints arising from the deep structure of the crust and upper mantle, and the net rotation of the lithosphere. The S-wave velocity (Vs) and density (ρ)
* Correspondence:[email protected] 1
State Key Laboratory of Lithospheric Evolution, Institute of Geology and Geophysics, Chinese Academy of Sciences, Beijing 100029, China
2
Guangzhou Institute of Geochemistry, Chinese Academy of Sciences, Guangzhou 510640, China
Full list of author information is available at the end of the article
can aid in the understanding of the thermal and compos-itional contribution to the deformation process. Here, we in-corporate both the Vs structure from surface wave tomography and ρ structure from gravity inversion to the depth of 350 km, and we obtain the gravitational potential energy of the plateau (Zhang et al. 2007; Zhang 2010; Zhang et al. 2014). Our results, which are the outcome of a specific synthesis based on the review paper by Zhang et al. (2014), suggest that the study of the SW-ward decoupling of the lithosphere relative to the mantle in the framework of the net rotation, also called "westward" drift of the lithosphere (Crespi et al. 2007) may contribute to the understanding of the geodynamics of the study area. A relative NE-ward mantle flow sustains the Indian slab and the overlying oro-gen. We also discuss the dehydration of the downgoing slab and the metasomatism of the mantle wedge, which may en-hance decoupling of the overlying plate. Further, (we specu-late that) the dehydration provides a source to melt the underlying lithospheric mantle to strongly attenuate Sn propagation.
Methods
Structural modeling from seismological tomography and gravity inversion
Based on the Rayleigh wave dispersion analysis, Zhang (2010) studied the three-dimensional (3D) velocity structure of the lithosphere-asthenosphere system (including that of
the crust) in the Qinghai-Tibet Plateau and its adjacent areas (see also Zhang et al. 2014). With the purpose of construct-ing a robust inversion of the data, we used the program li-brary GRAV3D, which is a suite of algorithms for inverting gravity data gathered over a 3D construction of the earth (Li and Oldenburg 1996, 1998). The subsurface volume is modeled as a set of cuboidal elements each withρ contrast. The inverse problem involves estimat-ing the ρ contrasts of all the cuboidal elements based upon the available measurements of the Bouguer anomal-ies, and the inverse problem is solved as an optimization problem with the simultaneous goals of (1) minimizing the objective function on the model and (2) generating synthetic data that match observations to within a degree of misfit consistent with the statistics of the available data. The definition of length scales for smoothness controls the degree to which either of these two goals dominates. This is a crucial step that allows the user to incorporatea priori geophysical or geological information into the inversion. Explicita prioriinformation may also take the form of the upper and lower bounds on theρcontrast in any element.
This approach has been extensively applied to upper crustal problems; however, applications to the lower crust and upper mantle have been limited (e.g., Brandmayr et al. 2011; Welford and Hall 2007; Welford et al. 2010). Re-fined mesh design and sensible regularization procedures permit reasonable resolution of the Moho surface, whilst
70˚ 70˚
75˚ 75˚
80˚ 80˚
85˚ 85˚
90˚ 90˚
95˚ 95˚
100˚ 100˚
105˚ 105˚
110˚ 110˚
20˚ 20˚
25˚ 25˚
30˚ 30˚
35˚ 35˚
40˚ 40˚
45˚ 45˚
0 1000 2000 3000 4000 5000 6000
IYS BNS
JS AKMS
SQS
HB LB
QB SB
Tarim Craton
Qaidam
Yangtze Craton North China Craton
Indian Craton
20 mm/year
N
KB QL
Elevation (m)
allowing variations within the crust and mantle to be modeled as part of the same procedure (Welford and Hall 2007; Welford et al. 2010). The full 3D nature of this ap-proach, along with the requirement of a large number of cells in the vertical direction, means that this method is more computationally demanding compared to other methods. Therefore, it is natural to use the reliable part of the crustal inversion as a constraint for the inversion in-volving the mantle down to 350 km (e.g., see Mueller and Panza 1986). To obtain the 3Dρ structure, we first con-structed ana prioriρmodel by using a literature conver-sion relation between Vs and ρ (Feng et al. 1986; Zhao et al. 2004; Deng et al. 2013) for the crust and PREM model (Dziewonski and Anderson 1981) for the upper mantle to a depth of 350 km. Subsequently, we applied a perturbation to the model in order to not only match the observed Bouguer gravity, but also to match the range of ρ since we use the range of Vs as the limiting condition (the Vs model is defined with its uncertainty range).
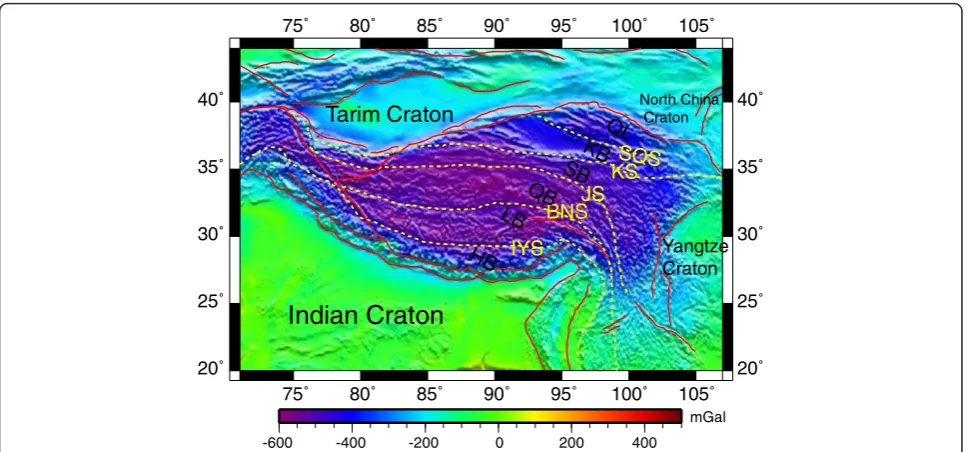
The Bouguer gravity data (Figure 2) is obtained from the EGM2008 (Pavlis et al. 2012), which provides a 2.5′× 2.5′ grid on both land and ocean. The EGM2008 is formed by merging terrestrial, altimetry-derived, and airborne gravity data, wherein the data standard deviations are less than 10 mGal (Pavlis et al. 2008). Most of Tibet has a negative Bouguer anomaly (up to−600 mGal). The Tarim and Yangtze cratons have negative Bouguer anomalies, al-though smaller in absolute value than that of Tibet, and the anomaly in the Indian Craton is slightly positive.
Next, we discuss the ρ and Vs structures across the
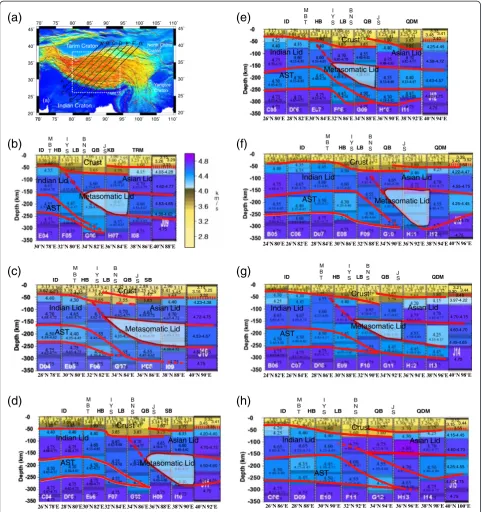
main tectonic blocks in the Tibetan Plateau. Figure 3
shows the spatial distribution of the Vs structure along seven sections, A-A′, B-B′, C-C′, D-D′, E-E′, F-F′and G-G′, partly reproducing the results by Zhang et al. (2014), which have been extended here for an optimal il-lustration of the process from continental collision to tectonic escape. These sections are trending NE-SW; such a choice is in agreement not only with the principle to consider sections orthogonal to the main features, but it also follows the trend of the tectonic equator (TE) and of the TE-perturbed (Panza et al. 2010). The TE represents the tectonic mainstream, starting from the Pacific motion direction and linking all the other relative motions in a glo-bal circuit using first-order tectonic features such as the East Pacific Rise, the Atlantic rift, the Red Sea, the Indian Ocean rift for the rift zones, and the west Pacific subduc-tion, the Andean subducsubduc-tion, and the Zagros-Himalayas subduction for convergent margins (Crespi et al. 2007). The TE is the great circle along which plates move over the earth's surface with the fastest mean angular velocity toward the west relative to the mantle (Crespi et al. 2007). Consistently, with the present-day Vs resolution, the TE-perturbed (which is not a great circle) describes the trajec-tory along which a global circuit, formed by a ubiquitous low-velocity zone (LVZ) about 1,000-km wide and about 100-km thick, occurs in the asthenosphere, wherein the most mobile mantle LVZ is located. The existence of a continuous global flow within the earth is thus confirmed by the existence of the TE-perturbed (Panza et al. 2010).
In all the sections considered, the upper part with Vs < 4.0 km/s and density < 2.90 g/cm3 is interpreted as the crust. The portion underlying the crust, with Vs values in the range from 4.4 to 4.65 km/s and density
75˚ 75˚
80˚ 80˚
85˚ 85˚
90˚ 90˚
95˚ 95˚
100˚ 100˚
105˚ 105˚
20˚ 20˚
25˚ 25˚
30˚ 30˚
35˚ 35˚
40˚ 40˚
-600 -400 -200 0 200 400
Tarim Craton
IYS
BNSJS
KSSQS
Yangtze Craton
North China Craton
QL
LB
HB
SB QB
KB
Indian Craton
mGal
in the range from 3.2 to 3.37 g/cm3 is interpreted as the mantle lid, and the portion with Vs < 4.5 km/s and
density 3.35 to 3.45 g/cm3 underlying the mantle lid
is interpreted as the LVZ at the top of the astheno-sphere. In the hanging wall of the subduction zone, within the LVZ, the portion with Vs < 4.45 km/s is
interpreted as the metasomatic mantle wedge, wherein the fluids delivered by the slab contribute to decrease in ri-gidity (Doglioni et al. 2009). With these definitions, we constructed the conceptual sections with the red lines in Figures 3b,c,d,e,f,g,h, 4a,b,c,d,e,f,g and white lines in Figure 6a,b,c,d,e,f,g.
Indian Lid Asian Lid
Crust
Indian Lid Asian Lid
4.75
Indian Lid Asian Lid
Metasomatic Lid
Indian Lid Asian Lid
Metasomatic Lid
Indian Lid Asian Lid
Metasomatic Lid
Indian Lid Asian Lid
Metasomatic Lid
Indian Lid Asian Lid
Metasomatic Lid
In section A-A′ (Figure 3b), the crust thickens grad-ually from about 40 km south of the Main Boundary Thrust (MBT) to about 80 km beneath the boundary
between Tibet and the Tarim Basin. A very interesting feature is the thinning of the asthenosphere layer from about 80 to 90 km south of the Jinshajiang suture 2.5 5
(abbreviated as JS in Figure 2 and hereafter), while, northward, the metasomatic lid appears and thickens up to 100 km beneath the north segment of the section.
Along section B-B′(in Figure 3c), the crust and mantle structures are similar to those seen in section A-A′. The major difference between these two sections is the Moho depth, as beneath JS, an abrupt change appears in the Moho depth (Figure 3c).
Along section C-C′(Figure 3d), the pattern of the crustal thickness is very different from that along sections A-A′
and B-B′since the crustal thickness is relatively constant between the IYS and the north of the JS (Figure 3d). Along C-C′, the asthenosphere thins northward at the IYS while it exhibits a constant thickness to the south, and the meta-somatic lid (and mantle wedge) begins to exist between the BNS and JS (the boundary between the south and north sections of the Qiangtang Block). The crustal structure be-neath section D-D′is similar to that of section C-C′, but the metasomatic lid appears south of the BNS in section D-D′(Figure 3e). Along section E-E′(Figure 3f), south of
-800 -600 -400 -200 0 mGal
observed predicted
32N80E 34N82E 36N84E 38N86E -80 -60 -40 -20 0 20 40 60 80 mGal 0
10 20 30 40 50
fre
quen
cy
-800 -600 -400 -200 0 mGal
observed predicted
30N80E 32N82E 34N84E 36N86E 38N88E -80 -60 -40 -20 0 20 40 60 80 mGal 0
10 20 30 40 50
fr
eque
ncy
-800 -600 -400 -200 0 mGal
observed predicted
28N80E 30N82E 32N84E 34N86E 36N88E 38N90E -80 -60 -40 -20 0 20 40 60 80 mGal 0
10 20 30 40 50
frequency
-800 -600 -400 -200 0 mGal
observed predicted
26N80E 28N82E 30N84E 32N86E 34N88E 36N90E 38N92E -80 -60 -40 -20 0 20 40 60 80 mGal 0
10 20 30 40 50
freq
uenc
y
-800 -600 -400 -200 0 mGal
observed predicted
26N82E 28N84E 30N86E 32N88E 34N90E 36N92E 38N94E -80 -60 -40 -20 0 20 40 60 80 mGal 0
10 20 30 40 50
freq
uency
-800 -600 -400 -200 0 mGal
observed predicted
26N84E 28N86E 30N88E 32N90E 34N92E 36N94E -80 -60 -40 -20 0 20 40 60 80 mGal 0
10 20 30 40 50
fr
eq
uency
-800 -600 -400 -200 0 mGal
observed predicted
-80 -60 -40 -20 0 20 40 60 80 mGal 0
10 20 30 40 50
fre
quenc
y
(a)
(b)
(c)
(d)
(e)
(f)
(g)
26N86E 28N88E 30N90E 32N92E 34N94E
the JS, an abrupt change appears in the Moho depth, and the metasomatic lid begins to appear beneath the boundary between south and north Qiangtang. Along section F-F′ (Figure 3g), the abrupt change appears in the Moho depth beneath the boundary between the southern and northern sections of the Qiangtang Block, and the size of the metasomatic lid is significantly reduced with respect to that shown in the previous sections. A simi-lar situation is seen along section G-G′ (Figure 3h), even if the metasomatic lid has almost ceased to exist (Figure 3h).
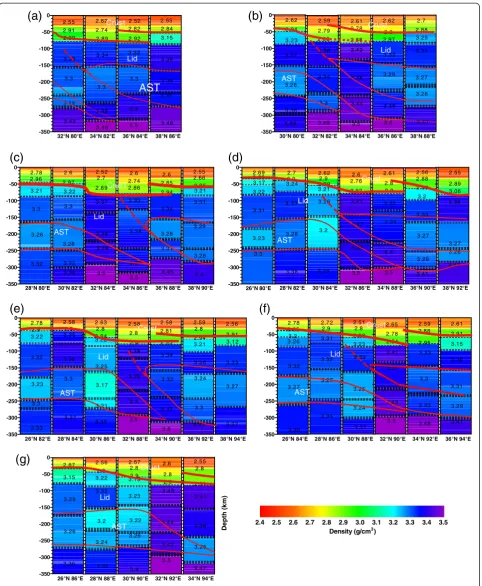
Figure 4 shows distinctive patterns in the density differences between the south and north sections of
the BNS. Along profiles A-A′ (Figure 4a) and B-B′
(Figure 4b), ρ ranges from 2.4 to 2.9 g/cm3 in the
crust, and the layer withρin the range of 2.8 to 2.9 g/cm3
thickens to about 70 km to the north (to about 30°N). These results may be consistent with the speculation that the crust of the Indian Plate penetrated the whole of the Tibetan Plateau in west Tibet (Li et al.
2008; Zhou and Murphy 2005). Along transects C-C′
(Figure 4c), D-D′(Figure 4d), and (E-E′) (Figure 4e), we clearly observe that the convergence between the Indian and Eurasian plates thickens the crust. These results suggest that the leading edge of the injected Indian crust may be located along the BNS in east Tibet (Zhang et al. 2011).
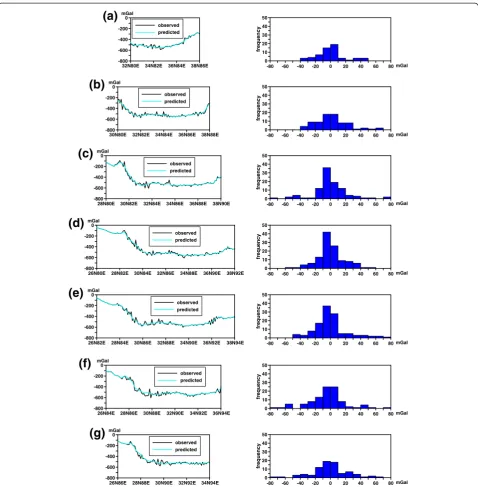
Figure 5 illustrates the misfit between the observed and the computed Bouguer gravity anomalies along the seven profiles. The misfit is within 40 mGal beneath most transects. (For more details, see Zhang et al. 2014).
Gravitational potential energy structure
From the 3D density structure beneath the Tibetan Plateau, a 3D gravitational potential energy (GPE =ρgz, whereρ de-notes the density, g denotes the gravitational acceleration, assumed to be equal to 9.81 m/s2, andzdenotes the depth) map can be constructed (Haines et al. 2003; Zhang and Klemperer 2005; Zhang et al. 2014). The GPE difference with respect to the average GPE to the depth of 350 km under the Tibetan Plateau along the seven sections, A-A, B-B, C-C, D-D, E-E, F-F, and G-G, is shown in Figure 6. Along most of these NE-SW sections not only the distribu-tion in space of Vs andρbut also that of the GPE difference evidence that, in some instances, the subducted lithosphere is less dense than the ambient rocks, and thus, the lithosphere cannot be driven by its negative buoyancy (i.e., slab pull). Therefore, the subduction process re-quires the presence of another dynamical force that is able to drag the upper plate lithosphere over the In-dian plate. Possible alternative mechanisms are dis-cussed by Riguzzi et al. (2010). These observations highlight that the top asthenosphere (LVZ) acts as the lithosphere base decoupling, and the underlying mantle should flow NE-ward to SE-ward along the tectonic mainstream (see Crespi et al. 2007; Panza et al. 2010).
Results and discussion
Figure 7 displays the geometry of the metasomatic lid. The GPE sections suggest that mantle flow contributes to the Indian plate subduction as far as the BNS. The spatial distribution of the metasomatic mantle wedge (both Lid and LVZ) may have lubricated the decoupling layer at the base of the Asia plate (Doglioni et al. 2009), thereby facilitating its SW-ward motion, which can be identified in the plate motion models relative to the hot-spot reference frame (Crespi et al. 2007).
The collision of the Indian and Asian plates is accom-panied by a low convergence-shortening ratio (about 1.2) since the convergence is partitioned both in the sub-duction and shortening, and the subsub-duction is relatively slower than the ongoing contraction in the upper and lower plates (Doglioni et al. 2007; Gong and Chen 2014). This type of setting wherein the subduction hinge con-verges relative to the upper plate generates a forebelt synthetic to the subduction and a conjugate retrobelt (Doglioni et al. 2007). The Himalayan orogeny repre-sents the coalescence of several oceanic and continental subduction zones (e.g., Yin and Harrison 2000), and the Tibetan Plateau is the area separating the active forebelt and the retrobelt, where the uplift is constrained by the isostatic readjustment due to either the convective re-moval of the lithosphere or the achieved critical taper of the orogenic wedge whose mechanical evolution needs to occur laterally (e.g., Molnar et al. 1993; Dahlen 1990). The direction of the Himalaya subduction is along the trend of the tectonic equator that deviates from NE to SE moving from India to China as indicated both by plate motions in the last 50 Ma and the GPS data in the no-net rotation and net rotation reference frames (Crespi et al. 2007). Therefore, the W-E extension in the Tibetan Plateau is compatible with the global flow of plates, and it may be related to the back-arc exten-sion operating along the western margin of the Pacific realm and not necessarily to tectonic escape.
Conclusion
The investigations of the seismic velocity and the density structures support the subduction of the Indian litho-sphere, dragged NE-ward by the mantle flow. The slab should contribute to the metasomatism of the overlying mantle wedge (Lid and LVZ) north of the BNS.
70˚ 70˚
75˚ 75˚
80˚ 80˚
85˚ 85˚
90˚ 90˚
95˚ 95˚
100˚ 100˚
105˚ 105˚
110˚ 110˚
20˚ 20˚
25˚ 25˚
30˚ 30˚
35˚ 35˚
40˚ 40˚
45˚ 45˚
Tarim Craton
Yangtze Craton North China Craton
Indian Craton
Metasomatized Lid Poor Sn zone
Competing interests
The authors declare that they have no competing interests.
Authors' contributions
YD, GP, ZZ, and CD developed the main framework. All authors carried out the theoretical considerations and read and approved the final manuscript.
Acknowledgements
We would like to thank Gan, WJ, for providing the GPS data. The Strategic Priority Research Program (B) of the Chinese Academy of Sciences (Grant No. XDB03010700) and the National Natural Science Foundation of China (41021063, 41374064) supported this research. We also acknowledge support from the Italian PRIN projects 2008, 2011, PNRA projects 2004/2.7-2.8, 2009/A2.17.
Author details
1
State Key Laboratory of Lithospheric Evolution, Institute of Geology and Geophysics, Chinese Academy of Sciences, Beijing 100029, China.
2
Guangzhou Institute of Geochemistry, Chinese Academy of Sciences, Guangzhou 510640, China.3Department of Mathematics and Geosciences,
University of Trieste, Via Weiss, I-34127 Trieste, Italy.4Institute of Geophysics, China Earthquake Administration, Beijing 100080, China.5International Centre
for Theoretical Physics, SAND group, I-34151 Trieste, Italy.6Department of Earth Sciences, La Sapienza, University of Roma, Roma, Italy.
Received: 4 November 2013 Accepted: 25 March 2014 Published: 16 April 2014
References
Andronicos CL, Velasco AA, Hurtado JM (2007) Large-scale deformation in the India-Asia collision constrained by earthquakes and topography. Terra Nova 19(2):105–119
Beaumont C, Jamieson RA, Nguyen MH, Lee B (2001) Mid-crustal channel flow in large hot orogens: results from coupled thermal-mechanical models. In: Cook F, Erdmer P (eds) Slave-Northern Cordillera Lithospheric Evolution (SNORCLE) and Cordilleran Tectonics Workshop; Report of 2001 Combined Meeting, Lithoprobe Rep. 79, Compiled. Lithoprobe Secretariat, Univ, B. C, Vancouver, pp 112–170
Beaumont C, Jamieson RA, Nguyen MH, Medvedev S (2004) Crustal channel flows: 1. Numerical models with applications to the tectonics of the Himalayan–Tibetan orogen. J Geophys Res 109, B06406
Brandmayr E, Marson I, Romanelli F, Panza GF (2011) Lithosphere density model in Italy: no hint for slab pull. Terra Nova 23:292–299
Burchfiel B, Royden LH (1985) North–south extension within the convergent Himalayan region. Geology 13(10):679–682
Carosi R, Montomoli C, Rubatto D, Visonà D (2013) Leucogranite intruding the South Tibetan detachment in western Nepal: implications for exhumation models in the Himalayas. Terra Nova 25(6):478–489
Coleman M, Hodges K (1995) Evidence for Tibetan plateau uplift before 14 Myr ago from a new minimum age for east–west extension. Nature 374 (6517):49–52
Crespi M, Cuffaro M, Doglioni C, Giannone F, Riguzzi F (2007) Space geodesy validation of the global lithospheric flow. Geophys J Int 168:491–506, 10.1111/j.1365-246X.2006.03226.x
Dahlen FA (1990) Critical taper model of fold-and-thrust belts and accretionary wedges. Annu Rev Earth Planet Sci 18:55–99
Deng Y, Zhang Z, Badal J, Fan W (2013) 3-D density structure under South China constrained by seismic velocity and gravity data. Tectonophysics, http://dx. doi.org/10.1016/j.tecto.2013.07.032
Dewey JF, Shackleton RM, Chang CF, Sun YY (1988) The tectonic evolution of the Tibetan plateau. Philos Trans R Soc London, Ser A 327:379–413
Doglioni C, Carminati E, Cuffaro M, Scrocca D (2007) Subduction kinematics and dynamic constraints. Earth Sci Rev 83:125–175, 10.1016/j.earscirev.2007.04.001 Doglioni C, Tonarini S, Innocenti F (2009) Mantle wedge asymmetries and
geochemical signatures along W-and E–NE-directed subduction zones. Lithos 113(1):179–189
Dziewonski AM, Anderson DL (1981) Preliminary reference earth model. Phys Earth Planet Inter 25(4):297–356
England P, Houseman G (1988) The mechanics of the Tibetan plateau. Phil Trans R Soc Lond A327:379–413
Feng R, Yan HF, Zhang RS (1986) Fast inversion method and corresponding programming for 3D potential field. Acta Geol Sin 4(3):390–402, in Chinese with English abstract
Gan W, Zhang P, Shen ZK, Niu Z, Wang M, Wan Y, Zhou D, Cheng J (2007) Present-day crustal motion within the Tibetan Plateau inferred from GPS measurements. J Geophys Res 112(B8), B08416. doi:10.1029/2004JB003139 Gong J, Chen YJ (2014) Evidence of lateral asthenosphere flow beneath the
South China craton driven by both Pacific plate subduction and the India–Eurasia continental collision. Terra Nova 26(1):55–63
Haines SS, Klemperer SL, Brown L, Jingru G, Mechie J, Meissner R, Ross A, Wenjin Z (2003) INDEPTH III seismic data: from surface observations to deep crustal processes in Tibet. Tectonics 22(1):1001
Hirn A, Lépine JC, Jobert M, Jobert G, Xu ZX, Gao EY, Yuan LD, Teng JW (1984) Crustal structure and variability of the Himalayan border of Tibet. Nature 307:23–25
Kind R, Yuan X (2010) Seismic images of the biggest crash on earth. Science 329 (5998):1479–1480
Kind R, Yuan X, Saul J, Nelson D, Sobolev SV, Mechie J, Zhao W, Kosarev G, Ni J, Achauer U, Jiang M (2002) Seismic images of crust and upper mantle beneath Tibet: evidence for Eurasian plate subduction. Science 298 (5596):1219–1221
Li Y, Oldenburg DW (1996) 3-D inversion of magnetic data. Geophysics 61:394–408 Li Y, Oldenburg DW (1998) 3D inversion of gravity data. Geophysics 63:109–119 Li C, Van der Hilst RD, Meltzer AS, Engdahl ER (2008) Subduction of the Indian
lithosphere beneath the Tibetan Plateau and Burma. Earth Planet Sci Lett 274 (1):157–168
Molnar P, England P, Martinod J (1993) Mantle dynamics, uplift of the Tibetan Plateau and the Indian Monsoon. Rev Geophys 31:357–396
Mueller S, Panza GF (1986) Evidence of a deep-reaching lithospheric root under the Alpine arc. In: Wezel FC (ed) The Origin of Arcs, 21st edn. Elsevier, Amsterdam, pp 93–113
Nábělek J, Hetényi G, Vergne J, Sapkota S, Kafle B, Jiang M, Su H, Chen J, Huang BS (2009) Underplating in the Himalaya-Tibet collision zone revealed by the Hi-CLIMB experiment. Science 325(5946):1371–1374
Nelson KD, Zhao W, Brown L, Kuo J, Che J, Liu X, Klemperer S, Makovsky Y, Meissner R, Mechie J (1996) Partially molten middle crust beneath Southern Tibet: synthesis of project INDEPTH results. Science 274:1684–1688 Ni J, Barazangi M (1983) High-frequency seismic wave propagation beneath the
Indian shield, Himalayan arc, Tibetan plateau and surrounding regions: high uppermost mantle velocities and efficient Sn propagation beneath Tibet. Geophys J Int 72(3):665–689
Panza GF, Doglioni C, Levshin A (2010) Asymmetric ocean basins. Geology 38 (1):59–62
Pavlis NK, Holmes SA, Kenyon SC, Factor JK (2008) An earth gravitational model to degree 2160: EGM 2008, Paper presented at the 2008 General Assembly of the European Geosciences Union, Vienna, 13-18 April
Pavlis NK, Holmes SA, Kenyon SC, Factor JK (2012) The development and evaluation of the Earth Gravitational Model 2008 (EGM2008). J Geophys Res 117(B4), B04406
Peltzer G, Saucier F (1996) Present day kinematics of Asia derived from geologic fault rates. J Geophys Res 101:27943–27956
Peltzer G, Tapponnier P (1988) Formation and evolution of strike–slip faults, rifts, and basins during the India–Asia collision: an experimental approach. J Geophys Res 93:15085–15117
Riguzzi F, Panza G, Varga P, Doglioni C (2010) Can Earth's rotation and tidal despinning drive plate tectonics? Tectonophysics 484:60–73, 10.1016/j. tecto.2009.06.012
Royden LH, Burchfiel BC, King RW, Wang E, Chen Z, Shen F, Liu Y (1997) Surface deformation and lower crustal flow in eastern Tibet. Science 276:788–790 Searle MP (1996) Cooling history, erosion, exhumation, and kinematics of the
Himalaya- Karakoram-Tibet Orogenic Belt. In: Yin A, Harrison TM (eds) The tectonic evolution of Asia. Cambridge Univ Press, New York, pp 110–137 Shapiro NM, Ritzwoller MK, Molnar P, Levin V (2004) Thinning and flow of Tibetan
crust constrained by seismic anisotropy. Science 305:233–236 Tapponnier P, Xu Z, Roger F, Meyer B, Arnaud N, Wittlinger G, Yang J (2001)
Oblique stepwise rise and growth of the Tibet plateau. Science 294:1671–1677 Welford JK, Hall J (2007) Crustal structure of the Newfoundland rifted continental
Yin A, Harrison TM (2000) Geologic evolution of the Himalayan-Tibetan orogen. Annu Rev Earth Planet Sci 28(1):211–280
Zhang XM (2010) The structural model of the Lithosphere-asthenosphere System in the Qinghai-Tibet Plateau and its adjacent areas from surface wave tomography, PhD Dissertation. University of Trieste, Trieste, Italy Zhang Z, Klemperer SL (2005) West-east variation in crustal thickness in northern
Lhasa block, central Tibet, from deep seismic sounding data. J Geophys Res 110(B9), B09403, 10.1029/2004JB003139
Zhang XM, Sun R, Teng J (2007) Study on crustal, lithospheric and
asthenospheric thickness beneath the Qinghai-Tibet Plateau and its adjacent areas. Chin Sci Bull 52(6):797–804
Zhang Z, Deng Y, Teng J, Wang C, Gao R, Chen Y, Fan W (2011) An overview of the crustal structure of the Tibetan plateau after 35 years of deep seismic soundings. J Asian Earth Sci 40(4):977–989
Zhang ZJ, Teng JW, Romanelli F, Braitenberg C, Ding ZF, Zhang SF, Zhang XM, Fang LH, Wu JP, Deng YF, Ma T, Sun RM, Panza GF (2014) New evidences to understand the uplift of Tibetan plateau and the disruption of North China Craton. Earth Sci Rev 130:1–48
Zhao WJ, Mechie J, Brown LD, Guo J, Haines S, Hearn T, Klemperer SL, Ma YS, Meissner R, Nelson KD, Ni JF, Pananont P, Rapine R, Ross A, Saul J (2001) Crustal structure of central Tibet as derived from project INDEPTH wide-angle seismic data. Geophys J Int 145:486–498
Zhao JM, Li ZC, Cheng HG, Yao CL, Li YS (2004) Structure of lithospheric density and geomagnetism beneath the Tianshan orogenic belt and their geodynamic implications. Chin J Geophys 47(6):1061–1067 (in Chinese with English abstract)
Zhou H, Murphy MA (2005) Tomographic evidence for wholesale underthrusting of India beneath the entire Tibetan plateau. J Asian Earth Sci 25(3):445–457
doi:10.1186/1880-5981-66-10
Cite this article as:Denget al.:Transition from continental collision to tectonic escape? A geophysical perspective on lateral expansion of the
northern Tibetan Plateau.Earth, Planets and Space201466:10.
Submit your manuscript to a
journal and benefi t from:
7Convenient online submission 7Rigorous peer review
7Immediate publication on acceptance 7Open access: articles freely available online 7High visibility within the fi eld
7Retaining the copyright to your article