P R O C E E D I N G S
Open Access
Deciphering transcription factor binding patterns
from genome-wide high density ChIP-chip tiling
array data
Juntao Li
1, Lei Zhu
2, Majid Eshaghi
2, Jianhua Liu
2, Krishna Murthy R Karuturi
1*From
6th International Symposium on Bioinformatics Research and Applications (ISBRA
’
10)
Storrs, CT, USA. 23-26 May 2010
Abstract
Background:The binding events of DNA-interacting proteins and their patterns can be extensively characterized by high density ChIP-chip tiling array data. The characteristics of the binding events could be different for different transcription factors. They may even vary for a given transcription factor among different interaction loci. The knowledge of binding sites and binding occupancy patterns are all very useful to understand the DNA-protein interaction and its role in the transcriptional regulation of genes.
Results:In the view of the complexity of the DNA-protein interaction and the opportunity offered by high density tiled ChIP-chip data, we present a statistical procedure which focuses on identifying the interaction signal regions instead of signal peaks using moving window binomial testing method and deconvolving the patterns of interaction using peakedness and skewness scores. We analyzed ChIP-chip data of 4 different DNA interacting proteins including transcription factors and RNA polymerase in fission yeast using our procedure. Our analysis revealed the variation of binding patterns within and across different DNA interacting proteins. We present their utility in understanding transcriptional regulation from ChIP-chip data.
Conclusions:Our method can successfully detect the signal regions and characterize the binding patterns in ChIP-chip data which help appropriate analysis of the ChIP-ChIP-chip data.
Background
With the microarray technology rapidly advanced, tiling arrays have quickly become one of the most powerful tools in genome-wide investigations. High density tiling arrays [1] can be used to address many biological pro-blems such as transcriptome mapping, protein-DNA interaction mapping (ChIP-chip) and array CGH among others [2]. ChIP-chip [3], the focus of the paper, is a technique that combines chromatin immunoprecipita-tion (ChIP) with microarray technology (chip). It allows efficient, scalable and comprehensive identification of binding sites and profiles of DNA-binding proteins [4]. High density ChIP-chip tiling arrays not only help us
map the binding sites of a protein in the genome, but also allow us to better understand the binding events of the protein by clearly displaying the binding occupancy profiles. Several methods have been proposed to analyze the ChIP-chip data; for example, Joint Binding De-con-volution (JBD) [5] uses a probabilistic graphical model to improve spatial resolution of identification of the transcription factor binding sites. However it requires the DNA fragment length distribution which may not always be available. Its usefulness may be limited for high density tiling array since the resolution is consider-ably high. MPeak [6,7] fits a mixture of triangular basis to model the binding or interaction data. It ignores the complexity of binding event and only roughly charac-terizes the basic patterns for single and direct binding events. The more complex binding patterns from high density ChIP-chip may not be well explained using
* Correspondence: [email protected]
1
Computational & Systems Biology, Genome Institute of Singapore, 60 Biopolis Street, (S)138672, Singapore
Full list of author information is available at the end of the article
Liet al.BMC Proceedings2011,5(Suppl 2):S8 http://www.biomedcentral.com/1753-6561/5/S2/S8
mixture of a triangular basis. Model-based Analysis of Tiling-arrays (MAT) [8] reliably detects the signal enriched regions on Affymetrix tiling arrays by consider-ing the probe sequence and copy number of all probes on a single tiling array. The aim of those methods is to locate the binding sites only and not to characterize dif-ferent binding profiles present in difdif-ferent genomic regions.
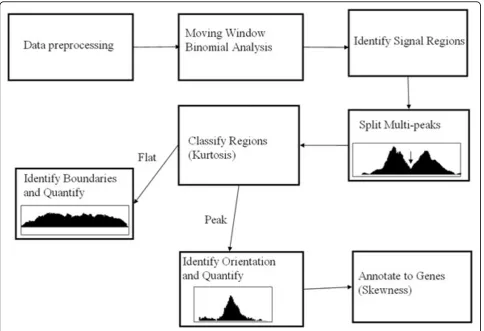
In the view of the complexity of the DNA-protein interaction, the opportunity offered by high-density tiled ChIP-chip data and the lack of methods to exploit wealth of information in the ChIP-chip data, we present a new statistical procedure to analyze high density ChIP-chip tiling array data to characterize protein-DNA interaction in terms of binding sites as well as the bind-ing profiles. First, we identify the enriched ChIP signal regions or protein binding occupancies using moving window binomial analysis and split the signal regions with multiple peaks into individual peak regions. Sec-ond, the signal regions are classified into two categories using peakedness test and analyzed separately. Third, the peak regions are analyzed to get the peak positions signifying the most probable binding sites, and using skewness assessment to improve the peak assignment to genes. The flat binding occupancies are processed to summarize their overall strength, their peak location is irrelevant as flat occupancies signify non-specific bind-ing to any particular locus within its range.
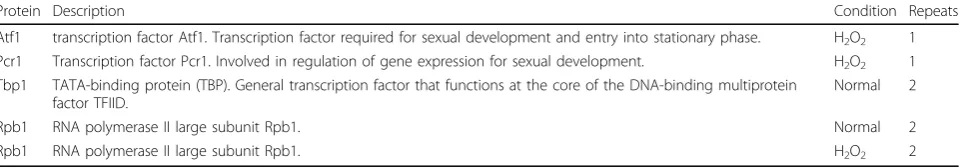
In this article, we applied our procedure to analyze the high density ChlP-chip data of fission yeast ( Schizosac-charomyces pombe) obtained from custom designed NimbleGen genome tiling arrays of ~380kprobes. We studied two stress-related transcriptional factors (TFs) Pcr1 and Atf1 with H2O2treatment [9], and one general
transcription factor Tbp1 (TATA box binding protein). We also included the RNA polymerase II large subunit, Rpb1 (with and without H2O2 treatment), which is used
to indicate transcriptionally active genes of S.pombe (Table1). We found that DNA-binding proteins show distinct patterns in the proportions of peak and flat binding profiles. Tbp1 and stress-related TFs show more peak binding patterns indicating their location specific binding, and Rpb1 present a large fraction of flat signal
regions within protein-coding regions indicating its non-specific binding along gene body.
Methods
The tiling array has very high resolution and probes cover the whole genome, and ChIP procedure selects only pro-tein binding sites which are a small part of the genome. Therefore, only a very small proportion of probes in tiling array has the binding signal and majority of probes’signals will be close to the background. Hence we median cen-tered the log transformed data for further analysis. The proposed statistical procedure is illustrated in Figure 1.
Moving window binomial analysis
For any probe in locationi, let xi(i= 1,…,n) denote the median centered log signal. We define the base thresh-oldcMAD, c fold MAD (median absolute deviation) of allxi’s in the array, forxi(i= 1,…,n), then
p x x c
n
i i
= #
{
| ≥ MAD}
is the probability that the signal of a probe passes the base threshold. Where #{xi|xi≥cMAD} is the total num-ber of probes whose signals pass the base threshold.
Thenpw(xi) is defined as the probability that xiis clas-sified as signal by considering its neighborhood region
xi
i w i w
{ }
− +as the signal region, and can be computed by binomial testing as in the following equation,
p x w
where L is the number of probes above the base threshold in the region
{ }
xi i wi w−+ andwis the predefinedTable 1 The list of TFs studied
Protein Description Condition Repeats
Atf1 transcription factor Atf1. Transcription factor required for sexual development and entry into stationary phase. H2O2 1
Pcr1 Transcription factor Pcr1. Involved in regulation of gene expression for sexual development. H2O2 1
Tbp1 TATA-binding protein (TBP). General transcription factor that functions at the core of the DNA-binding multiprotein factor TFIID.
Normal 2
Rpb1 RNA polymerase II large subunit Rpb1. Normal 2
whereais thep-value cutoff for the binomial test. After having identified signal regions, the task is to process them to identify binding sites and their profiles. The pre-requisite is to smooth the signals to reduce noise by smoothing the signal regions and their neigh-borhoods. Two different smoothing methods, multiple round moving average and median smoothing, are employed to reduce the noise in the data. Multiple round moving average smoothing method will retain the signal shape and the peak signal (local maximum) loci. This method has already been used in the ChIP-chip peak finder [10]. We use moving average method to split multi-peak signal regions, identify the peak loci and compute kurtosis and skewness scores of signal regions. The drawback of moving average is that it may destroy the boundaries of the signal regions, therefore we apply moving median smoothing method to characterize sig-nal regions.
Splitting multi-peak signal regions
Each signal region from moving window binomial analy-sis may contain multiple peaks (local maxima), indicat-ing multiple bindindicat-ing sites, and this will make the binding patterns more complex. Therefore, the regions
with multiple peaks are split at the troughs of their pro-files. For doing this, we first assign each probe xi of smoothed profile one of the gxi= {+, –, 0} to indicate
whether the binding signals significantly increased, decreased or not significantly changed from the immedi-ately neighboring probes,
x
i i
i i
i
x x d
x x d
=
+ − >
− − < − ⎧
⎨ ⎪
⎩ ⎪
+ +
if if
otherwise,
1
1
0
whered= MAD(δi),δi= |xi–xi+1| for i= 1, 2,…,n–
1. After removing all probes with”0”, the region is split at the transition of signs from “-”to “+”. After splitting, the signal regions of less than 4 probes are removed since those short signal regions generally have week sig-nals and cannot be characterized by peakedness and skewness assessment.
Peak position identification
Peak position of a signal region with one significant peak is determined after the moving average smoothing of the profile. The position of probe with the maximal
Figure 1The proposed statistical procedure for ChIP-chip data analysis.
Liet al.BMC Proceedings2011,5(Suppl 2):S8 http://www.biomedcentral.com/1753-6561/5/S2/S8
value in this region is defined as the position of the peak, the binding site.
Peakedness and skewness assessment of signal regions
If we consider the smoothed signal region xi
s e
{ }
as a probability mass function, it can be assessed for peaked-ness using its kurtosis score (K) using the formulaK region is designated as having flat-shape when itsK <2. Thus, peaked regions are separated from flat regions.
Similarly, for single peak regions, we used skewness score to test whether the peaks are left-skewed or right-skewed which indicates the binding orientation. This is very useful for transcription factor binding assignment to a single gene if there is a binding region in a bidirec-tional intergenic region (intergenic regions from diver-gent pair of genes). The skewness score (G) is calculated using the formula
where theu andpjhave same definition as in kurtosis definition.
Results
We used data from customized NimbleGen Tiling array designed forS. pombe(fission yeast) which has ~380k 50merprobes. They cover both strands of entireS. pombe genome based on the genome sequence from Wellcome Trust Sanger Institute (ftp://ftp.sanger.ac.uk/pub/yeast/ pombe/). In each strand, there is a 16bpinterval between two consecutive probes. The probes on the reverse strand are placed so that they cover the gaps between consecutive probes of the pairing forward strand. Therefore, the probes have 17bpoverlap with each other. The probes with multiple hits in the genome will have the same level of signals in multiple loci and they cannot distinguish which locus contributed to the signal. Therefore, the probes with more than 4 hits were removed from the ana-lysis, only ~2% of probes have been removed.
Transcription factor binding regions and binding patterns
We analyzed ChIP-chip experiments of three DNA-binding proteins: two stress-related transcription factors
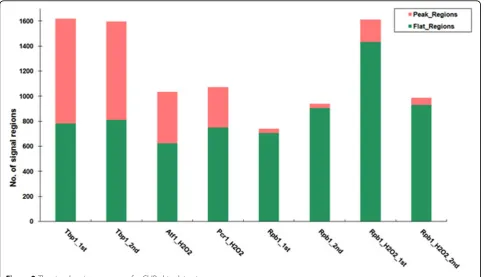
Atf1 and Pcr1, one general transcription factor Tbp1 together with the RNA polymerase II large subunit Rpb1 whose occupancy indicates transcriptionally active genes. Tbp1 is a core subunit of the eukaryotic tran-scription factor TFIID which binds specifically to the TATA box. It contributes to load and release of RNA polymerase II at the transcription start sites (TSS). Furthermore, Tbp1 is also a necessary component of RNA polymerase I and RNA polymerase III. Therefore, Tbp1 is a good choice for binding pattern study. There are two replicates of ChIP-chip experiment for Tbp1 and Rpb1, and one replicate for Atf1 and Pcr1 with H2O2 treatment [9]. The data of Tbp1 and Rpb1 will be available in the upcoming publications. The signal regions for each array were identified with the stringent criteria of cMAD= 2MAD at p-value less than 0.001 (a = 0.001). The number of signal regions is ~ 1600 (~ 1300 before multi-peak splitting) for each replicate of Tbp1, ~ 1000 (~800 before multi-peak splitting) for Atf1/Pcr1, and for Rpb1 it is ~ 800 (~ 500 before multi-peak splitting). We applied Dice coefficient to measure the similarity of signal regions between two repeats.
S A B length of their overlapping regions. The coefficient for Tbp1 is 0.921 which indicates that our results of Tbp1 signal regions are highly reproducible. The coefficient for Rpb1 is 0.743 which is still considerably high.
The summary of the kurtosis score is shown in Fig-ure 2. More than half of the transcriptional factors (including Tbp1, Atf1 and Pcr1) signal regions are sharp peaks and Rpb1 (with and without H2O2
To conduct more reliable analysis, we used the com-mon Tbp1 bindings between replicated experiments. The common binding was defined as a binding region from the 1st experiment having the overlapping region from the 2nd experiment and the binding peaks of these two overlapping regions are both located inside of the intersection region. To measure the level of transcrip-tion activity of each gene, we detected the median level of Rpb1 occupancies within a coding region and used the average of the replicated experiments as a measure of the transcription level.
We investigated the kurtosis score distribution for all three transcription factors (Atf1, Pcr1 and Tbp1) in three different genomic regions based onpombegenome TSS definition [11]: regions within 500bp of TSS ([–500, 500]), the upstream intergenic regions beyond 500bp from TSS (<-500) and the downstream intragenic regions beyond 500bp from TSS (>500). As shown in Figure 3, higher kurtosis scores are observed in the regions of [–500, 500] and <-500 where are mostly pro-moter regions. it implies that transcriptional factors favor to bind these two regions. On the other hand, the TF signal regions falling into >500bp downstream of TSS (mostly are coding regions) have low kurtosis com-pared with the promoter regions (p-value=1.620e-10 in Tbp andp-value<2.2e-16 in Atf1/Pcr1), and the binding signals in these regions are generally weak and unstable. The low kurtosis signals in coding regions is probably
due to the interaction between TFs and RNA polymer-ase and the whole complex were involved in transcrip-tion elongatranscrip-tion. The Rpb1 binding regions mostly fall into coding regions and present the flat patterns with low kurtosis.
TF binding affinity positively correlates with the gene transcription level
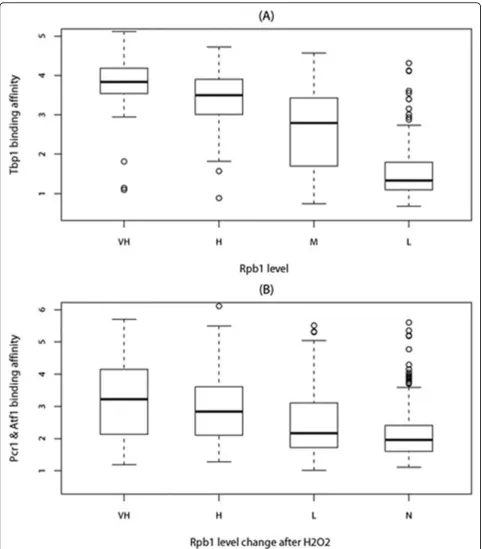
After having identified all peaked signal regions from ChIP-chip data, the next step is to map those regions to genes. To our knowledge, there is no perfect method to accurately map binding sites to genes. Therefore, we limited our investigation to the peaks only from the uni-directional intergenic (IGU) regions which are easy to assign, i.e. assigned to the downstream genes, to reduce the risk of assignment errors. Furthermore, we filtered out peaks not within the upstream 1kbof any gene as it may be out of the promoter regions for S.pombe. The upstream peaks of any RNA genes have also been removed since Tbp1 is also associated with RNA poly-merase I and RNA polypoly-merase III. We chose the highest peak if one promoter region have multiple peaks. There are 379, 165 and 172 peaks of Tbp1, Atf1 and Pcr1 respectively in IGU regions (IGU peaks) after filtering. Then we investigated the relationship between TFs binding affinity and transcription levels. From Figure 4 (A), we observed positive correlation between Tbp1 binding affinity and transcription levels of the
protein-Figure 2The signal regions summary for ChIP-chip datasets.
Liet al.BMC Proceedings2011,5(Suppl 2):S8 http://www.biomedcentral.com/1753-6561/5/S2/S8
coding genes (correlation is 0.55 andp-value<2.2e-16). It implies that the highly transcribed genes tend to be initiated by high Tbp1 binding affinity at their promo-ters. Similar to Tbp1, we also observed positive correla-tion between Atf1/Pcr1 binding affinity and the Rpb1 level change after H2O2 treatment (Figure 4(B), correla-tion is 0.30 andp-value=1.110e-15).
Skewness of Tbp1 binding regions helps identifying Tbp1 regulated genes
The skewness scores of Tbp1 binding regions also posi-tively correlate with Rpb1 occupancy levels. We investi-gated the skewness for 379 IGU Tbp1 peaks in unidirectional intergenic regions. Interestingly, the pat-terns of Tbp1 binding skewed towards the direction of the immediate downstream gene which has transcrip-tion event. In other words, Tbp1 signal region displays an extended tail into the ORF of its target gene. As shown in Figure 5(A), transcribed genes on the forward strand tend to display positive skewness for Tbp1 bind-ing occupancies in their promoters regions, and the transcribed genes on the reverse strand preferentially show negative skewness. Another interesting observa-tion is that the absolute skewness declines with the decreasing Rpb1 level of the downstream genes indicat-ing that Tbp1 bindindicat-ing pattern is enough to predict
whether the downstream genes are transcribed in that condition. Our explanation is that Tbp1 may have per-sistent interaction with RNA polymerase in transcribing regions during the transition between transcription initiation and elongation, and the Tbp1 occupancy would correlate with the transcription rate of the down-stream genes.
To further test our observations and demonstrate the utility of the skewness of binding regions, we checked the correlation between skewness of Tbp1 binding in the bi-directional promoters and Rpb1 levels of the flanking genes. The assignment of binding sites in the bidirectional promoters is always a problem: some stu-dies assign them to both genes while the others assign them to the nearest gene. Here, we found skewness score may help us to get better assignment i.e. to iden-tify the genes activated by Tbp1. In order to be conser-vative, we removed bidirectional intergenic regions with one of the flanking genes is an RNA gene and also dis-carded those gene pairs having more than one Tbp1 binding peaks. Finally there were 387 gene pairs used in the analysis. As shown in Figure 5(B), when the skew-ness scores are significantly positive (greater than 0.15) then the transcription level of the genes on the forward strands is clearly higher compared to the corresponding paired gene on the reverse strand, vice versa.
Figure 4(A)Tbp1 binding affinity for VH(very high, Rpb1≥2), H(high, 1.5≤Rpb1<2), M(Median, 1≤Rpb1<1.5) and L(Low, 0.5≤Rpb1< 1) Rpb1 level groups. (B)Atf1 and Pcr1 binding affinity for VH(very high,ΔRpb1≥2), H(high, 1≤ΔRpb1<2), L(Low, 0≤ΔRpb1<1), N(No,ΔRpb1< 0) Rpb1 level change after H2O2treatment groups. WhereΔRpb1 = Rpb1H2O2- Rpb1 (Rpb1H2O2and Rpb1 are Rpb1 level with and without H2O2treatment).
Liet al.BMC Proceedings2011,5(Suppl 2):S8 http://www.biomedcentral.com/1753-6561/5/S2/S8
When the binding pattern seems symmetric (between -0.15 and 0.15), there are no significant differences for transcription level between genes on the forward strand and the reverse strand. In addition, as shown in Figure 5, the presence of symmetric pattern is associated with the low Rpb1 level less than 0.5 i.e. there is almost zero transcription events for such low level transcriptions are rarely detectable with our Rpb1 data under 2MAD cut-off. Therefore, the skewness of peaks could be helpful in assigning Tbp1 binding to annotated features, particu-larly for the binding sites located in IGB (bidirectional intergenic) regions. Three examples of Tbp1 binding patterns and Rpb1 occupancies with two repeats in IGU + (IGU between forward strand genes), IGU- (IGU between reverse strand genes) and IGB regions are shown in Figure 6.
Atf1 and Pcr1 bindings also display more skewed pat-terns at promoters of the stress response genes (more than 2 fold Rpb1 change after H2O2 treatment). As
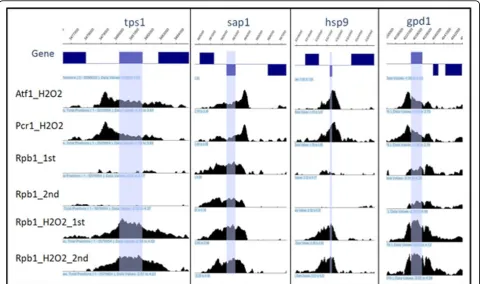
shown in Figure 7, the average skewness score of stress response gene bindings are positive (the sign of skew-ness score for negative strand gene bindings are chan-ged) and the average skewness score of other genes bindings equal to 0 (p-value=0.007204). Four genes selected in top 20 Atf1/Pcr1-bound genes list [9] as examples are shown in Figure 8.
Conclusions
We developed a statistical procedure to characterize binding events of DNA-interacting proteins especially transcription factors from high density ChIP-chip tiling array data. The signal regions are detected using moving window binomial analysis and the binding events are characterized by two shape parameters, kurtosis and skewness.
We applied our method to ChIP-chip data of TATA box binding protein (Tbp1), Atf1, Pcr1 and Rpb1 inS. pombe. We found that Tbp1 tends to have more sharp
Figure 6Three Examples of Tbp1 binding patterns and Rpb1 occupancies with two repeats in IGU+, IGU- and IGB regions. The blue boxes in first track indicate the gene ORF regions, and the vertical lines indicate the peak loci for Tbp1 binding.
Figure 7The skewness score of Atf1 and Pcr1 binding for stress response genes (more than 2 fold Rpb1 change after H2O2treatment) and
other genes (less than 2 fold Rpb1 change after H2O2treatment). The sign of skewness score for negative strand gene bindings are changed.
Liet al.BMC Proceedings2011,5(Suppl 2):S8 http://www.biomedcentral.com/1753-6561/5/S2/S8
peaked occupancies than Rpb1 that indicates our meth-ods can efficiently distinguish mostly localized DNA-protein bindings and the scattered DNA-DNA-protein interac-tions. We should notice even Tbp1 also has flat occu-pancies, that maybe due to the interaction of Tbp1 with RNA polymerase complex are maintained after the event of transcription initiation since other studies have reported there is no paused Pol II observed at the pro-moter regions in yeast [12]. It is also possible that Tbp1 or other components of TFIID may contribute to tran-scription elongation. The specific wet lab experiments may be designed to validate this assumption.
The two shape parameters of the signal regions, kurto-sis and skewness, can characterize the binding patterns and the associated biology. We used kurtosis to classify the regions into peak and flat regions. The peak regions mostly fall into the promoters and the flat regions are mostly very large and cover the coding regions. We have demonstrated that the binding pattern of the peak regions in promoter regions are skewed to the down-stream genes if they are transcribed, and hence the skewness can help us to predict whether the down-stream gene is transcribed and to assign the binding sites to genes in the bidirectional intergenic regions.
Our method is applicable not only to ChIP-chip data, but can also be adopted to other datasets with similar
goal. For example, ChIP-seq and ChIP-chip measure same signals but with different techniques. The binding patterns for seq data should be similar to ChIP-chip data, so the peakedness and skewness assessment can be used for further analysis. Our method can be extended to other tiling array data if the patterns of the signal regions are important to the corresponding studies.
Acknowledgements
The authors thank Edison T. Liu for his constant encouragement and support during this work. We appreciate Jonghoon Lee, Puteri Paramita, Rohini Parameswarath, Huaien Luo for their valuable discussion. This work was supported by the Genome Institute of Singapore, Biomedical Research Council, Agency for Science, Technology and Research (A*STAR), Singapore. This article has been published as part ofBMC ProceedingsVolume 5 Supplement 2, 2011: Proceedings of the 6th International Symposium on Bioinformatics Research and Applications (ISBRA’10). The full contents of the supplement are available online at http://www.biomedcentral.com/1753-6561/5?issue=S2.
Author details 1
Computational & Systems Biology, Genome Institute of Singapore, 60 Biopolis Street, (S)138672, Singapore.2Systems Biology, Genome Institute of
Singapore, 60 Biopolis Street, (S)138672, Singapore.
Authors’contributions
RKM Karuturi and J. Li proposed the project. J. Li, L. Zhu, and RKM Karuturi developed the model, analyzed the data and wrote the paper. M. Eshaghi and J. Liu performed the ChIP-chip experiments. All the authors evaluated the results and approved the manuscript.
Figure 8Four examples of Atf1 and Pcr1 binding patterns and Rpb1 (with and without H2O2treatment) occupancies with two repeats. The
Competing interests
The authors declare that they have no competing interests.
Published: 28 April 2011
References
1. Mockler TC, Chan S, Sundaresan A, Chen H, Jacobsen SE, Ecker JR:
Applications of DNA tiling arrays for whole-genome analysis.Genomics
2005,85:1-15.
2. Yazaki J, Gregory BD, Ecker JR:Mapping the genome landscape using tiling array technology.Current Opinion in Plant Biology2007,
10(5):534-542.
3. Buck MJ, Lieb JD:ChIP-chip: considerations for the design, analysis, and application of genome-wide chromatin immunoprecipitation experiments.Genomics2004,83(3):349-360.
4. Iyer VR, Horak CE, Scafe CS, Botstein D, Snyder M, Brown PO:Genomic binding sites of the yeast cell-cycle transcription factors SBF and MBF.
Nature2001,409(6819):533-538.
5. Qi Y, Rolfe A, MacIsaac KD, Gerber GK, Pokholok D, Zeitlinger J, Danford T, Dowell RD, Fraenkel E, Jaakkola TS, Young RA, Gifford DK:High-resolution computational models of genome binding events.Nature Biotechnology
2006,24(8):963-970.
6. Kim TH, Barrera LO, Zheng M, Qu C, Singer MA, Richmond TA, Wu Y, Green RD, Ren B:A high-resolution map of active promoters in the human genome.Nature2005,436(7052):876-880.
7. Zheng M, Barrera LO, Ren B, Wu YN:ChIP-chip: data, model, and analysis.
Biometrics2007,63(3):787-796.
8. Johnson WE, Li W, Meyer CA, Gottardo R, Carroll JS, Brown M, Liu XS:
Model-based analysis of tiling-arrays for ChIP-chip.Proceedings of the National Academy of Sciences of the United States of America2006,
103(33):12457-12462.
9. Eshaghi M, Lee JH, Zhu L, Poon SY, Li J, Cho K, Chu Z, Karuturi RKM, Liu J:
Genomic binding profiling of the fission yeast stress-activated MAPK Sty1 and the bZIP transcriptional activator Atf1 in response to H2O2.
PloS One2010,5(7):E11620.
10. Glynn EF, Megee PC, Yu H, Mistrot C, Unal E, Koshland DE, DeRisi JL, Gerton JL:Genome-wide mapping of the cohesin complex in the yeast Saccharomyces cerevisiae.PLoS Biology2004,2(9):E259.
11. Lantermann AB, Straub T, Stralfors A, Yuan G, Ekwall K, Korber P:
Schizosaccharomyces pombe genome-wide nucleosome mapping reveals positioning mechanisms distinct from those of Saccharomyces cerevisiae.Nat Struct Mol Biol2010,17(2):251-257.
12. Wade JT, Struhl K:The transition from transcriptional initiation to elongation.Curr Opin Genet Dev2008,18(2):130-136.
doi:10.1186/1753-6561-5-S2-S8
Cite this article as:Liet al.:Deciphering transcription factor binding patterns from genome-wide high density ChIP-chip tiling array data. BMC Proceedings20115(Suppl 2):S8.
Submit your next manuscript to BioMed Central and take full advantage of:
• Convenient online submission
• Thorough peer review
• No space constraints or color figure charges
• Immediate publication on acceptance
• Inclusion in PubMed, CAS, Scopus and Google Scholar
• Research which is freely available for redistribution
Submit your manuscript at www.biomedcentral.com/submit
Liet al.BMC Proceedings2011,5(Suppl 2):S8 http://www.biomedcentral.com/1753-6561/5/S2/S8
![Figure 3 The kurtosis score distribution for TF (Atf1, Pcr1 and Tbp1) occupancies in the three genomic regions: <-500 (the upstream intergenicregions beyond 500bp from TSS),[–500, 500] (regions within 500bp of TSS) and >500 (the downstream intragenic regio](https://thumb-us.123doks.com/thumbv2/123dok_us/866499.1103945/6.595.57.540.88.368/figure-kurtosis-distribution-occupancies-upstream-intergenicregions-downstream-intragenic.webp)