Open Access
Proceedings
Linkage analysis using principal components of gene expression
data
Elizabeth J Atkinson*
1, Brooke L Fridley
1, Ellen L Goode
2,
Shannon K McDonnell
1, Wen Liu-Mares
2, Kari G Rabe
1, Zhifu Sun
2,
Susan L Slager
1and Mariza de Andrade
1Address: 1Division of Biostatistics, Department of Health Sciences Research, Mayo Clinic College of Medicine, 200 1st Street SW, Rochester,
Minnesota 55905, USA and 2Division of Epidemiology, Department of Health Sciences Research, Mayo Clinic College of Medicine, 200 1st Street
SW, Rochester, Minnesota 55905, USA
Email: Elizabeth J Atkinson* - [email protected]; Brooke L Fridley - [email protected]; Ellen L Goode - [email protected]; Shannon K McDonnell - [email protected]; Wen Liu-Mares - [email protected]; Kari G Rabe - [email protected]; Zhifu Sun - [email protected]; Susan L Slager - [email protected]; Mariza de Andrade - [email protected]
* Corresponding author
Abstract
The goal of this paper is to investigate the effect of using principal components as a data reduction method for expression data in linkage analysis. We used 45 probes normalized using the Affymetrix Global Scaling that had evidence of high heritability to estimate the first 10 principal components (PC). A genome-wide linkage scan was performed on the 45 expression values and the 10 PCs using 2272 single-nucleotide polymorphisms. Our conclusions were: 1) PC analyses under-performed the single-probe analysis for known signals; 2) the PC that best reproduced the single-probe analysis was primarily composed of that probe; 3) no new signals were detected in the PC analysis; 4) no new pleiotropic effects were detected in the PC analysis.
Background
There is great interest in understanding genetic factors related to variable expression of genes. Recently, several studies have shown the first evidence of heritability of mRNA between individuals [1-6]. By treating the expres-sion phenotypes for each transcript (or probe) as a quan-titative phenotype, a variance-components linkage analysis could be used [1-6]. The expectation is to detect linkage signals between the gene expression values and genomic regions. As pointed out by William et al. [6],
sev-eral issues plague these studies, including the selection of informative expression values. Principal components (PC) is a dimension-reduction approach [7] and it has been shown to be a valuable tool in linkage analysis of correlated phenotypes [8]. Multivariate linkage analysis has been shown to be useful in identifying genomic regions with pleiotropic effect [9]. Given that the PC approach is another way to combine information from multiple phenotypes, it can be hypothesized that PC anal-ysis might also be helpful in the identification of
pleio-from Genetic Analysis Workshop 15
St. Pete Beach, Florida, USA. 11–15 November 2006
Published: 18 December 2007
BMC Proceedings 2007, 1(Suppl 1):S79
<supplement> <title> <p>Genetic Analysis Workshop 15: Gene Expression Analysis and Approaches to Detecting Multiple Functional Loci</p> </title> <editor>Heather J Cordell, Mariza de Andrade, Marie-Claude Babron, Christopher W Bartlett, Joseph Beyene, Heike Bickeböller, Robert Culverhouse, Adrienne Cupples, E Warwick Daw, Josée Dupuis, Catherine T Falk, Saurabh Ghosh, Katrina A Goddard, Ellen L Goode, Elizabeth R Hauser, Lisa J Martin, Maria Martinez, Kari E North, Nancy L Saccone, Silke Schmidt, William Tapper, Duncan Thomas, David Tritchler, Veronica J Vieland, Ellen M Wijsman, Marsha A Wilcox, John S Witte, Qiong Yang, Andreas Ziegler, Laura Almasy and Jean W MacCluer</editor> <note>Proceedings</note> <url>http://www.biomedcentral.com/content/pdf/1753-6561-1-S1-info.pdf</url> </supplement>
This article is available from: http://www.biomedcentral.com/1753-6561/1/S1/S79
© 2007 Atkinson et al; licensee BioMed Central Ltd.
tropic effects. Because of the large number of expression phenotypes in the Genetic Analysis Workshop 15 (GAW15) Problem 1 data set, we first selected the most genetically informative phenotypes based on those with high heritability estimates [10]. In this paper, we examine whether combinations of correlated expression pheno-types improved the linkage signals using PC and whether the PC results suggest new pleiotropic effects.
Methods
DataThe GAW15 Problem 1 CEPH (Centre d'Etude du Poly-morphisme Humain) data consisted of 196 participants from 14 three-generation pedigrees with 14 individuals per family, 4 grandparents, 2 parents, and 8 offspring. Two hundred and seventy-six arrays including data on 3554 probe sets on the Affymetrix Human Focus Arrays were provided by GAW15. These probe sets had been selected as those with greatest inter-individual variability from a total of 8500 probe sets [2].
Selection of phenotype subsets
To increase the number of informative phenotypes, we excluded genes whose expression had little variation (standard deviation ≤0.3) and low call rates (absent calls >90%) across samples; 3306 phenotypes (probe sets) remained. We further reduced the number by identifying those that were most likely to be genetic based on herita-bility estimates from a polygenic model, resulting in 45 phenotypes. Additional details of the selection process can be found in de Andrade et al. [10].
Principal components
Principal-components (PC) analysis is a data reduction technique in which each component is a linear combina-tion of the phenotypes, each PC describing as much vari-ability of the phenotypes as possible [7]. Because the 45 phenotypes are on a common scale, the decompositions were made using the unscaled covariance matrix. The first ten PCs accounted for 84% of the variance in the 45 phe-notypes; 14 components would have been required to explain 90% of the variance.
Genetic data
For a subset of subjects, including founders, we observed a large number of missing genotypes. Recognizing that missing data can impact identity-by-descent (IBD) estima-tion [11] when there is linkage disequilibrium, we reduced the extent of linkage disequilibrium between sin-gle-nucleotide polymorphisms (SNPs) by removing SNPs with r2 > 0.30 using ldSelect [12]. Of the 2756 markers
provided by GAW15, 2272 remained (mean spacing 1.2 cM). We then removed 2205 Mendelian inconsistencies (0.5% of matings/genotypes) primarily by removing the conflicting offspring genotypes. Multipoint IBD (MIBD)
sharing among pairs of relatives was calculated using SIMWALK2 [13].
Quantitative trait linkage analysis
Prior to the linkage analysis, the 55 phenotypes (45 expression phenotype + 10 PCs) were normally trans-formed using the empirical normal quantile transforma-tion [14], which has been shown to have increased power for variance-components analysis [15]. Variance-compo-nents linkage analyses were performed using the S-Plus/R library multic [16]. Sex was used as a covariate. We assessed the 55 phenotypes for evidence of linkage and considered "strong" linkage evidence as p < 10-9, which is
comparable to Table 1 in Morley et al. [2], and "moder-ate" linkage evidence as p < 10-4 for comparison with the
single probe analyses. Finally, for the 45 expression phe-notype models, we used a screening tool proposed by de Andrade et al. [17] to estimate bivariate linkage results. For those phenotypes that suggested strong bivariate link-age using the screening tool, bivariate linklink-age analysis was also performed [18].
Results
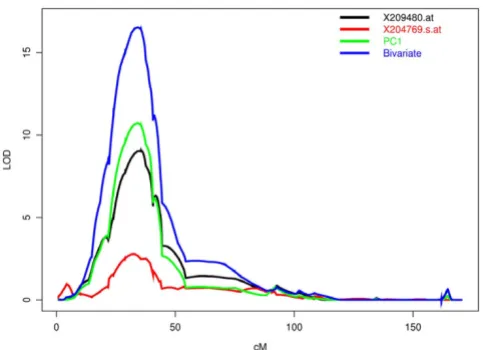
Figure 1 shows the relative weighting for the first five PCs. For each component, the bar height represents the relative influence of a particular probe. Also included is the gene and gene location associated with each expression pheno-type. The first PC is dominated by probe 209480.at, which has a relative weighting of 0.979. This first probe was the only component to show any increased linkage signal, changing from a LOD of 9.0 to 10.7. One possible reason for this increase is that the first PC is composed of two phenotypes (209480.at, 204769.s.at) that are associated with the HLA region on chromosome 6. Figure 2 shows the linkage analysis for chromosome 6 using these two phenotypes. Separate lines are drawn for the two univari-ate analyses, the first PC, and the bivariunivari-ate analysis using these probes.
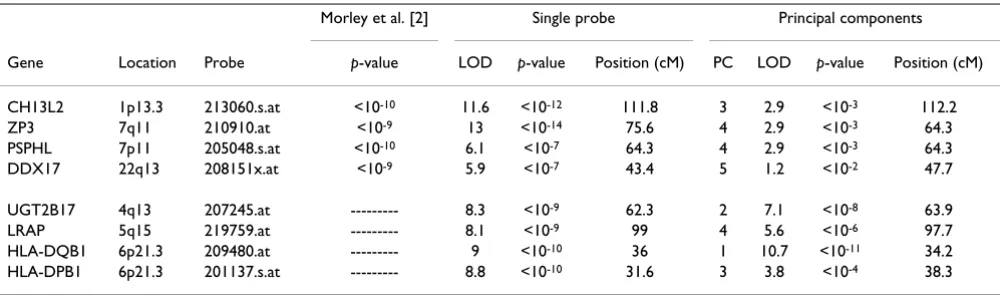
Table 1 compares our results with those of Morley et al. [2]. They used the Affymetrix normalization method and their multipoint genome-wide linkage analysis was done using SIBPAL in S.A.G.E. [2]. Two of our six best linkage signals for the single phenotype analysis agreed with Mor-ley's; four, including the HLA region identified using the PC approach, were not found by Morley. For the remain-ing nine top phenotypes identified by Morley et al., we were unable to compare the results because the specific phenotypes were not part of our final 45.
Additional review of all the bivariate estimates using the de Andrade screening approach showed only two new areas to investigate that would not have been previously flagged using a criteria of p < 10-9. The DDX17 gene signal,
principal-components analyses
Morley et al. [2] Single probe Principal components
Gene Location Probe p-value LOD p-value Position (cM) PC LOD p-value Position (cM)
CH13L2 1p13.3 213060.s.at <10-10 11.6 <10-12 111.8 3 2.9 <10-3 112.2
ZP3 7q11 210910.at <10-9 13 <10-14 75.6 4 2.9 <10-3 64.3
PSPHL 7p11 205048.s.at <10-10 6.1 <10-7 64.3 4 2.9 <10-3 64.3
DDX17 22q13 208151x.at <10-9 5.9 <10-7 43.4 5 1.2 <10-2 47.7
UGT2B17 4q13 207245.at --- 8.3 <10-9 62.3 2 7.1 <10-8 63.9
LRAP 5q15 219759.at --- 8.1 <10-9 99 4 5.6 <10-6 97.7
HLA-DQB1 6p21.3 209480.at --- 9 <10-10 36 1 10.7 <10-11 34.2
HLA-DPB1 6p21.3 201137.s.at --- 8.8 <10-10 31.6 3 3.8 <10-4 38.3
The column "LOD" represents the maximum LOD scores in the chromosome where the genes are located with its respective p-values and positions in cM. The principal components results represent values at the same relative region as those found using the two other methods (single probe, Morley et al. [2]), even though the PC results are not composed of a single probe. The column "PC" lists the principal component that was used to find the maximum LOD score. The four bottom probes met our p-value < 10-9 criteria but did not appear on Morley's top 13 list. There
were an additional 9 probes on Morley's list that were not in our top 45.
Principal component loadings
Figure 1
was increased from p < 10-6 to p < 10-8 when used with
probe 207598.x.at (XRCC2, 7q36) in a bivariate analysis. One area in chromosome 6 had a screening p-value of 10 -8 using probes 220386.s.at and 320.at but actual bivariate
analysis yielded a p-value similar to the stronger of the phenotypes (10-6). Neither of these potential associations
were strongly grouped in the first 10 PCs. The Dead/H Box
17 (DDX17) is a member of the DEAD box
(asp-glu-ala-asp/his) protein family of RNA helicases that are involved in diverse cellular functions including mRNA splicing, ribosome assembly, translation initiation, mRNA stabil-ity, and cell growth and division, and XRCC2 is essential for the efficient repair of DNA double-strand breaks by homologous recombination between sister chromatids.
Discussion
We compared the total number of LOD scores greater than three across the genome for the first 10 PCs with the regions identified by each of the 45 phenotypes and found that in general, the PC analyses under-performed the single probe set analysis for known signals. The com-ponent that best reproduced the single probe set analysis (Component 1) was primarily composed of that probe set and also included another probe set that focused on that region. No new signals were detected using PCs despite the strong correlation between the probes. However, we observed a strong linkage signal on chromosome 6 in the HLA region when two probe sets from the HLA region were analyzed as bivariate traits. The two other increases in linkage signals from bivariate analysis that increased our list of interesting areas were not picked up using PCs.
Conclusion
We observed that although PC has been suggested as a potentially useful screening tool for identifying genes linked to a cluster of highly correlated variables/pheno-types, it was not helpful in identifying linkage signals in this data set. Based on this analysis, other data reduction techniques should be investigated.
Competing interests
The author(s) declare that they have no competing inter-ests.
Acknowledgements
This research was partially funded by NIH grants R01HL71917 and CA94919.
This article has been published as part of BMC Proceedings Volume 1 Sup-plement 1, 2007: Genetic Analysis Workshop 15: Gene Expression Analysis and Approaches to Detecting Multiple Functional Loci. The full contents of the supplement are available online at http://www.biomedcentral.com/ 1753-6561/1?issue=S1.
References
1. Schadt EE, Monks SA, Drake TA, Lusis AJ, Che N, Colinayo V, Ruff TG, Milligan SB, Lamb JR, Cavet G, Linsley PS, Mao M, Stoughton RB, Friend SH: Genetics of gene expression surveyed in maize, mouse and man. Nature 2003, 422:297-302.
2. Morley M, Molony CM, Weber TM, Devlin JL, Ewens KG, Spielman RS, Cheung VG: Genetic analysis of genome-wide variation in human gene expression. Nature 2004, 430:743-747.
3. Cheung VG, Spielman RS, Ewens KG, Weber TM, Morley M, Burdick JT: Mapping determinants of human gene expression by regional and genome-wide association. Nature 2005,
437:1365-1369.
4. Chesler EJ, Lu L, Shou S, Qu Y, Gu J, Wang J, Hsu HC, Mountz JD, Baldwin NE, Langston MA, Threadgill DW, Manly KF, Williams RW:
Complex trait analysis of gene expression uncovers poly-genic and pleiotropic networks that modulate nervous sys-tem function. Nat Genet 2005, 37:233-242.
5. Hubner N, Wallace CA, Zimdahl H, Petretto E, Schulz H, Maciver F, Mueller M, Hummel O, Monti J, Zidek V, Musilova A, Kren V, Causton H, Game L, Born G, Schmidt S, Muller A, Cook SA, Kurtz TW, Whit-taker J, Pravenec M, Aitman TJ: Integrated transcriptional profil-ing and linkage analysis for identification of genes underlyprofil-ing disease. Nat Genet 2005, 37:243-253.
6. William RBH, Cotsapas CJ, Cowley MJ, Chan E, Nott DJ, Little PFR:
Normalization procedures and detection of linkage signal in genetical-genomics experiments. Nat Genet 2006, 38:855-856. 7. Anderson TW: An Introduction to Multivariate Statistical Analysis 2nd
edi-tion. New York: John Wiley & Sons; 1984.
8. Ott J, Rabinowitz D: A principal-components approach based on heritability for combining phenotype information. Hum Hered 1999, 49:106-111.
9. Almsay L, Blangero J: Multipoint quantitative-trait linkage anal-ysis in general pedigrees. Am J Hum Genet 1998, 62:1198-1211. 10. de Andrade M, Atkinson EJ, Fridley BL, Goode EL, McDonnell S,
Liu-Mares W, Rabe KG, Sun Z, Slager SL: The genetics of gene expression: comparison of linkage scans using two pheno-type normalization methods. BMC Proc 2007, 1(Suppl 1):S151. 11. Huang Q, Sanja S, Amos C: Ignoring linkage disequilibrium among tightly linked markers induces false-positive evidence of linkage for affected sib pair analysis. Am J Hum Genet 2004,
75:1106-1112.
12. Carlson CS, Eberle MA, Rieder MJ, Yi Q, Kruglyak L, Nickerson DA:
Selecting a maximally informative set of single-nucleotide polymorphisms for association analyses using linkage dise-quilibrium. Am J Hum Genet 2004, 74:106-120.
Chromosome 6 linkage analysis
Figure 2
Publish with BioMed Central and every scientist can read your work free of charge "BioMed Central will be the most significant development for disseminating the results of biomedical researc h in our lifetime."
Sir Paul Nurse, Cancer Research UK
Your research papers will be:
available free of charge to the entire biomedical community
peer reviewed and published immediately upon acceptance
cited in PubMed and archived on PubMed Central
yours — you keep the copyright
Submit your manuscript here:
http://www.biomedcentral.com/info/publishing_adv.asp
BioMedcentral
13. Sobel E, Sengul H, Weeks DE: Multipoint estimation of identity-by-descent probabilities at arbitrary positions among marker loci on general pedigrees. Hum Hered 2001, 52:121-131. 14. Lehman EL: Nonparametrics: Statistical Methods Based On RanksSan
Francisco: Holden-Day, Inc; 1975:97.
15. Peng B, Yu RK, DeHoff KL, Amos CI: Normalizing a large number of quantitative traits using empirical normal quan-tile transformation. BMC Proc 2007, 1(Suppl 1):S156.
16. de Andrade M, Atkinson EJ, Lunde EM, Amos CI, Chen J: Estimating Genetic Components of Variance in Family Studies using the Multic Rou-tines. Technical Report Series No. 78Rochester, Minnesota: Department of Health Sciences Research, Mayo Clinic; 2006.
17. de Andrade M, Olswold C, Slusser JP, Tordsen LA, Atkinson EJ, Rabe KG, Slager SL: Identification of genes involved in alcohol con-sumption and cigarette smoking. BMC Genetics 2005, 6:S112. 18. de Andrade M, Amos CI: Multivariate linkage analysis. In