FULL PAPER
Stochastic ground motion simulation
of the 2016 Meinong, Taiwan earthquake
Chun‑Te Chen
1*, Shun‑Chiang Chang
2and Kuo‑Liang Wen
2Abstract
We applied a stochastic method for the finite‑fault modeling of strong ground motions to the 2016 Meinong, Taiwan earthquake. Newly developed attenuation models in Southern Taiwan with the frequency‑dependent Q= 86.4f0.73 and the high‑frequency decay factor κ0 were used in the synthetic model. The horizontal‑to‑vertical spectral ratios (HVSR) were calculated from weak motions and the Meinong mainshock and used for the site amplification correc‑ tion of the synthetic waveforms produced by the stochastic ground motion simulation. Simulations incorporating the attenuation models and site correction improved the prediction of the S‑wave envelope, duration, and peak ground acceleration (PGA). The nonlinear site response during the Meinong mainshock was identified by the degree of nonlinear site response (DNL), which is a summation of HVSR differences between weak motions and the Meinong mainshock as recorded by the Taiwan Strong Motion Instrument Program. The DNL showed a positive correlation with ground motion intensity. The surface site conditions influenced DNL strength. The percentage of PGA reduction calculated in this study can be an indicator of the spatial distribution of the degree of nonlinear soil effects on the Meinong earthquake in the time domain. Areas that had high levels of PGA reduction overlap with areas that had high liquefaction potential. Based on the residual analysis, forward directivity was identified in a 105° range in the northwestward direction. The amplification of forward rupture directivity was three times greater than the backward rupture directivity.
Keywords: Stochastic method, HVSR, Nonlinear site response, Rupture directivity
© The Author(s) 2017. This article is distributed under the terms of the Creative Commons Attribution 4.0 International License (http://creativecommons.org/licenses/by/4.0/), which permits unrestricted use, distribution, and reproduction in any medium, provided you give appropriate credit to the original author(s) and the source, provide a link to the Creative Commons license, and indicate if changes were made.
Background
On February 6, 2016, at 03:57 local time (UTC + 8), an earthquake of magnitude 6.6 on the Richter scale occurred in the Meinong District of Kaohsiung City, Tai-wan. According to the Central Weather Bureau (CWB) report, the epicenter was located at 22.92°N 120.54°E and had a focal depth of 14.6 km. The CWB-defined intensity of the Meinong earthquake reached level 7 and the earthquake, which caused widespread damage and 117 deaths, was felt all over the island of Taiwan. The epicenter of the earthquake was located in the Meinong District in Kaohsiung City. However, the worst affected city was Tainan. This may have been due to the strong amplification of surface ground motion by shallow veloc-ity structure and soil liquefaction that occurred during
strong shaking, which caused many houses in the areas with soft soil deposits to sink or tip. The shallow velocity structure of the Chianan plain was investigated using the microtremor array analysis (Kuo et al. 2016a). The soil response was simulated (Chen et al. 2016) by consider-ing the shallow structure, and the results revealed that the shallow soft layers influenced the duration of seismic wave shaking and ground motion amplification in the Tainan area.
Darragh and Shakal (1991) analyzed spectral ratios for two rock and soil station pairs and estimated the site response from weak and strong ground motions. They revealed that the amplification factor in the fre-quency domain from weak motions at the soft soil site was approximately 3–8 times greater than that of the mainshock recording and that this phenomenon is explained by the nonlinear response of the soils. Many nonlinear soil amplification researchers have applied the spectral ratios method for soil-to-rock and for
Open Access
*Correspondence: pokayoke69@gmail.com
surface-to-downhole station pairs (Wen et al. 1994, 1995; Beresnev et al. 1995a, b). They indicated that, during nonlinear soil behavior, the spectral ratio from strong motions has lower predominant frequency and amplifi-cation than the spectral ratio from weak motions. After the earthquakes in 1985 in Michoacan, Mexico, and in 1989 in Loma Prieta, California, several large earth-quakes have been recorded by modern digital surface and vertical arrays. Observations around the world estab-lished direct evidence of the significance of nonlinear site effects (Beresnev and Wen 1996). Wen et al. (2006) used the horizontal-to-vertical spectral ratio (HVSR) method to analyze the Large-Scale Seismic Test (LSST) array in Lotung, Taiwan, and found that the HVSR method can be used to identify nonlinear site responses. Noguchi and Sasatani (2008, 2011) proposed a new quantitative index to measure the degree of nonlinear site response (DNL). The DNL showed positive correlations with the observed horizontal peak ground acceleration (PGA) on the ground surface and with VS30.
The stochastic method has been widely used to simu-late high-frequency strong ground motions, and many studies have applied the stochastic method to generate ground motions and investigate site effects in Taiwan. Roumelioti and Beresnev (2003) applied the stochas-tic finite-fault modeling to simulate the strong ground motions of the 1999 earthquake in Chi-Chi, Taiwan. The nonlinear soil response during the Chi-Chi earthquake was quantified by amplification reduction estimated using the spectral ratio technique. Stochastic simula-tions for both point source and extended fault ruptures that used region-specific crustal attenuation and source scaling (D’Amico et al. 2012) successfully predicted the strong motions of the Chi-Chi earthquake. The Empiri-cal Transfer Function (ETF) was constructed as the dif-ference in frequency spectra between the observed and synthetic ground motions, using the stochastic point source approach for the Taipei basin (Huang et al. 2017). The ETF well described the site response in Taipei basin and can provide more accurate site correction for future earthquake ground motion simulations. However, they did not consider the nonlinear site effect to construct the ETF. In addition, Kamae et al. (1998) proposed a new hybrid technique that combined the stochastic method generating high-frequency motions with the long-period motions calculated by the 3D finite-difference method to simulate the broadband near-fault ground motions.
In this study, we incorporated a newly developed attenuation model, which contained the frequency-dependent Q (Chang et al. in preparation) and the high-frequency decay factor κ0 used to generate the Meinong
mainshock strong ground motions in the Chianan area, in stochastic finite-fault simulations. We calculated
weak and strong motion HVSR as the site amplifications for the simulation of stochastic ground motion and obtained DNL values to identify the degree of nonlinear site response. Areas with high nonlinear site response during the Meinong earthquake were determined using the residuals of the predicted site-corrected PGA between the HVSR of weak motions and the main-shock. The asymmetrical distribution of PGA residuals obtained by our model may also indicate the amplifi-cation of the rupture directivity during the Meinong earthquake.
Methods
analysis of the ground motion simulation by two differ-ent site corrections using weak and strong motion also indicates the importance of the nonlinear site effect in ground motion prediction especially in regions with soft deposits. We analyzed the residuals of the observed and simulated PGA and compared them with the azimuth to determine the influence of source rupture directivity. The Ground Motion Prediction Equation (GMPE) was applied to verify our results. The amplification of the source for-ward rupture directivity was estimated, and the forfor-ward and backward rupture directivities were determined.
H/V spectral ratio
High-quality strong motion data for the Meinong earth-quake were recorded by the Taiwan Strong Motion Instrument Program (TSMIP; Tsai and Lee 2005) and
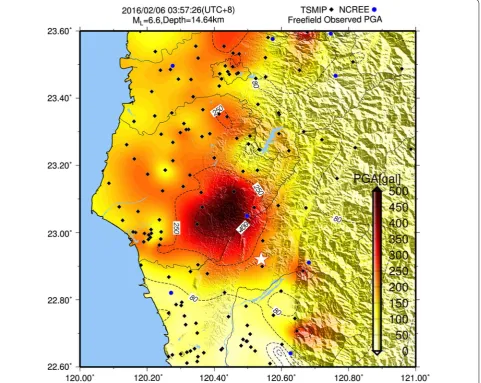
provided by the Geophysical Database Management System (GDMS; Shin et al. 2013) of the CWB. Fig-ure 1 shows the PGA ShakeMap of the Meinong earth-quake near the source regions. The maximum PGA reached level 7 and was recorded as 445 and 417 cm/ s2 at CHY062 and CHY063, respectively, which were
located within 24 km of the epicenter. The anomalously large ground motion was detected in the northern area of the epicenter and formed an asymmetrically distrib-uted PGA ShakeMap. The strong shaking also caused soil liquefaction around the Sinshih and Annan districts, Tainan City. In this study, we analyzed 120 stations within our study domain [between 22.6°–23.6° north (N) and 120°–121° east (E)] that were near the source regions and that recorded the Meinong earthquake. Wen et al. (2006) concluded that the S-wave spectral ratio of
horizontal to vertical (S–H/V) can be used to identify the nonlinear site response. Thus, the S–H/V at each station was calculated to investigate the nonlinear site response during the Meinong earthquake. The S–H/V of mainshock and weak events was also applied to the site amplification function for stochastic simulation in the next section. Spectral ratios were calculated as follows (Beresnev and Wen 1996): (1) After baseline correction, the shear wave was identified and selected and the mean value of each trace was obtained; (2) a 5% cosine-tapered window was applied to both sides; (3) the Fourier ampli-tude spectrum was calculated; (4) the spectrum was smoothed five times using Hanning window averages; (5) the root mean square spectra from the EW and NS horizontal components were calculated; (6) the HVSR was calculated. These values were used to calculate the variation of S–H/V during the Meinong earthquake. The weak events were also calculated with S–H/V used as a reference. Other weak motion earthquake records from TSMIP between 1991 and 2014 with the following criteria were also used in this study: (1) PGA ≥ 10 cm/ s2 recorded by one of the three components; (2)
PGA ≤ 50 cm/s2; (3) M
L < 6. Figure 2 shows the
com-parison of spectral ratios for the Meinong mainshock
and weak events at eight stations. Some of the stations showed significant differences between the S–H/V of strong motion and weak events, whereas others did not. The nonlinear soil response during strong motion events is a possible reason for this discrepancy. The HVSR of weak and strong motion was used to calculate the DNL values and applied to the stochastic simulation as the amplification function.
Degree of nonlinear site response
We investigated the nonlinear site response by calcu-lating the index of the DNL to quantify the differences between the ratio for strong motion and the ratio for weak motion. The DNL is defined as follows:
where HVRstrong is the spectral ratio for the strong
motion and HVRweak is the spectral ratio for the weak
motion. While the strong motion only considered the Meinong mainshock, the spectral ratio of the weak motion was averaged using the historical weak events. In this analysis, the sum of the frequency range was from
(1)
DNL=
20
0.5
HVRstrong
HVRweak
·f
0.5 to 20 Hz. The relationship between DNL, the level of ground motion, and site conditions is shown in Fig. 3. The DNLs were categorized into four classes based on the site classification of the stations, which was evaluated from the well logging data by the Engineering Geological Database for TSMIP (EGDT, Kuo et al. 2011, 2012). The DNL values increased slightly as PGA increased (Fig. 3a), and there was a positive correlation although the slope was not steep. The slopes of the trend line for three site classes were similar, but the amplitude of site E was larger than the amplitude of sites C and D. We also examined the relationship of the same DNL with peak ground velocity (PGV) (Fig. 3b) and the ratios of PGV and VS30
(Fig. 3c) and found a stronger correlation between DNL and PGV than with PGA. The trend lines for the three sites had clearly changed; site E showed a steeper slope than site D and site C showed the lowest slope. Neverthe-less, there was a correlation between DNL and the ratios of PGV and VS30. The trend lines of the three site classes
also showed similar slopes and amplitudes, because the PGV/VS30 ratio already included the site
condi-tions. These results indicate that PGV is a better ground motion parameter that correlates with DNL values. Fig-ure 4 shows the distribution of DNL overlapping with the PGA of the Meinong earthquake, and the analysis indi-cates that the DNL values are influenced by the level of ground motion and are characteristic of surface geology. However, we cannot ignore the effect of fluctuations on the HVSR technique and the subsequent calculation of DNL.
Results and discussion
Parameters for the stochastic simulation
We used the stochastic method to simulate 120 stations within the study domain (between 22.6°–23.6°N and 120°–121°E), using the fault model and the focal mecha-nism given by Lee et al. (2016). The rectangular fault was 45 × 25 km with a 281° strike and a 24° dip. Based on
the empirical relationship (Beresnev and Atkinson 2002), each subfault was divided into 3 × 2 km; therefore, the
fault plane had 15 × 13 subfaults. Figure 5 shows the
dis-tribution of the stations and the slip model that we used. Following the EXSIM stochastic finite-fault approach, the source rupture velocity was constant and was cal-culated as 0.8 × shear-wave velocity. The shear-wave
velocity in this study was 3.6 km/s; thus, based on the dimensions of the fault, the rupture process only lasted around 10 s. However, according to Lee et al. (2016; see Fig. 2), asperity II mainly grows after 10 s. Therefore, when we applied the slip model directly to the stochastic finite-fault approach, we found that asperity II contrib-uted to ground motion for about 6 s. Thus, it was unrea-sonable to use the slip model directly for our stochastic finite-fault approach. Consequently, we slightly reduced the weighting of asperity II in the slip model to obtain the best validation model. The Mw value (6.47) of the
Meinong earthquake was applied to the stochastic model, and the stress drop was 80 bar, as previously reported by D’Amico et al. (2012).
We used a newly developed regional attenuation model to calibrate the stochastic simulation. The
frequency-dependent parameter of the regional attenu-ation model was set to Q = 86.4f0.73, as estimated from
the shear-wave analysis by Chang et al. (in preparation). Geometrical spreading was given by 1/Rb, where b = 1.0
for R < 50 km, b = 0 for 50 km ≦ R ≦ 170 km, and b = 0.5 for 170 km ≦ R, for stochastic simulations in Taiwan (Sokolov et al. 2001, 2003, 2006, 2009). Crust ampli-fication (Atkinson and Boore 2006) was determined using a frequency-dependent amplification function for generic rock sites categorized into site A (very hard rock) in Eastern North America (ENA-A). Since Taiwan lacks the site A station, ENA-A was applied to the crust amplification of stochastic modeling in Taiwan. Moreo-ver, amplifications of less than 1.2 on very hard rock sites have a limited influence on our simulation. The κ0
factor is a distance-dependent parameter that affects
the high-frequency attenuation. Larger κ0 values
indi-cate that the site condition has a large degree of high-frequency attenuation. The combined effect of generic rock amplification and κ0 diminution was given by Boore
and Joyner (1997; see Fig. 8). κ0 is a key parameter for
the description of high-frequency ground motions and varies greatly even at the same site conditions (Atkin-son 1996). Therefore, in this study, we applied a newly developed Taiwanese κ0 model that analyzed from
33,756 TSMIP earthquake records. In this method of κ0
analysis, κ0 was calculated using the decay slope of the
SH-wave spectrum between the frequency bands fE and
fX, where fE is the beginning frequency of the spectral
amplitude following an exponential decay and fX is the
end frequency of the spectral amplitude following an exponential decay. Diminution is defined as follows:
Based on the definition of κ0, we utilized κ0
diminu-tion in the stochastic method, with individual κ0 and fE
parameters for each station. The difference between our
κ0 diminution and the default treatment in EXSIM is
shown in Fig. 6. Our κ0 diminution showed less
attenua-tion than that of the default and the fE parameters
domi-nated the shape and amplification of diminution, even for the stations with similar κ0 values. Table 1 summarizes all
the parameters used in the synthetic model.
Site correction of the stochastic simulation
After EXSIM stochastic modeling, we adopted the HVSR of the Meinong mainshock and weak events for the site correction of each station. The synthetic waveform was converted to a Fourier spectrum using the fast Fourier transform (FFT) algorithm and then multiplied by the amplification function of the HVSR of each station. The
(2) d
f
=exp
−π κf −fE
.
Fig. 5 Slip model that we applied in the stochastic model and the map showing the 120 target stations, represented by black solid diamonds. Red lines show the main faults around the area. The gray circles indicate the aftershocks of the Meinong earthquake. The focal mechanism and slip distribution are given by Lee et al. (2016)
Fourier spectrum that was amplified with the HVSR was inverse-fast-Fourier-transformed to obtain the syn-thetic waveform after site correction. The schematic procedure of site correction is shown in Fig. 7. The site-corrected synthetic ground motion showed significant improvement in the waveform pattern and PGA in the time domain. The Fourier spectrum also had a substan-tial improvement in the frequency domain. Thus, we achieved satisfactory results in the use of HVSR for site correction to improve the ground motion simulation using the stochastic method.
Model validation
There were insufficient rock stations located near the seismogenic fault of the Meinong earthquake. Moreover, the Meinong earthquake showed an asymmetrical inten-sity distribution, which may be caused by rupture direc-tivity and site amplification (Lee et al. 2016). Hence, we used all 120 stations within the study domain to validate the stochastic models. The model bias, calculated as the logarithm (base 10) of the ratio of the observed to the simulated Fourier spectra and averaged over 120 sites, is shown in Fig. 8. We compared the model bias calculated
Table 1 Modeling parameters
Parameter Parameter value
Fault orientation strike/dip 281°/24°
Fault dimension (km) 45 × 25
Subfault dimensions 3 × 2
Slip distribution Lee et al. (2016)
Crustal shear‑wave velocity (km/s) 3.6
Crustal density (g cm−3) 2.8
Rupture velocity 0.8 × shear‑wave velocity
Anelastic attenuation, Q(f) 86.4·f0.73 (Chang et al. in preparation)
Kappa (s) 0.046–0.077 Kappa for each site
Geometrical spreading
G(R)=
1
RR≤50 km 1
R050<R≤170 km 1
R0.5170<R
Stress drop Δσ (bar) 80
Crustal amplification Atkinson and Boore (2006) Eastern North America generic rock site
with and without site correction using the HVSR of the mainshock and the weak events. The bias model A (Fig. 8a) is the synthetic model with default κ0
diminu-tion in EXSIM stochastic modeling, and the bias model B (Fig. 8b) is the newly developed κ0 diminution with fE
parameters. While bias model A showed underestima-tion in the high frequency band, model B showed calibra-tion with flat bias. The applicacalibra-tion of fE parameters in this
study is novel and resulted in a better bias model than the default.
Site-corrected simulations using the HVSR of the main-shock and weak events both fit well with the observed data. The differences in HVSR between the mainshock and the weak events could be due to nonlinear soil effects during strong ground motions.
In Fig. 9, we compared site-corrected synthetic wave-forms using mainshock HVSR with observed wavewave-forms at twelve stations uniformly distributed around the northern and southern areas of the seismogenic fault. The whole waveform trace lasted 40 s, and in most cases, the envelop, duration, and PGA of synthetic ground motions matched the observed waveforms well.
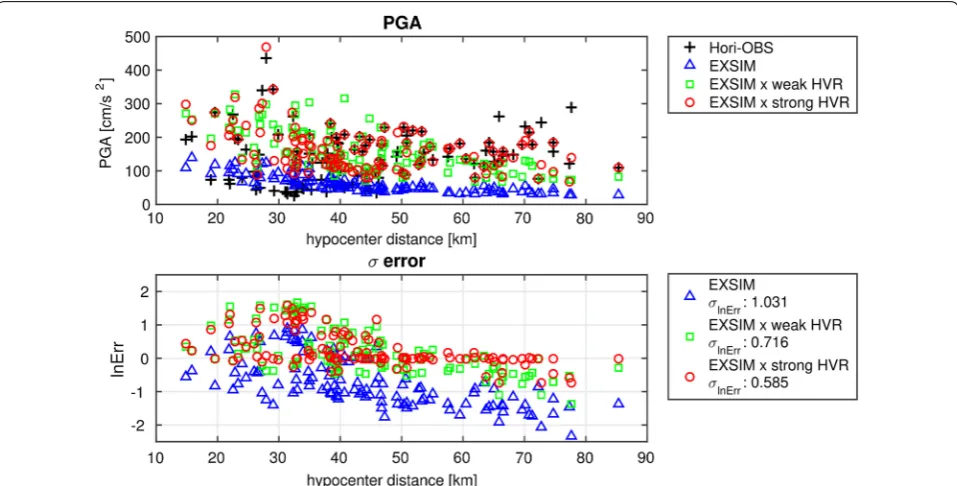
We quantified the ability of using EXSIM stochastic modeling to predict PGA. The misfit (σln Err) for PGA
residuals is defined as follows:
where N is the number of stations, PGAO is the observed
PGA, which is the root mean square of the peak north– south (NS) and east–west (EW) component values (i.e.,
PGA=
PGA2NS+PGA2EW/2), and PGAS is the
sim-ulated PGA.
Figure 10 shows the comparison of the observed and predicted PGA and the residuals for the Meinong earth-quake; the site-corrected synthetic PGA showed signifi-cant improvement. Without site correction, the misfit was 1.031; the site correction using the HVSR of weak events reduced the misfit to 0.716. The site-corrected synthetic PGA generated using the HVSR of the main-shock had the best misfit of 0.585. The results indicate that the stochastic model can be used as a reputable sim-ulator for the Meinong earthquake.
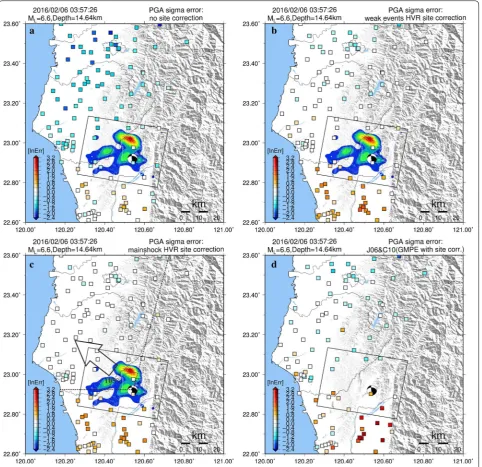
Effects of source rupture directivity
The EXSIM stochastic model that utilizes HVSR for site correction could satisfactorily predict ground motions of the Meinong earthquake. However, the PGA residu-als showed a symmetrical spatial distribution where high residual values were usually located on the north-ern and southnorth-ern azimuth of the seismogenic fault. The residuals showed similar patterns only when the values had different amplitudes (Fig. 11a–c). Kuo et al. (2016b) analyzed the Meinong earthquake records from free-field and borehole arrays and indicated that asym-metrical PGA distribution is mainly caused by rupture directivity. The forward directivity effect was identi-fied from 270° to 15° of the azimuth, with a total range of 105°. Forward rupture directivity effects that occur when the rupture front propagates toward the site cause larger ground motion amplitudes and shorter durations than average directivity conditions. Backward direc-tivity effects that occur when the rupture propagates away from the site cause long duration motions and low amplitudes at long periods (Somerville et al. 1997). In this study, we attempted to correlate the residuals of predicted PGA with the azimuth and the results showed a high correlation (Fig. 12). Most of the positive residu-als were located on the backward range, while negative residuals were located on the forward range; our model
(3)
showed that the simulation overestimated PGA in the backward direction, but underestimated PGA in the forward direction. We could not calibrate the residu-als during the validation step by revising the potential parameters; therefore, the strong source rupture direc-tivity should be the primary cause of the symmetrically distributed residuals. In order to verify this argument, we also used GMPE (Jean et al. 2006; Chang et al.
2010) with site correction to predict the PGA of the Meinong earthquake. The distribution of the residuals is shown in Fig. 11d and the misfit of the GMPE model
is 1.225. Even the GMPE failed to predict the PGA of the Meinong earthquake, the pattern of the residual dis-tribution was similar to that of our stochastic model, where the northern and southern areas were under and overestimated, respectively. This result indicates that the source rupture directivity plays an important role in controlling the characteristics of strong ground motions. Using the average residual from the forward (σln Errf = −0.2) and backward (σln Errb = 0.9) directions,
we estimated the amplification of the forward rup-ture directivity compared with the backward ruprup-ture
directivity. The amplification of the rupture directivity effect Ad can be calculated using the following equation:
Thus, the amplification of the forward rupture directiv-ity effect obtained was three times the backward rupture directivity.
PGA reduction during the Meinong earthquake
We calculated DNL to investigate the nonlinear soil effect of the Meinong earthquake in the frequency domain. Large DNL values indicated de-amplification and a vari-ety of dominant frequencies during strong ground shak-ing. In this study, we simulated the PGA of the Meinong earthquake using a stochastic method that utilizes the HVSR of the mainshock and the weak events. Hence, we could identify the areas with high nonlinear soil effects by calculating the reduction in synthetic PGA using the mainshock HVSR compared to the PGA calculated using the HVSR of weak events. The PGA reduction can be expressed as follows:
(4)
Ad=e
σln Errf
+|σln Errb|
(5)
PGA reduction= PGAstrong−PGAweak
PGAstrong
×100%.
Ideally, PGA will be reduced due to de-amplifica-tion (Boore et al. 1989) occurring during nonlinear soil effects. Hence, the reduction in PGA could reveal the degree of nonlinear soil effects during strong shaking. The contour map of the percent PGA reduction is shown in Fig. 13. The solid diamonds represent the stations that show moderate PGA reduction, and red solid circles rep-resent the stations that show a significant PGA reduc-tion (i.e., more than −30%). The high color intensity in the PGA reduction contour map demonstrates that a high degree of nonlinear soil effects mainly occurred in the area around Tainan City, which is near the mouth of the Zengwun River and the Pingtung Plain. The Meinong earthquake induced major liquefactions around the Sin-shih and Annan districts in Tainan City and caused lat-eral spreading damage of the Rixin embankments at the Danei Bridge of the Zengwun River in the Tainan District (NCREE 2016). The locations that experienced major liq-uefaction are located in areas with high PGA reduction. The contour map of a high percentage of PGA reduction also overlaps with the areas of high liquefaction poten-tial, as shown by a liquefaction potential map published by the Central Geological Survey (http://www.moeacgs. gov.tw/2016.htm, Accessed 25 Dec 2016).
Conclusions
High-frequency ground motion prediction is impor-tant for seismic hazard analysis. Greater accuracy of ground motion prediction could improve seismic hazard
assessment performance and therefore reduce losses in the event of an earthquake. In this study, we calcu-lated the DNL values and applied the stochastic finite-fault method to model the ground motion of the 2016
Meinong earthquake. The directivity and nonlinear effects were investigated in this study.
First, we calculated the S–H/V of the Meinong earth-quake and weak events to investigate the nonlinear site response using DNL, which is a quantitative index that reveals the difference in S–H/V between strong and weak motions. The DNL of S–H/V showed a posi-tive correlation with the measures of ground motion intensity, such as PGA and PGV, particularly PGV. Site conditions influenced the DNL strength; for example, stations belonging to site class E with strong motion PGA above 100 cm/s2 usually had larger DNL values
than sites C or D.
Second, we calibrated the stochastic model for all 120 stations, which provided dense spatial coverage around the source. The source slip model of the Meinong earthquake provided by Lee et al. (2016) was adopted for the finite-fault model. However, the EXSIM pro-gram for stochastic simulation could not handle com-plex rupture processes, as exhibited by the Meinong earthquake. Asperity II of the slip model was revised to be less severe so that the simulated and observed wave-forms and PGA were well matched. Since the contribu-tion of asperity II occurs 10 s after the beginning (Lee et al. 2016), the whole rupture process in the stochastic
finite-fault model theoretically lasts only about 10 s. The results suggested that the stochastic finite-fault technique should be considered when managing the complex rupture behavior. The new attenuation models in Taiwan include frequency-dependent Q (Chang et al. in preparation) and high-frequency decay factor κ0, the
use of which is novel in stochastic finite-fault mode-ling. The performance of our calibrated model was sat-isfactory when these new attenuation parameters were applied.
Third, the area influenced by the rupture directiv-ity was identified with the residual analysis. We deter-mined the forward directivity in the northwest within a 105° range (Fig. 11c), which was consistent with the results of Kuo et al. (2016b) who analyzed the surface and borehole records. Wu et al. (2016) analyzed the records of the Meinong earthquake using a P-alert network and also concluded that the fault plane may be in the NW–SE direction and that the source may have ruptured north-westwardly. We calculated the amplification of forward rupture directivity, which was three times larger than the backward rupture directivity. The amplification of rupture directivity was difficult to apply to the earth-quake simulation because the fault rupture was unpre-dictable and unique; nevertheless, our results provided a description of the amplification of rupture directivity and revealed future challenges for ground motion prediction.
Fourth, we calculated the percentage of PGA reduction that could be an indicator of the spatial distribution of the degree of nonlinear soil effects of the Meinong earth-quake in the time domain. Although the results indicated that S–H/V is useful for site correction in the stochastic method and that the nonlinear effect should be consid-ered essential in ground motion prediction, the strong motion S–H/V is unavailable in earthquake simulations. Hence, creating empirical strong motion S–H/V records for stations that may exhibit nonlinear behavior could likely contribute to the site correction for stochastic earthquake ground motion simulations.
Investigating the characteristics of the site effects is important because the site condition has a complex influence over the amplification of seismic waves or the reduction in PGA. The effect of rupture directivity can-not be ignored; in some cases, rupture directivity may strongly affect the PGA shake distribution. These factors should be considered in ground motion simulations in future studies to improve prediction accuracy.
Authors’ contributions
CTC analyzed the strong ground motion data, including the observations and simulations, and drafted the manuscript. SCC performed the modeling; KLW and SCC calibrated and improved the synthetic results. All authors partici‑ pated in the discussion and the interpretation of the data. All authors read and approved the final manuscript.
Author details
1 Institute of Earth Sciences, Academia Sinica, Taipei, Taiwan, ROC. 2 Depart‑ ment of Earth Sciences, National Central University, Chungli, Taiwan, ROC.
Acknowledgements
The authors would like to thank the Central Weather Bureau and the National Center for Research on Earthquake Engineering for providing the strong motion data. This work was funded by the Ministry of Science and Technol‑ ogy (MOST105‑2811‑M‑001‑058, MOST103‑2625‑M‑008‑017‑MY3) and Taiwan Earthquake Research Center (TEC). The TEC contribution number for this article is (00135). We also thank two anonymous reviewers for their valuable comments and suggestions.
Competing interests
The authors declare that they have no competing interests.
Publisher’s Note
Springer Nature remains neutral with regard to jurisdictional claims in pub‑ lished maps and institutional affiliations.
Received: 21 January 2017 Accepted: 14 April 2017
References
Atkinson GM (1996) The high‑frequency shape of the source spectrum for earthquakes in eastern and western Canada. Bull Seismol Soc Am 86(1):106–112
Atkinson GM, Boore DM (2006) Earthquake ground‑motion prediction equa‑ tions for eastern North America. Bull Seismol Soc Am 96(6):2181–2205. doi:10.1785/0120050245
Beresnev IA, Atkinson GM (2002) Source parameters of earthquakes in eastern and western North America based on finite‑fault modeling. Bull Seismol Soc Am 92(2):695–710. doi:10.1785/0120010101
Beresnev IA, Wen KL (1996) Nonlinear soil response: a reality? Bull Seismol Soc Am 86(6):1964–1978
Beresnev IA, Wen KL, Yeh YT (1995a) Nonlinear soil amplification: its corrobora‑ tion in Taiwan. Bull Seismol Soc Am 85(2):496–515
Beresnev IA, Wen KL, Yeh YT (1995b) Seismological evidence for nonlinear elastic ground behavior during large earthquakes. Soil Dyn Earthq Eng 14(2):103–114. doi:10.1016/0267‑7261(94)00036‑g
Boore DM (2009) Comparing stochastic point‑source and finite‑source ground‑motion simulations: SMSIM and EXSIM. Bull Seismol Soc Am 99(6):3202–3216. doi:10.1785/0120090056
Boore DM, Joyner WB (1997) Site amplifications for generic rock sites. Bull Seismol Soc Am 87(2):327–341
Boore DM, Seekins L, Joyner WB (1989) Peak accelerations from the 17 October 1989 Loma Prieta earthquake. Seismol Res Lett 60:151–166
Chang YW, Jean WY, Chiu SB (2010) Study on the design earthquakes for Kinmen, Matsu and Penhu areas. In: Technical report of national center for research earthquake engineering, Report Number NCREE‑10‑016. (in Chinese with English abstract)
Chang SC, Wen KL, Huang MW (in preparation) Attenuation, source param‑ eters and site effects of S‑waves in Taiwan
Chen CT, Kuo CH, Wen KL, Lin CM, Huang JY (2016) Simulating shallow soil response using wave propagation numerical modelling in the western plain of Taiwan. Terr Atmos Ocean Sci 27(3):359–373. doi:10.3319/ tao.2016.01.06.01(tem)
D’Amico S, Akinci A, Malagnini L (2012) Predictions of high‑frequency ground‑ motion in Taiwan based on weak motion data. Geophys J Int 189(1):611– 628. doi:10.1111/j.1365‑246X.2012.05367.x
Darragh RB, Shakal AF (1991) The site response of two rock and soil sta‑ tion pairs to strong and weak ground motion. Bull Seismol Soc Am 81(5):1885–1899
Huang JY, Wen KL, Lin CM, Kuo CH, Chen CT, Chang SC (2017) Site correc‑ tion of high frequency strong ground motion simulation based on empirical transfer function. J Asian Earth Sci 138:399–415. doi:10.1016/j. jseaes.2017.01.035
Jean WY, Chang YW, Wen KL, Loh CH (2006) Early estimation of seismic hazard for strong earthquakes in Taiwan. Nat Hazards 37(1–2):39–53. doi:10.1007/s11069‑005‑4655‑y
Kamae K, Irikura K, Pitarka A (1998) A technique for simulating strong ground motions from great earthquakes. Bull Seismol Soc Am 88:357–367 Kuo CH, Wen KL, Hsieh HH, Chang TM, Lin CM, Chen CT (2011) Evaluating
empirical regression equations for Vs and estimating Vs30 in north‑ eastern Taiwan. Soil Dyn Earthq Eng 31(3):431–439. doi:10.1016/j. soildyn.2010.09.012
Kuo CH, Wen KL, Hsieh HH, Lin CM, Chang TM, Kuo KW (2012) Site classification and Vs30 estimation of free‑field TSMIP stations using the logging data of EGDT. Eng Geol 129:68–75. doi:10.1016/j.enggeo.2012.01.013
Kuo CH, Chen CT, Lin CM, Wen KL, Huang JY, Chang SC (2016a) S‑wave velocity structure and site effect parameters derived from microtremor arrays in the Western Plain of Taiwan. J Asian Earth Sci 128:27–41. doi:10.1016/j. jseaes.2016.07.012
Kuo CH, Lin CM, Huang JY, Chao SH, Hsu TY, Wen KL (2016b) Strong motions and site effects in the near source region of the Meinong, Taiwan earth‑ quake. In: Proceedings of the 5th IASPEI/IAEE international symposium: effects of surface geology on seismic motion, 15–17 Aug 2016 Lee SJ, Yeh TY, Lin YY (2016) Anomalously large ground motion in the
2016 M‑L 6.6 Meinong, Taiwan, earthquake: a synergy effect of source rupture and site amplification. Seismol Res Lett 87(6):1319–1326. doi:10.1785/0220160082
Motazedian D, Atkinson GM (2005) Stochastic finite‑fault modeling based on a dynamic corner frequency. Bull Seismol Soc Am 95(3):995–1010. doi:10.1785/0120030207
NCREE (2016) The February 6, 2016 ML‑6.6 Meinong, Taiwan Earthquake and Lessons Learned, comprehensive reconnaissance reports. http://www. eqclearinghouse.org/2016‑02‑taiwan/reconnaissance‑reports Accessed 26 July 2016
Noguchi S, Sasatani T (2008) Quantification of degree of nonlinear site response. In: The 14th world conference on earthquake engineering, Oct 12–17, Beijing
Noguchi S, Sasatani T (2011) Nonlinear soil response and its effects on strong ground motions during the 2003 Miyagi‑Oki intraslab earthquake. Zisin 63(3):165–187 (in Japanese with English abstract)
Roumelioti Z, Beresnev IA (2003) Stochastic finite‑fault modeling of ground motions from the 1999 Chi‑Chi, Taiwan, earthquake: application to rock and soil sites with implications for nonlinear site response. Bull Seismol Soc Am 93(4):1691–1702. doi:10.1785/0120020218
Shin TC, Chang CH, Pu HC, Lin HW, Leu PL (2013) The geophysical database management system in taiwan. Terr Atmos Ocean Sci 24(1):11–18. doi:10.3319/tao.2012.09.20.01(t)
Sokolov V, Loh CH, Wen KL (2001) Site‑dependent design input ground motion estimations for the Taipei area: a probabilistic approach. Probab Eng Mech 16(2):177–191. doi:10.1016/s0266‑8920(00)00021‑7
Sokolov VY, Loh CH, Wen KL (2003) Evaluation of hard rock spectral models for the Taiwan region on the basis of the 1999 Chi‑Chi earthquake data. Soil Dyn Earthq Eng 23(8):715–735. doi:10.1016/s0267‑7261(03)00075‑7 Sokolov V, Loh CH, Jean WY (2006) Strong ground motion source scaling and
attenuation models for earthquakes located in different source zones in Taiwan. In: Proceeding of 4th international conference on earthquake engineering, Taipei, Taiwan, Paper No. 003, Oct 12–13
Sokolov V, Wen KL, Miksat J, Wenzel F, Chen CT (2009) Analysis of Taipei basin response for earthquakes of various depths and locations using empirical data. Terr Atmos Ocean Sci 20(5):687–702. doi:10.3319/ tao.2008.10.15.01(t)
Somerville PG, Smith NF, Graves RW, Abrahamson NA (1997) Modification of empirical strong ground motion attenuation relations to include the amplitude and duration effects of rupture directivity. Seismol Res Lett 68:199–222
Tsai YB, Lee CP (2005) Strong motion instrumentation programs in Taiwan. In: Gülkan P, Anderson JG (eds) Directions in strong motion instrumenta‑ tion. Nato science series: IV—earth and environmental sciences, vol 58. Springer, Dordrecht. doi:10.1007/1‑4020‑3812‑7_16
Wen KL, Beresnev IA, Yeh YT (1994) Nonlinear soil amplification inferred from downhole strong seismic motion data. Geophys Res Lett 21(24):2625– 2628. doi:10.1029/94gl02407
Wen KL, Beresnev IA, Yeh YT (1995) Investigation of nonlinear site amplification at two downhole strong ground motion arrays in Taiwan. Earthq Eng Struct Dyn 24(3):313–324. doi:10.1002/eqe.4290240302
Wen KL, Chang TM, Lin CM, Chiang HJ (2006) Identification of nonlinear site response using the H/V spectral ratio method. Terr Atmos Ocean Sci 17(3):533–546