High-resolution maps of Coda
Q
in Japan and their interpretation by the
brittle-ductile interaction hypothesis
Anshu Jin and Keiiti Aki∗
Association for the Development of Earthquake Prediction and National Research Institute for Earth Sciences and Disaster Prevention
(Received January 18, 2005; Revised March 16, 2005; Accepted March 18, 2005)
Using seismograms recorded at 582 Hi-net stations for earthquakes located within 30 km from each station, we measured codaQfor frequency bands of 1–2, 2–4, 4–8, 8–16, and 16–32 Hz, respectively. Then codaQmaps are constructed with average station spacing of 20 km over Japan, except the Hokkaido Island. The most striking feature of the obtained maps is the significant spatial variation within Japan, up to a factor of 3 for the lower frequency bands, as well as its strong frequency dependence. Such high spatial resolution was not possible to achieve without the high density and sensitivity of the Hi-net. We found several low codaQregions for frequency band of 1–2 Hz including the southwestern Shikoku, eastern Shimane-western Tottori along the Japan Sea coast and the disjointed spots along the Pacific coast from the Kanto-Tokai region to southern edge of the Kii-peninsula. However, the most conspicuous low codaQzone is a narrow belt from Niigata towards south-west to the Biwa lake along the Japan Sea coast. This low Q zone appears at frequency bands of both 1–2 and 2–4 Hz, and it coincides with the zone of high deformation rate revealed from the GPS data. For frequency bands 4–16 Hz (2–4 Hz in Kyushu), the low codaQareas agree with volcanic and geothermal areas. For frequency band of 16-32 Hz, the codaQis distributed nearly uniformly throughout the study area.
Key words:Hi-net, codaQ, brittle zone, ductile zone.
1.
Introduction
Coda waves of local earthquakes have been studied ex-tensively since Aki (1969), and the properties of coda waves were summarized by Sato and Fehler (1998) in a systematic mannered book. Coda wave record is usually represented by the time-dependent power spectrum P(ω| t). The first attempt to predict the explicit form of P(ω | t)was made by Aki and Chouet (1975) assuming that coda waves are singly back-scatteredSwaves. They obtained the following formula for a station collocated as the earthquake source.
P(ω|t)= 2g(π)|S(ω)|
2
βt2 exp(−ωt/Qc) (1)
whereωis the angular frequency,t is time measured from the original time of the earthquake,S(ω)is the source spec-trum,β is S-wave velocity, g(π)is back scattering coeffi-cient, and Qc, called “coda Q”, is the measure of the en-ergy loss suffered by the scattered waves. The details of the derivation of Eq. (1) is described by Aki (1981) as well as by Sato and Fehler (1998) in slightly different terms.
What the coda Q means precisely is still controversial, partly because there are several plausible answers to the question. Within the context of the single backscattering model, coda Qappears to present an effective attenuation ∗Also at Observatoire Volcanologique de Piton de la Fournaise of the
Institut de Physique du Globe, Paris.
Copy right cThe Society of Geomagnetism and Earth, Planetary and Space Sci-ences (SGEPSS); The Seismological Society of Japan; The Volcanological Society of Japan; The Geodetic Society of Japan; The Japanese Society for Planetary Sci-ences; TERRAPUB.
including both absorption and scattering loss. This idea was supported by the close agreement between codaQand S-wave Q observed in the Kanto region by Aki (1980). More recently, Sarker and Abers (1998) compared the coda
Q with S-wave Q measured using seismograms recorded at two seismic arrays in Caucasus and Kopet Dagh (Turk-menistan), Their results demonstrated that coda Q agrees with S-wave Q in both areas. Jannaud et al.(1991) con-firmed the validity of Eq. (1) numerically.
On the other hand, based on an energy-flux model, Frankel and Wennerberg (1987) suggested that coda Q is intrinsic loss. Gusev (1995) demonstrated that the coda de-cay may be quantitatively explained if the scattering coeffi-cient decreases with depth that causes the leakage of scat-tering energy to the bottom and such loss cannot be dis-criminated from the intrinsic loss. Applying the radiative transfer theory Wu (1985) proposed a method to estimate the relative contribution of scattering and intrinsic loss to the total attenuation. Wu’s method was improved later to the “Multiple Lapse Time Window Analysis” by Felheret al.(1992). This method was applied to data in Japan (Felher
et al., 1992; Hoshiba, 1993), Hawaii (Mayedaet al., 1992) and California (Mayedaet al., 1992; Jinet al., 1994). Jinet al.(1994) compared the observed codaQwith the intrinsic, scattering and totalQin each area and found that codaQis bounded between the total Qand intrinsic Q, empirically. The relative contribution of the scattering attenuation and intrinsic absorption varies from region to region and also depends on frequency. It is necessary to take into account the depth dependence of total scattering coefficient and in-trinsic absorption in addition to seismic velocity for a more
404 A. JIN AND K. AKI: CODAQMAP IN JAPAN
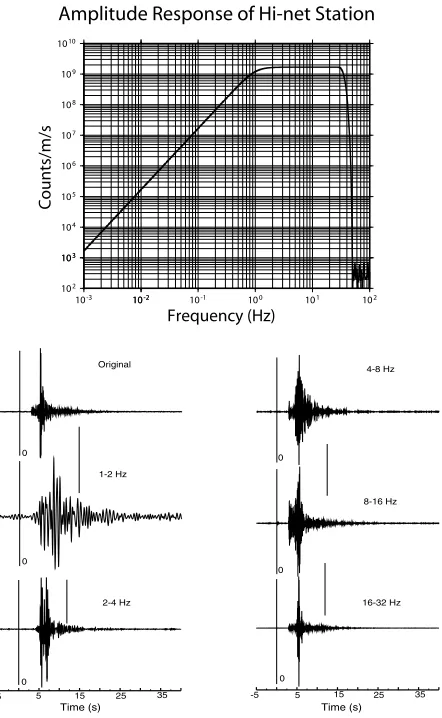
Fig. 1. The overall frequency response of the Hi-net system (top) and a representative original seismogram and its corresponding octave seis-mograms (bottom). The station is in Kyushu, and earthquake is about 10 km away. The thin vertical lines indicate the starting time of coda that is slightly different for each octave seismograms due to the phase shift for different frequency bands. And the ending time of coda is 30 second in lapse time or the signal-to-noise ratio=2, whichever comes first.
complete understanding of codaQ.
Nevertheless, coda Q is an interesting geophysical pa-rameter that show strong correlation with seismicity in both space (e.g., Jin and Aki, 1988) and time (e.g., Jin and Aki, 1989). Results from numerous studies on codaQover the last two decades (e.g. Singh and Herrmann, 1983; Hoshiba, 1993; Mitchellet al., 1997; Baqer and Mitchell, 1998) show that codaQvaries systematically with the tectonic activity by more than an order of magnitude as summarized by Sato and Fehler (1998) and by Mitchell and Cong (1998). How-ever, the spatial resolution of the coda Q maps from ear-lier studies was low because of the large station spacing as well as the use of relatively distant earthquakes. The Hi-net, established and operated by NIED, nearly uniformly dis-tributed over Japan with a station spacing of 20 km with the high local seismicity, offers an opportunity to study spatial distribution of codaQwith unprecedented high resolution.
2.
Data and Method
The Hi-net started to offer its uniform and stable wave-form data from the end of 2000 for Kyushu, Shikoku,
and Honshu in Japan. In this study we use seismograms recorded at 582 Hi-net stations over Japan, except the Hokkaido Island, for earthquakes occurring from January 2001 through July 2004. For each Hi-net station we search for earthquakes with magnitude 1.5–3.0 located within 30 km from the station with focal depth 5–30 km. Thus, we can have sufficient coda length with the high S/N ratio to estimate coda Q by restricting the lapse time within 30 sec. According to the single backscattering model, 30 sec lapse time corresponds to the farthest scatterers being lo-cated within 45 km from the station (See a confirmation of this rule for southern California in Aki, 1996). We were able to find 10 to 20 earthquakes meeting the above re-quirements for each station. Each original seismogram was band-pass filtered to 5 frequency bands: 1–2, 2–4, 4–8, 8– 16 and 16–32 Hz. A 5-second moving lapse time window, overlapping with the neighbours by 2.5 second, was applied to calculate P(f | t), then coda Qis calculated by fitting Eq. (1) for each frequency band and averaged over 3 com-ponents. For each station, we averaged codaQover earth-quakes for each frequency band. Totally, about 20,000 orig-inal seismograms were analyzed. Figure 1 shows the overall frequency-response of the Hi-net system and a representa-tive original and band-pass filtered seismograms recorded at station MISH, Kyushu for an M2.1 earthquake about 10 km away. The frequency dependence of codaQ is repre-sented by the power law parameter, calculated by fitting the relationship ofQ(f)= Q0fγ for each station, where Q0
is codaQat f =1 Hz.
3.
Results
The codaQmeasured at 582 Hi-net stations by the proce-dure described above are smoothed at 0.1 degree square in latitude and longitude and mapped using GMT (Wessel and Smith, 2001) as shown in Fig. 2(a)–(e) for frequency bands of 1–2, 2–4, 4–8, 8–16, and 16–32 Hz, respectively. Fig-ure 2(f) shows a map forγ; the parameter of frequency de-pendence of codaQ. The most surprising feature of Fig. 2 is the large spatial variation of codaQwithin Japan for the lower frequency bands as well as its frequency dependence. Hoshiba (1993) measured coda Q for frequency bands of 1–2, 2–4, and 4–8 Hz at 16 JMA stations over Japan. How-ever, the spatial variations were smooth partially because of the use of long lapse-time window and partially because of the sparseness of stations. The high-resolution codaQmap shown in Fig. 2 could never be constructed without bene-fits of the high density and high sensitivity of the Hi-net stations.
3.1 The low codaQregions at lower frequency bands (1) The southwestern Shikoku Island and the disjoined small areas along the Pacific coast from the Kanto-Tokai region to southern edge of the Kii-peninsula show low coda
Q, corresponding to the epicentral area of great earthquakes caused by the subduction of the Philippine Sea plate. It is interesting to note that the low Qis significant only for frequency band of 1–2 Hz, suggesting relatively larger size of the scatterers in the area.
de-Fig. 2. Spatial distribution of codaQfor the 5 octave frequency bands (a)–(e) and its frequency dependence (f). The scale ofQvalue is shown in the bottom of each sub-figure. The locations of the areas mentioned in the text are indexed in Fig. 3.
pendence. As well known, an Mw 6.6 earthquake occurred in 2000 in this area.
(3) The most conspicuous low coda Q region is found for a narrow zone from Niigata to the Biwa Lake along the Japan Sea coast. This low coda Qzone is significant for frequency bands of 1–2, and 2–4 Hz. This low Q
zone fits remarkably well with the zone of concentrated deformation revealed from GPS data observed during June 1996 to May 2000 (Sagiya et al., 2000). The Mw 6.8 Niigata earthquake occurred in the low coda Q zone in 2004, a month after we recognized the coincidence of the zone with the concentrated deformation zone.
For frequencies higher than 4 Hz the lowQzone appears shifted toward the north and connecting with the low Q
areas corresponding to the volcano chain in the western Tohoku region of Japan. This is consistent with Matsumoto and Hasegawa (1989).
3.2 The low codaQregions for higher frequency bands (1) From north to south along the central Kyushu Island, the low coda Q zone is significant at frequencies 2–4 and 4–8 Hz. This low coda Qzone coincides with the areas of active volcanoes.
(2) The Suruga Bay area along the Pacific coast shows significant low codaQarea at frequency 2–4 Hz.
(3) The low codaQzone along the Tohoku volcano chain appears as small spots for frequency 2–4 Hz and becomes
406 A. JIN AND K. AKI: CODAQMAP IN JAPAN
most significant for 4–8 Hz, then turns back to small spots for 8–16 Hz.
For frequency band 16–32 Hz, as shown in Fig. 2(e), the coda Q distribution is nearly uniform over the study re-gion indicating that the uniform distribution of smaller scale scatterer over the study region. However, the active volcano regions in Kyushu and NE Japan still have relatively low codaQ. And the codaQalong the Japan Sea coast reminds to be lower relative to that along the Pacific Ocean coast as revealed by Matsumoto and Hasegawa (1989).
4.
The Concentrated Deformation Zone (NKTZ)
with low coda
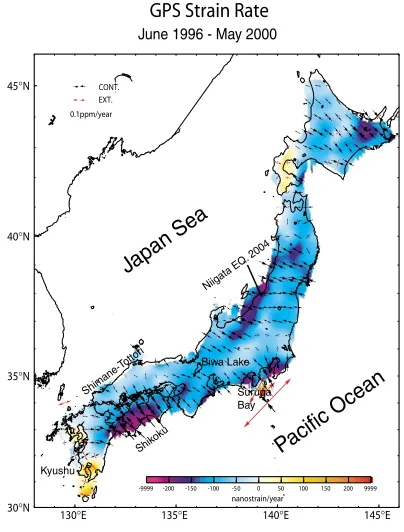
QSagiyaet al.(2000) discovered several regions of signif-icantly high strain rate in Japan, as shown in Fig. 3, where the strain rate was calculated using ground velocity ob-served by the GPS network (GEONET) during the period from June 1996 to May 2000.
Comparing Fig. 3 with 2(a) and 2(b), we find that all the high strain rate regions (except the one in the Hokkaido Island) are coincident with the low coda Q regions, the western Shikoku, the Kanto-Tokai along the Pacific coast, and the Niigata to Biwa-lake low Q zone. The last one is particularly interesting to us because it is a region of large intraplate earthquakes, including the M6.8 earthquake (138.87E, 37.29N, h = 13 km) occurred in the central Niigata region, at Oct. 23, 2005, shortly after this codaQ
map has been constructed. We shall focus our discussion on this zone of low codaQand high strain rate.
The high strain rate zone along the Japan Sea coast has been named as Niigata-Kobe Tectonic Zone (NKTZ) by Sagiyaet al.(2000). The observed difference in deforma-tion rates between the NKTZ and its surrounding is almost one order of magnitude (Sagiyaet al., 2000). To produce such a significant difference in deformation rate requires a strong stress concentration in the NKTZ unless there is strong regional variation on the stiffness/viscosity in the re-gion. Among various models proposed by Shimazaki and Zhao (2000), Mazzotti et al. (2000), Miyazaki and Heki (2001), and Iioet al.(2002, 2004), we are particularly in-terested in the last one, who attributed the concentrated de-formation to the low viscosity in weak zone(s) existing in the lower crust of the lithosphere.
Zoback and Zoback (2002) offered a new perspective on the role of ductile part of the lithosphere during the earth-quakes loading processes by plate-driving forces from a global study of tectonic stress. Assuming that the litho-sphere consisting of 3 layers; the brittle upper crust, the ductile lower crust, and the upper mantle, supports plate-driving forces as a whole, they conclude that because of the applied forces to the lithosphere would result in steady-state creep in the lower crust and upper mantle, as long as the three-layer lithosphere is coupled, stress will build up in the brittle upper crust due to the creep deformation in the layer below. Hence, the tectonically stable region is stable because of the low deformation rate in the ductile part and the active region is active because of the high deformation rate in the ductile part. This model is similar to that of Iio
et al.(2002, 2004) in supporting the idea of which viscosi-ties in the ductile zone control the intraplate deformation in
the overlying brittle part. But there is an important differ-ence between them; the former is in the domain of global spatial scale and geological time scale, while the latter is in that of regional spatial scale and time scale of years to decades. Obviously the latter is more relevant to the issue of earthquake prediction.
Jin and Aki (1989, 1993) studied the temporal and spatial correlation between codaQ−1and seismicity in both
south-ern and central California. They defined the frequency of earthquakes in a specified magnitude range aroundMc rel-ative to the total frequency as N(Mc)(in %) and found a remarkable positive correlation between the temporal vari-ation ofQ−c1andN(Mc)for over 50 years in both regions. The correlation coefficient reached its peak (around 0.8) at the zero time shift for a choice of Mc 3–3.5 for south-ern California and 4–4.5 for central California. To explain this observation, Jin and Aki (1989, 1993) proposed the “creep model” in which the ductile fractures in the brittle-ductile transition zone of lithosphere have a characteristic size comparable with the source dimension of an earthquake with magnitudeMc(a few hundred meters for southern Cal-ifornia and roughly a km for central CalCal-ifornia). Under the loading of the plate-driving forces, the increase in the density of ductile fractures increases the coda Q−1 and, at
the same time, generates stress concentration with the same scale length as the size of the ductile fracture responsible for the increase in relative frequency of earthquakes with magnitude around Mc. This model agrees with Iioet al. (2004) but requires much smaller characteristic scale length of fractures in the lower crust weak zone than envisioned by them. As pointed out by Iioet al.(2002), the high3He/4He
ratio and high conductivity observed in the NKTZ suggests that the brittle-ductile transition zone in the NKTZ is weak-ened by fluid (water) from the upper mantle, the fractures in the ductile zone could be the fluid container. And the strong frequency dependency of codaQshown in Fig. 2(f) indicates that the fractures indeed have a characteristic size. Benites (1990) found by numerical simulations that Q−1
c has a peak atkd=2, wherekis the wave-number andd is the length of a crack assumed as the scatterer. In the case of NKTZ, the peak of Q−c1appears in the frequency band of 1–4 Hz, corresponding scatterer’s size in the range from a few hundred meters to a km for theS-to-Sscattering.
5.
The Spatial Distribution of
N(
Mc)Recently, Aki (2004) noticed that the simultaneous posi-tive correlation between Q−1
c andN(Mc)obtained for the 50 year-period by Jin and Aki (1989, 1993) for Califor-nia, was disturbed for several years before the 1952 M7.5 earthquake, Kern County, California and the 1989 M7.1 earthquake, Loma Prieta, California. Jinet al.(2004) ex-tended the analyses of temporal variation of codaQ−1and
N(Mc)for central and southern California and applied a 10-year moving time window to calculate the cross-correlation betweenQ−c1 andN(Mc). They found that the simultane-ous correlation was disturbed before all major earthquakes (M ≥ 7) occurred in the study region. The disturbance is, consistently, a delay in the fluctuation of coda Q−1
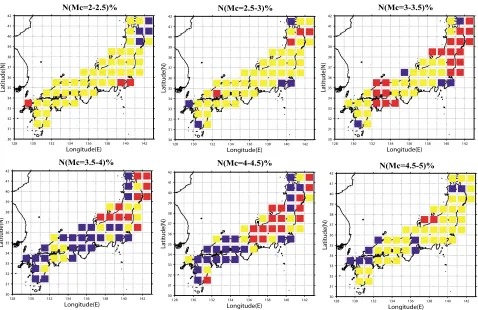
hy-Fig. 4. Distribution ofN(Mc)%. N(Mc)% is the relative frequency of earthquakes magnitude (Mc) in a certain range as shown in the top of each sub-figure and it is calculated for 1◦square and smooth with 0.5◦. The red, blue, and yellow represent where theN(Mc)% is larger than, smaller than or equal to the (average±1 standard error).
pothesis” of earthquake loading processes by plate-driving forces proposed by Aki (2004), the coda Q−1 represents
the density of the fractures in the ductile part of lithosphere, andN(Mc)represents the response of the brittle part to the stress induced by the ductile fracture. In thenormal load-ing process the interaction between the ductile and brittle parts of the lithosphere is harmonic leading to the simulta-neous positive correlation between coda Q−1 andN(Mc). This harmony may be disturbed because of the effect of the change in the material property of the brittle part in the anomalousperiod before a major earthquake on the load-ing process. Unlike the loadload-ing machine in a laboratory, the loading of plate driving forces is an internal process and may be affected by the change in the material prop-erty. Since the change in the brittle part is the cause for the anomalousperiod, the change inN(Mc)must precede that of coda Q−1. We can also simply imagine that the strain
energy stored in the brittle part of lithosphere reaching a saturation limit and starting to flow back to the ductile part, thusN(Mc), that expresses an event in the brittle part, pre-ceding codaQ−1, that expresses an event in the ductile part. Central to the above brittle-ductile interaction hypothesis is the assumption thatMccharacteristic to a seismic region is originated from a characteristic size of fractures in the ductile zone of the lithosphere. However, we are not able to study the temporal change of codaQin Japan using Hi-net data due its short history. To test this idea for Japan, we compare the spatial variation of coda Q to that of N(Mc) for the period for which the codaQmaps is constructed.
We use JMA catalog for earthquakes withM ≥2.0 oc-curred during January 2001 to July 2004 in the study region with focal depth less than 40 km. For each Longitude (Ei) and Latitude (Ni) node, we count the earthquakes occurred within the grid of (Ei±1◦;Ni±1◦) with magnitude ranges of 2–2.5, 2.5–3.0, 3.0–3.5, 3.5–4.0, 4.0–4.5, and 4.5–5.0, respectively. The increment of (Ei,Ni) is 1◦from (128.5◦; 29.5◦) to (143.5◦; 42.5◦) and overlaped with the neighbours by 0.5◦. The percentage of earthquakes in each magnitude range within each grid is plotted at (Ei,Ni) as shown in Fig. 4. For each Mcwe calculate the average N over the whole region as N¯(Mc) with standard errorσ. The red, blue, and yellow indicate where the calculated N(Mc)is larger than [N¯(Mc)+σ], smaller than [N¯(Mc)−σ], and within [N¯(Mc)±σ], respectively. The spatial variation of
N(Mc)for Mcranges 2–2.5 and 2.5–3 are very small, less than 20%, and it jumps suddenly to a factor of 3 forMc>3. Since the jump is abrupt and the variability is similar for all magnitude ranges greater than 3.0, such a jump in variabil-ity may not be attributed to the smaller sample size. We believe that this jump is real, and corresponds to a simi-lar jump in variability found for the codaQmap when the frequency at which codaQwas measured crossed 4–8 Hz. CodaQmaps showed a large spatial variation for frequen-cies lower than 4–8 Hz, while those for higher frequenfrequen-cies suddenly become uniform throughout Japan. This obser-vation is consistent with the brittle-ductile interaction hy-pothesis in which the dominant frequency at which codaQ
408 A. JIN AND K. AKI: CODAQMAP IN JAPAN
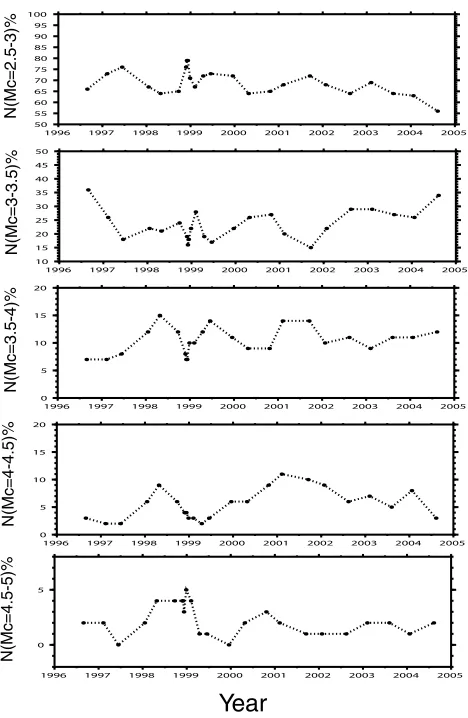
Fig. 5. The temporal change of N(Mc)% with different Mc in the hypocentral area of the 2004 Mid Niigata M6.8 earthquake.
The red colored grid in Fig. 4 represents N(Mc)higher than the mean by more than one standard error, and the blue represents N(Mc)lower than the mean by more than one standard error. The yellow represents N(Mc) within one standard error from the mean. Comparing Fig. 4 with Fig. 2, we can find some anomalously low coda Q area which also shows an anomalously highN(Mc). For example, the low coda Q area in southwestern Shikoku and Shimane-Tottori area corresponds to the highN(Mc)forMc3 to 3.5. In the context of the brittle-ductile interaction hypothesis, this indicates that the ductile fracture size under the area is several hundred meters. The coda Q measured for the same time period is low indicating that the coda Q−1 and
N(Mc =3–3.5) is currently coincident. Of course, a snap shot of coda Q andN(Mc)maps cannot tell if it is in the normal or abnormal period.
Here we present a very limited observation related to the NKTZ region. The JMA catalog with uniform magnitude determination goes back to 1995 for the NKTZ region. Fig-ure 5 plots the temporal variation ofN(Mc)forMcranges of 2.5–3, 3–3.5, 3.5–4, and 4–4.5, from the top to the bot-tom, respectively, for earthquakes occurred in the region 150 km around the epicenter of the M6.8 central Niigata earthquake. N(Mc)for Mc = 3–3.5 appears to increase from the late 2002 while N(Mc =4–4.5) decreases at the same time. If Mc applicable to the Niigata area is 4–4.5,
this observation combined with the low coda Qshown in Fig. 2 implies an anomalous period for the Niigata area in the context of the brittle-ductile interaction hypothesis. Ob-viously we need to accumulate more data on coda Q and
N(Mc), specially, for its temporal variations.
6.
Conclusion Remarks
(1) We constructed high spatial resolution codaQmaps of Japan using the Hi-net data for frequency bands of 1–2, 2–4, 4–8, 8–16, and 16–32 Hz. In general, the low coda
Qregions in the lower frequencies are correlated with high seismic areas of both subduction and the intraplate earth-quakes, and the low codaQareas for the higher frequencies are correlated with the areas of quaternary volcanoes.
(2) We gave special attention to the spatial coincidence between the zone of low codaQin 1–2 and 2–4 Hz bands with the high strain rate zone called NKTZ found from the GPS data. This is consistent with the brittle-ductile inter-action hypothesis of earthquake loading by plate-driving forces proposed by Aki (2004) on the basis of three inde-pendent studies; global study of tectonic stress by Zoback and Zoback (2002), regional study of Iioet al.(2002, 2004), and the observed correlation between coda Qand N(Mc) by Jin and Aki (1989, 1993). The occurrence of the Mw 6.8 central Niigata earthquake within the NKTZ in 2004 encourages further studies along this line.
(3) Modeling and monitoring the earthquake loading pro-cess in a seismic region is essential for earthquake predic-tion. Modeling the loading process is, however, not a sim-ple task because the individual earthquake is not an isolated system and a variety of interactions among the model el-ements exist in a broad area. At each stage of the devel-opment of loading process, we expect numerous possible scenarios for the future course. Therefore, we need mod-els that could be effectively constrained and adjusted by as many as available monitored data. The brittle-ductile inter-action hypothesis is only one of them. We need many such models that can be constrained and adjusted by a variety of observations for a reliable earthquake prediction.
Acknowledgments. This work was not possible without the Hi-net data. We are grateful to those who made continuous efforts to develop and maintain the Hi-net system and its database. Special thanks are due to Prof. T. Sagiya of Nagoya University for offering the strain rate map and constructive suggestions. Our appreciation also goes to Dr. K. Obara of NIED not only for his excellent work as the chief of the Hi-net but also for his encouragement and sug-gestions in processing the huge data set used in the present study. The constructive suggestions form the 2 anonymous referees are deeply appreciated. All the figures are made using the GMT soft-ware by Wessel and Smith (2001).
References
Aki, K., Analysis of seismic coda of local earthquakes as scattering waves,
J. Geophys. Res.,74, 615–631, 1969.
Aki, K., Attenuation of shear waves in the lithosphere for frequencies from 0.05 to 25 Hz,Phys. Earth Planet. Inter.,21, 50–60, 1980.
Aki, K., Attenuation and scattering of short-period seismic waves in the lithosphere, inIdentification of Seismic Sources-Earthquake or Under-ground Explosion, edited by E. S. Husebye and S. Mykkeltveit, pp. 515– 541, D. Reidel, Dordrecht, Holland, 1981.
Aki, K., A new view of earthquake and volcano precursors,Earth Planets Space,56, 689–714, 2004.
Aki, K. and B. Chouet, Origin of coda waves: Source, attenuation and scattering effects,J. Geophys. Res.,80, 3322–3342, 1975.
Baqer, S. and J. Mitchell, Regional variation of Lg codaQin the conti-nental United States and its relation to crustal structure and evolution,
PAGEOPH,153, 613–636, 1998.
Benits, R., Seismological applications of boundary integral and Gaussian beam methods, PhD thesis, MIT, Massachusetts, 1990.
Felher, M., M. Hoshiba, H. Sato, and K. Obara, Separation of scattering and intrinsic attenuation for the Kanto-Tokai region, Japan, using mea-surements of S-wave energy versus hypocentral distance,Geophys. J. Int.,108, 787–800, 1992.
Frankel, A. and L. Wennerberg, Energy-flux model of seismic coda: Sep-aration of scattering and intrinsic attenuation,Bull. Seismol. Soc. Am., 77, 1223–1251, 1987.
Gusev, G. G., Vertical profile of turbidity and codaQ,Geophys. J. Int., 123, 665–672, 1995.
Hoshiba, M., Separation of scattering attenuation and intrinsic absorption in Japan with the multiple lapse time window analysis from full seismo-gram envelope,J. Geophys. Res.,98, 15,809–15,824, 1993.
Iio, Y., T. Sagiya, Y. Kobayashi, and I. Shiozaki, Water-weakened lower crust and its role in the concentrated deformation in the Japanese Is-lands,Earth Planet. Sci. Lett.,203, 245–253, 2002.
Iio, S., T. Sagiya, and Y. Kobayashi, Origin of the concentrated deforma-tion zone in the Japanese Islands and stress accumuladeforma-tion process of intraplate earthquakes,Earth Planets Space,56, 831–842, 2004. Jannaud, L. R., P. M. Adler, and C. G. Jacqin, Spectral analysis and
inver-sion of codas,J. Geophys. Res.,96, 18,215–18,231, 1991.
Jin, A. and K. Aki, Spatial and temporal correlation between codaQand seismicity in China,Bull. Seismol. Soc. Am.,78, 741–769, 1988. Jin, A. and K. Aki, Spatial and temporal correlation between codaQ−1and
seismicity and its physical mechanism,J. Geophys. Res.,94, 14,041– 14,059, 1989.
Jin, A. and K. Aki, Temporal correlation between coda Q−1 and seismicity—Evidence for a structure unit in the brittle-ductile transition zone,J. Geodynamics,17, 95–120, 1993.
Jin, A., K. Mayada, D. Adams, and K. Aki, Separation of intrinsic and scattering attenuation in southern California using TERRAscope data,
J. Geophys. Res.,99, 17,835–17,848, 1994.
Jin, A., K. Aki, Z. Liu, and V. I. Keilis-Borok, Seismological evidence for
the brittle-ductile interaction hypothesis on earthquake loading,Earth Planets Space,56, 823–830, 2004.
Matsumoto, S. and A. Hasegawa, Two-dimensional codaQstructure be-neath Tohoku, NE Japan,Geophys. J. Int.,99, 101–108, 1989. Mayeda, K., K. S. Koyanagi, and K. Aki, A comparative study of
scatter-ing, intrinsic and codaQ−1for Hawaii, Long Valley and central Cali-fornia between 1.5 and 15.0 Hz,J. Geophys. Res.,97, 6643–6659, 1992. Mazzotti, S. X., L. Pichon, and P. Henry, Full interseismic locking of the Nankai and Japan-west Kurile subduction zones: An analysis of uniform elastic strain accumulation in Japan constrained by permanet GPS,J. Geophys. Res.,105, 13,159–13,177, 2000.
Mitchell, B. J. and L. Cong, Lg codaQand its relation to the structure and evolution of continents: A global prespective,PAGEOPH,153, 655– 663, 1998.
Mitchell, B. J., Y. Pan, J. Xie, and L. Cong, Lg codaQvariation across Eurasia and its relation to crustal evolution, J. Geophys. Res.,102, 22,767–22,780, 1997.
Miyazaki, S. and K. Heki, Crustal velocity field of southwest Japan: Sub-duction and arc-arc collision,J. Geophys. Res.,106, 4305–4326, 2001. Sagiya, T., S. Miyazaki, and T. Tada, Continuous GPS array and
present-day crustal deformation of Japan,PAGEOPH,157, 2003–2322, 2000. Sarker, G. and G. A. Abers, Comparison of seismic body wave and coda
wave measure ofQ,PAGEOPH,153, 665–684, 1998.
Sato, H. and M. C. Fehler,Seismic Wave Propagation and Scattering in the Heterogeneous Earth, Springer-Verlag, New York, 308 pp., 1998. Shimazaki, K. and Y. Zhao, Dislocation model for strain accumulation in
a plate collision zone,Earth Planets Space,52, 1091–1094, 2000. Singh, S. K. and R. B. Herrmann, Regionalization of crustal codaQin the
continental United States,J. Geophys. Res.,88, 527–538, 1983. Wessel, P. and W. H. F. Smith, The Generic Mapping Tools, version 3.4
released, http://gmt.soest.hawaii.edu, 2001.
Wu, R.-S., Multiple scattering and energy transfer of seismic waves— Separation of scattering effect from intrinsic attenuation—1. Theoret-ical modeling,Geophys. J. R. Astron. Soc.,82, 57–80, 1985.
Zoback, M. D. and M. L. Zoback, State of stress in the Earth’s lithosphere, International Handbook of Earthquake and Engineering Seismology, pp. 559–568, Academic Press, Amsterdam, 2002.