R E S E A R C H
Open Access
Dynamic interplay between CXCL levels in chronic
Hepatitis C patients treated by Interferon
Abdel-Rahman N Zekri
1*, Abeer A Bahnassy
3, Waleed S Mohamed
1, Hanaa M Alam EL-Din
1, Hend I Shousha
2,
Naglaa Zayed
2, Dina H Eldahshan
4and Ashraf Omar Abdel-Aziz
2Abstract
Background:Combined pegylated interferon-αand ribavirin therapy has sustained virological response (SVR) rates of 54% to 61%. Pretreatment predictors of SVR to interferon therapy have not been fully investigated yet. The current study assesses a group of chemokines that may predict treatment response in Egyptian patients with chronic HCV infection.
Patients and methods:CXCL5, CXCL9, CXCL11, CXCL12, CXCL 13, CXCL 16 chemokines and E-Cadherin were assayed in 57 chronic HCV patients’sera using quantitative ELISA plate method. All studied patients were scheduled for combined pegylated interferon alpha and ribavirin therapy (32 patients received pegylated interferonα2b, and 25 patients received pegylated interferonα2a). Quantitative hepatitis C virus RNA was done by real time RT-PCR and HCV genotyping by INNOLIPAII.
Results:There was no significant difference (p > 0.05) in baseline HCV RNA levels between responders and non-responders to interferon. A statistically significant difference in CXCL13 (p = 0.017) and E-Cadherin levels (P = 0.041) was reported between responders and nonresponders at week 12. Significant correlations were found between changes in the CXCL13 levels and CXCL9, CXCL16, E-cadherin levels as well as between changes in E-cadherin levels and both CXCL16 and ALT levels that were maintained during follow up. Also, significant changes have been found in the serum levels of CXCL5, CXCL13, and CXCL16 with time (before pegylated interferonα2 a andα2 b therapy, and at weeks 12 and 24) with no significant difference in relation to interferon type and response to treatment.
Conclusion:Serum levels of CXCL13 and E-Cadherin could be used as surrogate markers to predict response of combined PEG IFN-α/RBV therapy, especially at week 12. However, an extended study including larger number of patients is needed for validation of these findings.
Clinical trial No:NCT01758939
Keywords:HCV, IFN, Chemokine’s, E-Cadherin
Background
Hepatitis C virus (HCV) is a major cause of a wide spectrum of liver diseases ranging from mild chronic hepatitis to end stage cirrhosis and hepatocellular car-cinoma. The World Health Organization (WHO) esti-mates that 170 million individuals worldwide are infected with HCV [1], However, the prevalence of HCV infection varies throughout the world. One decade
ago, Frank et al., reported that Egypt had the highest number of reported HCV infections, largely attributed to the use of contaminated parenteral antischistosomal therapy [2]. The overall prevalence of HCV antibodies in the Egyptian population was 15% for age of 15 to 59 years and infection was higher among rural residents [3], and about 91% of the patients were infected with HCV genotype 4 [4].
Combined pegylated interferon (IFN)-α and ribavirin
(RBV) therapy has sustained virological response (SVR) rates reaching up to 61% in different clinical trials for HCV Genotype 1 patients [5,6]. The therapeutic efficacy * Correspondence:[email protected]
1
Virology and Immunology Unit, Cancer Biology Department, National Cancer Institute, Cairo University, 1st Kasr El-Aini st, Cairo, Egypt Full list of author information is available at the end of the article
of PEG IFN-α/RBV is likely due to their antiviral and immune-modulatory properties [7]. Factors associated with SVR to interferon treatment have not been fully in-vestigated in HCV genotype 4 infected patients. Previous studies demonstrated that age, body weight, baseline ALT, baseline HCV RNA viral load, HCV genotype and the level of fibrosis or cirrhosis are some predictors of response [8-12]. However, recent studies indicated that cytokines could be used as markers for disease progres-sion in HCV infected patients [13].
Some recent studies demonstrate that IL-8, and CXCL10 chemokines correlate with poor response to antiviral ther-apy in CHC patients [13-15] or have prognostic utility as a marker of treatment outcome [16-18]. Moreover, control of HCV infection may depend in part on chemokine-mediated recruitment of specific T cells to the liver [19]. In this context, Moura et al., [17] evaluated the association between pretreatment plasma levels of chemokines CCL2, CCL3, CCL11, CCL24, CXCL9, CXCL10 and soluble tumor necrosis factor receptors and the virological re-sponse in CHC-treated patients. They found that
pretreat-ment CXCL10 level predicts EVR and SVR to IFN-α and
ribavirin and may therefore be useful in the evaluation of candidates for therapy.
However, no previous studies have been done in Egypt yet to assess the possible role of chemokines levels as predictors of response to interferon therapy. The current study aims to assess 1) the changes in serum levels of CXCL5, CXCL9, CXCL11, CXCL12, CXCL 13, CXCL 16 chemokines and E-Cadherin in Egyptian patients with chronic HCV genotype 4 infection who were recruited
for combined PEG IFN-α/RBV therapy at baseline and
after 12 and 24 weeks, and 2) to determine the utility of using these markers as predictors of the treatment re-sponse through determining the influence of therapy on these chemokines.
Results
The current study was conducted on 57 CHC genotype-4 patient s, of which 32 (56.1%) received pegylated inter-feronα 2b, and 25 (30.4%) received pegylated interferon
α 2a. Clinical and laboratory findings of the studied
patients are shown in Table 1. There was no significant difference between pegintron and pegasys patients re-garding histopathological and laboratory findings (p > 0.05) except for the age (p=0.04).
Baseline mean values of HCV RNA Log (EQ/ML) levels for the patients who received pegylated interferon α2b (Peg-intron) and pegylated interferonα2a (Pegasys) were 5.4431 Log (EQ/ML) and 5.3824 Log (EQ/ML); respectively.
Different baseline data that might affect achievement of sustained virological response (SVR) such as age, body mass index, AST, ALT, and viral load were analyzed for
pegylated interferon α2b and α2a therapy. There was a
statistically significant difference between responders and non-responders in the AFP value for patients who
received pegylated interferon α 2b (p=0.041) and α 2a
(p = 0.05) therapy. Also, there was a statistically signifi-cant difference between responders and non-responders in AST value for patients who received pegylated
inter-feron α2b (p=0.049) and α2a (0.001) therapy. On the
other hand, the other baseline data did not differ signifi-cantly between the two studied groups (Table 2).
Serum levels of the studied chemokines in response to
pegylated interferon α2b and α2a therapy were
deter-mined before the beginning of treatment, after 12 and 24 weeks of treatment and correlated to the clinical data and response to treatment. However, full clinical and follow up data were available for 25 patients in group I (re-ceiving Peg-intron) and 19 patients in group II (re(re-ceiving pegasys treatment) only (Table 3). Each group was divided into two arms (responders and non-responders). As shown in Table 3 and Figure 1 the serum pretreatment levels of CXCL5 (1.275 ± 0.969 pg/ml) and (1.337 ± 0.792 pg/ml) were significantly higher than those assessed either at 12 (0.711 ± 0.459 pg/ml) and (0.908 ± 0.588 pg/ml) or 24 weeks (0.722 ± 0.466 pg/ml) and (0.951 ± .571 pg/ml) of pegylated
interferon α2b therapy for both non-responders and
re-sponders; respectively.
The same findings were observed in patients receiving pegylated interferonα2 a therapy, since CXCL5 pretreat-ment levels (1.220 ± 1.022 pg/ml) and (1.423 ± .925 pg/ ml) were significantly higher than those assessed either after 12 (1.004 ± .699 pg/ml) and (0.808 ± 0.609 pg/ml) or 24 weeks (0.766 ± 0.433 pg/ml) and (0.862 ± 0.634 pg/ ml) of non-responders and responders; respectively (p-value = 0.0001). No significant difference was found in relation to treatment type, response to treatment, time-type interaction, time-response interaction, or time- type-response interaction.
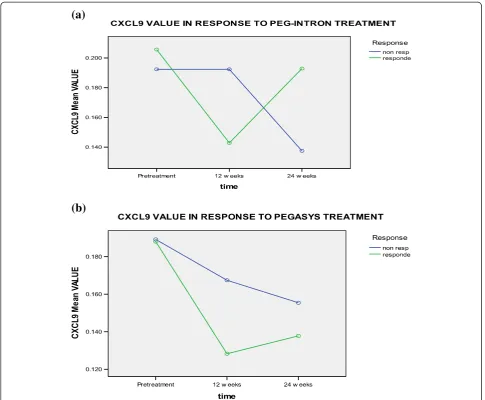
CXCL9 levels decreased in responders to pegylated
interferon α2b and α2a therapy after 12 and 24 weeks.
Whereas in non-responders, CXCL9 levels decreased at 12 weeks of therapy, then it increased at 24 weeks. No significant difference was found for the effect of time, treatment type, response to treatment, time-type action, time-response interaction, or type-response inter-action (Table 3 and Figure 2).
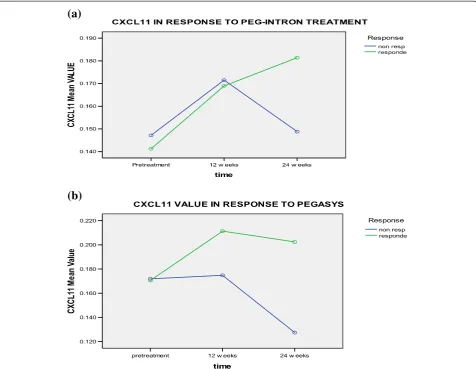
Serum levels of CXCL11 were elevated in responders to
pegylated interferon α2b therapy at 12 and 24 weeks,
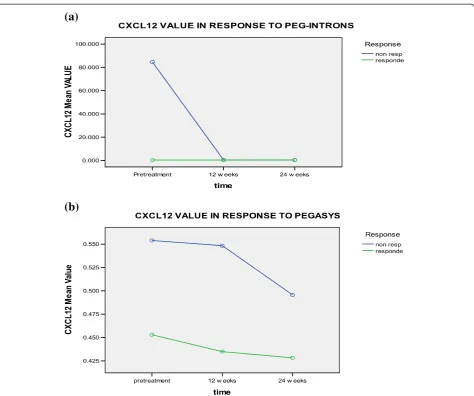
CXCL12 levels showed slight increase in responders to peg-intron therapy at 12 weeks and decreased in non-responders. In patients receiving pegasys therapy, it de-creased after 12 and 24 weeks, but no significant difference was found for time change, treatment type, response to
treatment, time-type interaction, time-response interaction, or type-response interaction (Table 3 and Figure 4).
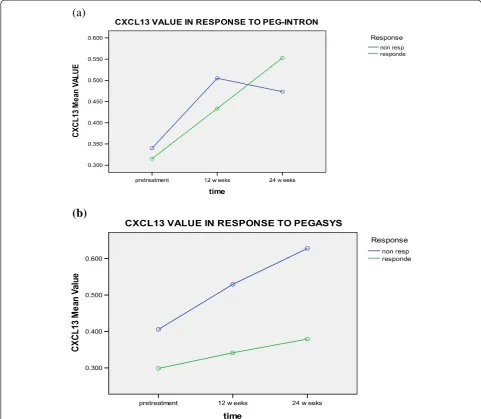
Serum pretreatment levels of CXCL13 (0.405 ± 0.274 pg/ ml and 0.298 ± 0.105 pg/ml) were significantly lower than those evaluated either at 12 (0.529 ± 0.271 pg/ml and 0.341 ± 0.145 pg/ml) or 24 weeks (0.628 ± 0.455 pg/ml and 0.399 ± 0.128 pg/ml) in pegylated interferon α2a treated patients for the non-responders and responders; respect-ively (p = 0.002). Similarly, CXCL13 pretreatment levels
for responders of pegylated interferon α2b therapy
(0.315 ±0.105 pg/ml) were significantly lower than those assessed either after 12 (0.433 ± 0.246 pg/ml) or 24 weeks (0.539 ±0.377 pg/ml). For the pegylated
inter-feron α2a nonresponders, CXCL13 levels increased at
12 weeks from 0.340 ± 0.069 to 0.504 ± 0.139 pg/ml then, it decreased at 24 weeks to 0.473 ± 0.181 pg/ml (Table 3 and Figure 5). However, no significant differ-ence was found in relation to treatment type, response to treatment, time type interaction, time-response in-teraction, or type-response interaction.
Pretreatment levels of CXCL16 for non-responders to pegylated interferon α2b and α2a therapy; respectively (0.946 ± 0.101 and 1.146 ± 0.424 ng/ml) and responders (0.874 ± 0.244 & 1.012 ± 0.331 ng/ml) were significantly lower than those after 12 weeks for non-responders (1.153 ± 0.298 & 1.254 ± 0.342 ng/ml), and responders (1.110 ± 0.323 & 1.249 ± 0.417 ng/ml), or after 24 weeks from the beginning of therapy for non-responders (1.268 ± 0.353 & 1.291 ± 0.354 ng/ml) and responders (1.139 ± 0.408 & 1.288 ± 0.402 ng/ml) (Table 3 and Figure 6). However, no significant difference was found in rela-tion to treatment type, response to treatment, time-type interaction, time-response interaction, or time- type-response interaction.
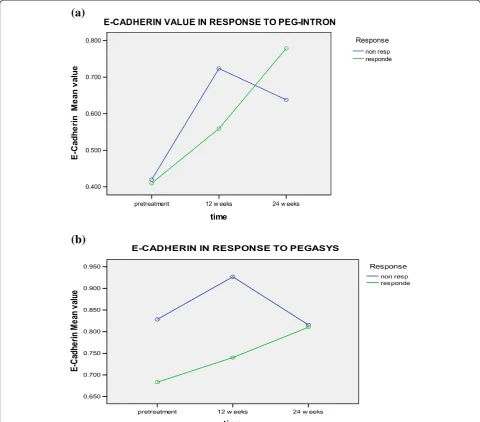
Serum levels of E-Cadherin increased observably in non-responders and responders after 12 weeks from the
beginning of therapy (either Pegylated IFNα 2a or 2b
groups) and continued to increase at 24 weeks but in responders only. No significant difference was found in relation to time change, treatment type, response to treatment, time-type interaction, timeresponse interaction, or type-response interaction (Table 3 and Figure 7).
No significant correlation was found between the ex-pression levels of any of the studied chemokines and baseline HCV RNA in our studied patients.
Correlations between different chemokines
Before treatment initiation CXCL13 was significantly cor-related to CXCL9 (r = 0.385, p = 0.003), CXCL16 (r = 0.366, p = 0.048) and E-cadherin (r = 0.511, p = 0.000). While E-cadherin was significantly correlated to CXCL16 (r = 0.628, p = 0.000). Otherwise there was no significant correlation between the others chemokine’s studied or be-tween them and the baseline AST, ALT and albumin levels Table 1 Clinical and Laboratory findings of the studied
57 chronic hepatitis C patients
Parameter PEG-INTRON PEGASYS P-value
III. Laboratory features (Mean ± SD)
HCV PCR Log (EQ/ML) 5.4431 5.3824 0.79
(before treatment)
WBC × 103/mm3 5.9344 ± 1.87266 6.1600 ± 2.55261
0.70
Hemoglobin (gm/dl) 14.3 ± 1.5 12.1 ± 1.1 0.67
Platelets count/mm3 212148 ± 76965 150868.8 ± 1.0 0.32
AST (0-42 IU/L) 60.1 ± 38.5 63.7200 ± 41.67 0.21
ALT (0-42 IU/L) 72.6 ± 50.4 88.5 ± 48.6 0.31
ALP (0-290 IU/L) 117.7 ± 67.7 93.9 ± 72.6 0.14
Total Bil(0.1-1.2 mg/dl) 0.81 ± 0.41 .7689 ± .311 0.81
Indirect Bil (mg/dl) 0.45 ± 0.80 .4526 ± 29238 0.69
Albumin (3.5-5.5gm/dl) 4.21 ± 0.43 3.62 ± 0.32 0.34
Prothrombin (%) 77.0 ± 27.0 71.1± 12.5 0.60
except for the significant correlation between Ecadherin and ALT level (r = 0.363, p = 0.048).
At 12 weeks of therapy E-cadherin was significantly correlated to CXCL5 (r = 0.358, p = 0.047), CXCL9 (r = 0.311, p = 0.021), CXCL12 (r = 0.789, p = 0.000), CXCL13 (r = 0.583, p = 0.000), CXCL16 (r = 0.810, p = 0.000) and ALT levels (r = 0.311, p = 0.021).
CXCL5 was significantly correlated to CXCL9 (r = 0.359, p = 0.007), CXCL11(r = 0.456, p = 0.000), CXCL12
(r = 0.417, p = 0.002), CXCL13 (r = 0.448, p = 0.001) and CXCL16 (r = 0.326, p = 0.015). CXCL9 was significantly correlated to CXCL12 (r = 0.640, p = 0.000), CXCL13 (r = 0.422, p = 0.001) and CXCL16 (r = 0.519, p = 0.000). CX CL12 was significantly correlated to CXCL13 (r = 0.622, p = 0.000) and CXCL16 (r = 0.827, p = 0.000). CXCL13 was significantly correlated to CXCL16 (r = 0.531, p = 0.000).
At 24 weeks of therapy CXCL5 was significantly corre-lated to CXCL9 (r = 0.327, p = 0.027), CXCL11 (r = 0.587,
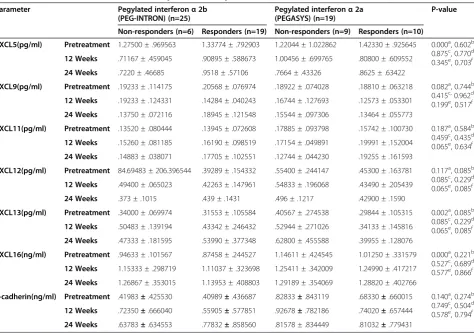
Table 3 Different chemokine’s levels of 44 patients in response to treatment
Parameter Pegylated interferonα2b (PEG-INTRON) (n=25)
Pegylated interferonα2a (PEGASYS) (n=19)
P-value
Non-responders (n=6) Responders (n=19) Non-responders (n=9) Responders (n=10)
CXCL5(pg/ml) Pretreatment 1.27500 ± .969563 1.33774 ± .792903 1.22044 ± 1.022862 1.42330 ± .925645 0.000a, 0.602b, 0.875c, 0.770d, 0.345e, 0.703f
12 Weeks .71167 ± .459045 .90895 ± .588673 1.00456 ± .699765 .80800 ± .609552
24 Weeks .7220 ± .46685 .9518 ± .57106 .7664 ± .43326 .8625 ± .63422
CXCL9(pg/ml) Pretreatment .19233 ± .114175 .20568 ± .076974 .18922 ± .074028 .18810 ± .063218 0.082a, 0.744b, 0.415c,0.962d, 0.199e, 0.517f
12 Weeks .19233 ± .124331 .14284 ± .040243 .16744 ± .127693 .12573 ± .053301
24 Weeks .13750 ± .072116 .18945 ± .121548 .15544 ± .097306 .13464 ± .055773
CXCL11(pg/ml) Pretreatment .13520 ± .080444 .13945 ± .072608 .17885 ± .093798 .15742 ± .100730 0.187a, 0.584b, 0.459c, 0.435d, 0.065e, 0.634f
12 Weeks .15260 ± .081185 .16190 ± .098519 .17154 ± .049891 .19991 ± .152004
24 Weeks .14883 ± .038071 .17705 ± .102551 .12744 ± .044230 .19255 ± .161593
CXCL12(pg/ml) Pretreatment 84.69483 ± 206.396544 .39289 ± .154332 .55400 ± .244147 .45300 ± .163781 0.117a, 0.085b, 0.085c, 0.229d, 0.065e, 0.085f
12 Weeks .49400 ± .065023 .42263 ± .147961 .54833 ± .196068 .43490 ± .205439
24 Weeks .373 ± .1015 .439 ± .1431 .496 ± .1217 .42900 ± .1590
CXCL13(pg/ml) Pretreatment .34000 ± .069974 .31553 ± .105584 .40567 ± .274538 .29844 ± .105315 0.002a, 0.085b, 0.085c, 0.229d, 0.065e, 0.085f
12 Weeks .50483 ± .139194 .43342 ± .246432 .52944 ± .271026 .34133 ± .145816
24 Weeks .47333 ± .181595 .53990 ± .377348 .62800 ± .455588 .39955 ± .128076
CXCL16(ng/ml) Pretreatment .94633 ± .101567 .87458 ± .244527 1.14611 ± .424545 1.01250 ± .331579 0.000a, 0.221b, 0.527c, 0.689d, 0.577e, 0.866f
12 Weeks 1.15333 ± .298719 1.11037 ± .323698 1.25411 ± .342009 1.24990 ± .417217
24 Weeks 1.26867 ± .353015 1.13953 ± .408803 1.29189 ± .354069 1.28820 ± .402766
E-cadherin(ng/ml) Pretreatment .41983±.425530 .40989±.436687 .82833±.843119 .68330±.660015 0.140a, 0.274b, 0.749c, 0.504d, 0.578e, 0.794f
12 Weeks .72350±.666040 .55905±.577851 .92678±.782186 .74020±.657444
24 Weeks .63783±.634553 .77832±.858560 .81578 ± .834449 .81032±.779431
p-value comparing the effect of timea, treatment typeb, response to treatmentc, time-type interactiond, time-response interactione, type-response interactionf
.
Table 2 Baseline differences of Lab findings among responders and non-responders of Pegylated interferonα2b andα2a therapy
Parameter Pegylated interferonα2b
P-value
Pegylated interferonα2a P-value Non-responders (n=10) Responders (n=22) Non-responders (n=13) Responders (n=12)
Age (Year) 38.70 ± 9.76 37.27 ± 7.98 0.66 43.69 ± 5.76 40.75 ± 9.37 0.35
PCR Log (EQ/ML) before treatment
5.3082 5.4975 0.61 5.5034 5.1751 0.29
p = 0.000), CXCL13 (r = 0.322, p = 0.029). CXCL13 was sig-nificantly correlated to CXCL9 (r = 0.311, p = 0.036), CXCL12 (r = 0.494, p = 0.000), CXCL16 (r = 0.400, p = 0.006) and E-cadherin (r = 0.454, p = 0.002) while CXCL12 was significantly correlated to CXCL16 (r = 0.634, p = 0.000) and E-cadherin (r = 0.777, p = 0.000). CXCL16 was significantly correlated to E-cadherin (r = 0.861, p = 0.000). Both CXCL16 and E-cadherin were significantly correlated to ALT levels (r = 0.319, p = 0.031) and (r = 0.350, p = 0.017); respectively.
Discussion
Previous studies have investigated pretreatment predic-tors of response to interferon based therapy in
HCV-associated CHC patients. Some of these studies have shown that cytokines could be used as predictors of treatment outcome [17].
In the current study, different baseline data that might affect the achievement of SVR and different chemokines levels were analyzed at different time intervals from starting therapy. We were able to show a statistically significant difference between responders and nonre-sponders to peg-intron and pegasys therapy in relation to AFP and AST values. Assessment of the correlation between the expression levels of these chemokine’s and response to treatment at baseline, week 12, and 24 revealed that the baseline serum level of CXCL5 was sig-nificantly higher than those after 12 or 24 weeks from
(a)
(b)
the beginning of pegylated interferonα2a andα2b therapy for responders and non-responders but with no significant correlation with response to treatment. This could be attributed to an interaction between immune response and viral activity, which is indicated by the differences in cytokines and chemokine’s expression during the course of treatment [20]. On the other hand, Dou et al., [21] demonstrated that the HCV-2a core protein was shown to down-regulated CXCL5 gene in human hepatoma (Huh-7) cell line.
Our results regarding the decrease in the CXCL9 level
in responders to pegylated interferon α 2 b and α 2 a
therapy after 12 and 24 weeks are consistent with those of Wan et al., [20] who demonstrated that serum CXCL9 levels decreased significantly after the initiation of IFN therapy indicating a possible effect on the rate of viral clearance. On the other hand Butera et al., [22] found that pretreatment samples showed no consistent differ-ences in CXCL9 level between patients who subsequently failed therapy and those who subsequently developed asustained response to antiviral therapy. They also found that CXCL9 level declined during therapy in both responders and non-responders. Among sustained re-sponders, CXCL9 level remained low after completion of therapy while in non-responders, the drop in CXCL9 was transient. A possible explanation for the difference be-tween our results and the later study could be our smaller sample size and the fact that all our patients were geno-type 4.
Our data regarding the elevated CXCL11 level in re-sponders of peg-intron therapy at 12 and 24 weeks, followed by a decrease at 12 weeks then an increase at 24 weeks for both responders and non-responders of pegasys therapy with no significant difference regarding time effect, treatment type, and response to treatment contrast with those of Butera et al., [22] who found that CXCL11 level measurement was lower in those who subsequently achieved SVR than in those who subse-quently have no reduction in HCV RNA during or after antiviral therapy but with no significant differences in response. Therefore, they concluded that there was no association between pretreatment levels of CXCL11 and the outcome of treatment. The increase in CXCL11 level in the current study may be related to an increase in its receptor (CXCR3) levels in CHC patients as previously mentioned by Perney et al., [23]. We also reported a slightly increase in CXCL12 level was responders to
PEG-IFN α2b therapy at 12 weeks and a decrease in
non-responders and in all patients receiving PEG-IFN α2a after 12 and 24 weeks. Cicinnati et al., [24] have
pre-viously mentioned that IFN-αcan modulate the
expres-sion of G protein coupled chemokine receptors, and some adhesion molecules, which are required for den-dritic cell (DC) trafficking into secondary lymphoid tis-sue. Accordingly, the effect of IFN on CXCL12 levels, in the current study, could be explained by IFN-α therapy-induced migration of DC from inflamed hepatic portal areas towards secondary lymphoid tissue with increased Table 4 Different chemokine’s levels of 55 patients at 12 weeks in response to treatment
Parameter Pegylated interferonα2b (PEG-INTRON) (n=31)
Pegylated interferonα2a (PEGASYS) (n=24)
P-value
Non-responders (n=10) Responders (n=21) Non-responders (n=13) Responders (n=11)
CXCL5(pg/ml) Pretreatment 1.45250±940684 1.30990±.759433 1.44500±1.077797 1.43018±.878441 0.000a, 0.486b, 0.593c, 0.236d, 0.665e, 0.552f
12 Weeks .71740±.377958 .88486±.588673 1.25877±851592 .80655±.578292
CXCL9(pg/ml) Pretreatment .20700±.102838 .19700±.078764 .19854±.134327 .18836±.059980 0.492a, 0.555b, 0.256c, 0.239d, 0.174e, 0.393f
12 Weeks .15520±.105935 .14029±.039694 .28985±.489042 .12573±.053301
CXCL11(pg/ml) Pretreatment .13520±.080444 .13905±.074375 .17885±.093798 .16373±.103128 0.144a, 0.190b, 0.787c, 0.435d, 0.065e, 0.634f
12 Weeks .15260±.081185 .16190±.098519 .17154±.049891 .19991±.152004
CXCL12(pg/ml) Pretreatment 51.01730±206.396544 .39581±.154332 .58746±.244147 .43218±.163781 0.187a, 0.185b, 0.182c, 0.229d, 0.065e, 0.188f
12 Weeks .50380± .065023 .42181±.147961 .61662± .196068 .42227± .205439
CXCL13(pg/ml) Pretreatment .35510±.069974 .31505±.105584 .45677±.274538 .29830± .105315 0.001a, 0.753b, 0.017c, 0.329d, 0.251e, 0.072f
12 Weeks .49510±.139194 .42638±.246432 .56569± .271026 .33490±.145816
CXCL16(ng/ml) Pretreatment 1.00250±.101567 .87652± .244527 1.16792± .424545 1.01791±.331579 0.000a, 0.081b, 0.227c, 0.689d, 0.378e, 0.702f
12 Weeks 1.12440±.298719 1.11633± .323698 1.36885± .342009 1.23936±.417217
E-cadherin(ng/ml) Pretreatment .82420±.425530 .47852±.436687 .98600±.843119 .63418±.660015 0.240a, 0.426b, 0.041c, 0.864d, 0.748e, 0.794f
12 Weeks .95180±.666040 .55862±.577851 1.09185±.782186 .68536± .657444
p-value comparing the effect of timea, treatment typeb, response to treatmentc, time-type interactiond, time-response interactione, type-response interactionf
chemotaxis to CXCL11 and CXCL12. Our results regard-ing the significant reduction of pretreatment CXCL13 level was with time of interferon treatment for both re-sponders and non-rere-sponders regardless of treatment type are consistent with Sansonno et al. [25] who mentioned that up-regulation of CXCL13 gene expression is a dis-tinctive feature of HCV-infected patients. Therefore high levels of this chemokine could be detected in the liver and skin of patients with CHC and these levels might decrease after therapy.
In our patients, pretreatment CXCL16 level increased significantly with time in responders and non-responders to pegylated interferonα2b and α2a therapy with no sig-nificant difference between the two groups. This could be attributed to the effect of IFN, which improves TH-1
response [26]. IFN-α treatment has been shown to
regu-late the activity of other cytokines and chemokines either directly or indirectly [27].
Alteration in E-Cadherin expression has been associ-ated with human carcinogenesis including HCC [28]. In our series, E-Cadherin increased in non-responders and
responders to Pegylated IFNα 2a or 2b after 12 weeks
from the beginning of therapy however it continued to increase at 24 weeks only in responders of both groups. This could be attributed to the effect of HCV core pro-tein, which represses E-Cadherin expression at the tran-scriptional level by down-regulating its promoter activity through promoter hypermethylation [29]. The significant difference in serum levels of E-Cadherin, reported in our study, at week 12 between responders and non-responders shows that it could be used as a predictor of EVR in IFN-treated CHC patients.
No significant correlation was found in the current study between any of the studied chemokines levels and baseline HCV RNA. On the other hand, baseline data have shown significant correlations between CXCL9 and
(a)
(b)
CXCL13, CXCL13 and CXCL16, CXCL13 and E-cadherin, CXCL16 and E-cadherin, as well as between ALT level and E-cadherin that were maintained in follow up results.
In other words, these significant correlations were pre-sent at pretreatment, after 12 weeks, and after 24 weeks. In a previous study done by Butera et al., [22] stated that there was no correlations between CXCL9 and CXCL11 chemokines levels and viral load. On the other hand, Perney et al., [23] found a correlation between the expres-sion of CXCR3 on peripheral blood CD4+ T cells and AST serum levels. Cicinnati et al., [24] also found that there were no significant correlations between systemic levels of CXCL12 and gender, age, grade of hepatic inflam-mation, stage of fibrosis, transaminases, bilirubin, HCV genotype or viral load. Also, Sansonno et al., [25] found that there was no correlation between CXCL13 concentra-tions and circulating viral load or ALT levels. One of the explanations for these findings is the lack of a direct effect of the virus on the sources of CXCL13 production.
Conclusion
In conclusion, our results have shown that serum levels of CXCL13 and E-Cadherin have the potential to be used as serological markers at week 12 to the response of com-bined PEG IFN-α/RBV therapy. Also, significant changes with time have been found in the serum levels of CXCL5,
CXCL13, and CXCL16 before pegylated interferonα 2 a
andα2 b therapy, and at weeks 12 and 24 with no signifi-cant difference in relation to treatment type, response to treatment, time-type interaction, time-response inter-action, or type-response interaction. However, there were some limitations of our study, as example, this study should be done on a large scale in order to be validated. Also, it is better to apply one type of PEG-IFN prepara-tions, and avoiding confounding was not an easy task, when assessing the association between tested chemokines and an outcome variable which leads to an overestimate or underestimate of the true association between exposure and outcome.
(b)
(a)
Methods Patients
This prospective study included 57 patients with chronic HCV (CHC) liver disease. These patients constituted a part of a randomized controlled study including 200
patients receiving either pegylated interferon α 2b or
pegylated interferon α 2a in combination with ribavirin
during the period from September 2006 to March 2009. A written informed consent for immunological research, in which patients were assigned to give 10 mL of venous blood at each studied point during the course of therapy, blood was obtained from all patients before enrollment in the study. Only 57 patients accepted to share in the current study (32 received pegylated interferonα2b and
25 received pegylated interferon α 2a, at baseline and
after 12 and 24 weeks). All patients were treated in Al Qahira Al Fatimia Hospital (a district hospital at the middle of Cairo) as a part of the national program for
combating viral hepatitis under supervision and sponsor-ship of The Ministry of Health. A written consent was obtained from all patients prior to enrollment in the study and the ethical committee of Al Qahira Al Fatimia Hospital and Ministry of Health approved the protocol, which was in accordance with the ethical guidelines of the Helsinki Declaration.
Selection criteria included male or female patients with CHC, aged 18 years or older with HBsAg negative, nuclear antibody (ANA) <1:160, positive HCV anti-bodies and HCV RNA by RT-PCR. All patients had white blood cells (WBCs) > 4000/mm3, neutrophil count >2000/ mm3, platelets >75 000/mm3, prothrombin time <2 sec-onds above the upper limit of normal (ULN), direct biliru-bin 0.3 mg/dL or within 20% of ULN, albumin >3.5, alpha fetoprotein <100, serum creatinine within normal limit (WNL), fasting blood sugar 115 mg/dl or within 20% ULN and if diabetic Hb A1C < 8.5% with normal T3, T4 and
(b)
(a)
TSH. On the other hand, patients with decompensated liver disease or those with chronic liver disease due to causes other than HCV e.g. HBV, alpha-1 antitrypsin defi-ciency, Wilson’s disease, haemochromatosis, alcoholic liver disease or autoimmune disease were excluded from the study. Similarly, patients with hypersensitivity to inter-feron or ribavirin, pregnant or breast feeding females and those with any co-morbid conditions were excluded. All patients were subjected to full history taking and clinical assessment, routine laboratory work up including com-plete blood picture, liver biochemical profile, serum urea and creatinine, blood glucose, pregnancy test for married females, HBsAg, ANA, TSH, AFP and anti-schistosomal Ab titer. ECG was done for males > 40 years and fe-males >50 years old. Ocular examination and abdom-inal ultrasound were also done.
Follow up and monitoring response to antiviral apy was done on week 1, 2 and 4 after initiation of ther-apy then every 4 weeks. During each follow up, signs and symptoms of possible adverse effects due to the drugs were evaluated by routine laboratory studies. If treatment was continued in the presence of adverse effects, either dose adjustments were considered or the particular side effect was treated or monitored without lowering dosages depending on its severity.
Quantitative HCV RNA by Real time-polymerase chain reaction (RT-PCR) was performed after 12 weeks of ther-apy to determine Early Virological Response (EVR) upon which the decision to continue treatment after 12 weeks was taken, in addition to the patients’tolerance to drugs and laboratory profile. Qualitative HCV viral load was also done after 24 weeks of treatment and if negative, the
(a)
(b)
patient continued on the treatment. It was also done once the course of treatment was completed to document the End of Treatment Response (ETR). Sustained Virological Response (SVR) was defined as the absence of detectable HCV RNA in serum at the 24th week after the end of treatment [30].
Quantitative real time PCR for determination of HCV viremia
RNA was extracted from patients’ blood using the
QIAmp Viral RNA Mini Kit (QIAGEN, Santa Clarita, U. S.A) according to the manufacturer’s instructions, then quantitative Real time-polymerase chain reaction (RT-PCR) was performed using previously standardized realtime RT-PCR protocol for HCV, supplied from applied biosystems (USA) and according to Zekri et al. [31].
HCV genotyping
HCV genotyping was done using the INNOLIPA–II
technique as previously described by Zekri et al. [32].
Monitoring patients’response to therapy
Responses to therapy in patients with HCV were de-termined according to the consensus guidelines of the National Institutes of Health. Responders to therapy were defined by normalization of serum alanine amino-transferase (ALT) and absence of detectable serum HCV RNA at the end of treatment (48 weeks). Relapsed re-sponders to therapy were defined by normalization of serum ALT and absence of detectable serum HCV RNA at the end of treatment but with an increase of the serum ALT and the presence of HCV RNA at follow-up (72 weeks). Non-responders were defined by elevated serum ALT and the presence of HCV RNA at the end of treatment.
Assay of chemokines
Ten ml of blood were obtained from patients for serum separation before the start of therapy, after 12 and 24 weeks of therapy. CXCL5, CXCL9, CXCL11, CXCL12, CXCL 13, CXCL 16 chemokines and E-Cadherin were
(a)
(b)
assayed using the quantitative ELISA plate method. The kits used were provided by Quantikine kits (R&D Systems, Inc. 614 McKinley Place NE Minneapolis, MN 55413 United States of America), sponsored by NCI and used according to the manufacturer’s instructions.
Histopathological examination
Pretreatment liver biopsies from all patients were exam-ined to confirm the diagnosis and determine the stage of fibrosis and the grade of inflammation using Modified Knodell score [33], in the form of 18 points for histo-pathology activity index (HAI), six points for stage of fibrosis and four points for stage of steatosis [34].
The histological activity index in the studied patients were graded into minimal (0–3), mild (4–8), moderate
(9–12) and severe (13–18) points. The stage of fibrosis
was graded into minimal (0–1), moderate (2–4) and
marked (5–6) points.
Statistical methods
Statistical analysis was done using SPSS version 17 statis-tical software package for windows. Quantitative variables were expressed by mean and SD (Standard deviation), comparison of means using Student’st-test, Mann–Whitney
U-test or ANOVA test were done when appropriate.
Time-type interaction, time-response interaction, or type-response interaction were measured and analyzed statisti-cally by repeated measures analysis of variance. In the table of multivariate tests, we took into consideration the p-values (for Wilks Lamda), and partial Eta square
(a)
(b)
(according to Cohen’s standard) for measuring the interac-tions and their effect size. MANOVA was used under the same circumstances as ANOVA but when there were mul-tiple dependent variables as well as independent variables within the model which the researcher wishes to test. MANOVA is also considered a valid alternative to the re-peated measures ANOVA when sphericity was violated. Also, Pearson correlation test was performed for correlating quantitative variables. Qualitative variables were expressed by frequency and percent, comparison of mean values and assessment of relations using chisquared test or Fisher’s exact test was done when appropriate. P-value was consid-ered significant when < 0.05 significant and highly signifi-cant when < 0.01.
Abbreviation
ALT:Serum alanine aminotransferase; ANA: Anti-nuclear antibody; AFP: Alpha-fetoprotein; AST: Aspartate aminotransferase; CHC: Chronic hepatitis C; DC: Dendritic cells; EVR: Early virological response; ETR: End of treatment response; HAI: Histopathology activity index; HCC: Hepatocellular carcinoma; HCV: Hepatitis C virus; HBsAg: Hepatitis B surface antigen; PEG IFN-α/RBV: Pegylated interferon-alpha and ribavirin; SD: Standard deviation; SVR: Sustained virological response; TSH: Thyroid stimulating hormone; ULN: Upper limit of normal; WBCs: White blood cells; WHO: World health organization; WNL: Within normal limit.
Competing interests
The authors declare that they have no competing interests.
Authors’contributions
ARNZ generated the idea, helped in revision of the manuscript, was responsible for the whole practical part, AAB managed the pathology work, helped in revision of the manuscript, WSM was help in editing, revising and did the statistical part of the manuscript, HMAED carried out the ELISA for the specified chemokines, shared in editing and revising the manuscript, HS was responsible for patient’s treatment and sampling wrote the draft of the manuscript, NZ managed the patients and their clinical part, DHE was help in editing, revising the manuscript and AO managed the patients and their clinical part, shared in the idea generation. All authors read and approved the final manuscript.
Financial competing interests
The contents are solely the responsibility of the authors and do not necessarily represent the views of the funding source. The authors declare that they have no competing interests.
Acknowledgement
This work was supported by the grant office of the National Cancer Institute, Cairo University, Cairo, Egypt.
Author details
1Virology and Immunology Unit, Cancer Biology Department, National
Cancer Institute, Cairo University, 1st Kasr El-Aini st, Cairo, Egypt.2Tropical Medicine Department, Faculty of Medicine, Cairo University, Kasr El-Aini st, Cairo, Egypt.3Pathology Department, National Cancer Institute, Cairo University, 1st Kasr El-Aini st, Cairo, Egypt.4Clinical Pathology Department, Faculty of Medicine, Benisuef University, Cairo, Egypt.
Received: 5 August 2011 Accepted: 17 May 2013 Published: 1 July 2013
References
1. Mukherjee S:Hepatitis C. Medscape. 2011. http://emedicine.medscape. com/article/177792-overview.
2. Frank C, Mohamed MK, Strickland GT, Lavanchy D, Arthur RR, Magder LS, El Khoby T, Abdel-Wahab Y, Aly Ohn ES, Anwar W, Sallam I:The role of
parenteral antischistosomal therapy in the spread of hepatitis C virus in Egypt.Lancet2000,355(9207):887–891.
3. El-Zanaty F, Way A:Egypt demographic and health survey 2008.Cairo, Egypt: Ministry of Health, El-Zanaty and Associates, and Macro International; 2009. Available at http://www.measuredhs.com/pubs/pdf/FR220/FR220.pdf. 4. Ray SC, Arthur RR, Carella A, Bukh J, Thomas DL:Genetic epidemiology of
hepatitis C virus throughtout Egypt.J Infect Dis2000,182:698–707. 5. Hadziyannis SJ, Sette H Jr, Morgan TR, Balan V, Diago M, Marcellin P, Ramadori G, Bodenheimer H Jr, Bernstein D, Rizzetto M, Zeuzem S, Pockros PJ, Lin A, Ackrill AM, PEGASYS International Study Group: Peginterferon alfa-2a and ribavirin combination therapy in chronic hepatitis C: a randomized study of treatment duration and ribavirin dose.Ann Intern Med2004,140:346–355.
6. Reddy KR, Messinger D, Popescu M, Hadziyannis SJ:Peginterferon alfa-2a (40kDa) and ribavirin: comparable rates of sustained virological response in Sub-sets of older and younger HCV genotype 1 patients.J Viral Hepat
2009,16(10):724–731.
7. Gao B, Hong F, Radaeva S:Host factors and failure of interferon-a treatment in hepatitis C virus.Hepatology2004,39:880–890. 8. Lee SS, Abdo AA:Predicting antiviral treatment response in chronic
hepatitis C: how accurate and how soon?J Antimicrob Chemother2003, 51:487–491.
9. Kamal S:Improving outcome in patients with hepatitis C virus genotype 4.Am J Gastroenterology2007,102:2582–2588.
10. Roulot D, Bourcier V, Grando V, Deny P, Baazia Y, Fontaine H, Bailly F, Castera L, De Ledinghen V, Marcellin P, Poupon R, Bourlière M, Zarski JP, Roudot-Thoraval F, Observational VHC4 Study Group:Epidemiological characteristics and response to peginterferon plus ribavirin treatment of hepatitis C virus genotype 4 infection.J Viral Hepatitis2007,14:460–467. 11. Zekri AR, Haleem HA, Esmat GE-D, Bahnassy AA, El-Din HMA, Hafez MM MM,
Sharaby AF, Sharaf H, Zakaria MSE-D:Immunomodulators, sFas and Fas-L as potential noninvasive predictors of IFN treatment in patients with HCV genotype-4.J Viral Hepatitis2007,14:468–477.
12. El Makhzangy H, Esmat G, Said M, Elraziky M, Shouman S, Refai R, Rekacewicz C, Gad RR, Vignier N, Abdel-Hamid M, Zalata K, Bedossa P, Pol S, Fontanet A, Mohamed MK:Response to pegylated interferon alfa-2a and ribavirin in chronic hepatitis C genotype 4.J Med Virol2009,81:1576–1583. 13. Zekri AR, Ashour MS, Hassan A, Alam El-Din HM, El-Shehaby AM,
Abu-Shady MA:Cytokine profile in Egyptian HCV genotype-4 in relation to liver disease progression.World J Gastroenterol2005,11(42):6624–6630. 14. Wald O, Weiss ID, Galun E, Peled A:Chemokines in hepatitis C virus infection:
pathogenesis, prognosis and therapeutics.Cytokine2007,39:50–62. 15. Diago M, Castellano G, García-Samaniego J, Pérez C, Fernández I, Romero M,
Iacono OL, García-Monzón C:Association of pretreatment serum interferon c inducible protein 10 levels with sustained virological response to peginterferon plus ribavirin therapy ingenotype 1 infected patients with chronic hepatitis C.Gut2006,55:374–379.
16. Casrouge A, Decalf J, Ahloulay M, Lababidi C, Mansour H, Vallet-Pichard A, Mallet V, Mottez E, Mapes J, Fontanet A, Pol S, Albert ML:Evidence for an antagonistform of the chemokine CXCL10 in patients chronically infected with HCV.J Clin Invest2011,121(1):308–317.
17. Moura AS, Carmo RA, Teixeira AL, Teixeira MM, Rocha MO:Soluble inflammatory markers as predictors of virological response in patients with chronic hepatitis C virus infection treated with interferon-αplus ribavirin.Memorias do Instituto Oswaldo Cruz2011, 106(1):38–43.
18. Zeremski M, Petrovic LM, Talal AH:The role of chemokines as inflammatory Mediators in Chronic Hepatitis C Virus Infection.
J Viral Hepat2007,14(10):675–687.
19. Rot A, Von Andrian UH:Chemokines in innate and adaptive host defense: basic chemokinese grammar for immune cells.Annu Rev Immunol2004, 22:891–928.
20. Wan L, Kung YJ, Lin YJ, Liao CC, Sheu JJ, Tsai Y, Lai HC, Peng CY, Tsai FJ: Th1 and Th2 cytokines are elevated in HCV-infected SVR(+) patients treated with interferon-a.Biochemical and Biophysical Research Communications2009,379:855–860.
21. Dou J, Wang J, Liu PB, Zhang XJ:Gene expression profiles on three kinds of genotype hepatitis C virus core protein in Huh-7 cell line with microarray analysis.Zhonghua Yu Fang Yi Xue Za Zhi2006,40(1):38–41. 22. Butera D, Marukian S, Iwamaye AE, Hembrador E, Chambers TJ,
Plasma chemokine levels correlate with the outcome of antiviral therapy in patients with hepatitis C.Blood2005,106:1175–1182.
23. Perney P, Turriere C, Portalès P, Rigole H, Psomas C, Blanc F, Clot J, Corbeau P:CXCR3 expression on peripheral CD4+ T cells as a predictive marker of response to treatment in chronic hepatitis C.Clin. Immunol
2009,132(1):55–62.
24. Cicinnati VR, Kang J, Sotiropoulos GC, Hilgard P, Frilling A, Broelsch CE, Gerken G, Beckebaum S:Altered chemotactic response of myeloid and plasmacytoid dendritic cells from patients with chronic hepatitis C: role of alpha interferon.Journal of General Virology2008,89:1243–1253. 25. Sansonno D, Tucci FA, Troiani L, Lauletta G, Montrone M, Conteduca V,
Sansonno L, Dammacco F:Increased serum levels of the chemokine CXCL13 and up-regulation of its gene expression are distinctive features of HCV-related cryoglobulinemia and correlate with active cutaneous vacuities.Blood2008,112(5):1620–1627.
26. Balian A, Naveau S, Zou W, Durand-Gasselin I, Bouchet L, Foussat A, Galanaud P, Chaput JC, Emilie D:Pretreatment expression of the perforin gene by circulating CD8(+) T lymphocytes predicts biochemical response to interferon-alpha in patients with chronic hepatitis C.
Eur. Cytokine Netw2000,11:177–184.
27. Biron CA:Interferons alpha and beta as immune regulators—a new look.
Immunity2001,14:661–664.
28. Hirohashi S, Kanai Y:Cell adhesion system and human cancer morphogenesis.Cancer Sci2005,94:575–581.
29. Arora P, Kim E, Jung J, Jank KL:Hepatitis C virus core protein downregulates E- cadherin expression via activation of DNA methyltransferase 1 and 3b.Cancer Letters2008,261:244–252. 30. National Institutes of Health Consensus Development Conference Statement:
Management of hepatitis C.Hepatology2002,36(supp1):S3–S20. http:// consensus.nih.gov/2002/2002HepatitisC2002116html.htm.
31. Zekri AR, Bahnassy AA, Alam El-Din HM, Salama HM:Consensus siRNA for inhibition of HCV genotype-4 replication.Virology J2009,6:13. 32. Zekri AR, El-Din HM, Bahnassy AA, El-Shehabi AM, El-Leethy H, Omar A,
Khaled HM:TRUGENE sequencing versus INNO-LiPA for sub-genotyping of HCV genotype-4.J Med Virol2005,75(3):412–420.
33. Knodell RG, Ishak KG, Black WC:Formulation and application of numerical scaring system for assessing histological activity in asymptomatic chronic active hepatitis.Hepatology1981,1:431–435.
34. Desmet VJ, Gerber M, Hoofnagle JH:Classification of chronic hepatitis: diagnosis, grading and staging.Hepatology1994,19:1513–1520.
doi:10.1186/1743-422X-10-218
Cite this article as:Zekriet al.:Dynamic interplay between CXCL levels in
chronic Hepatitis C patients treated by Interferon.Virology Journal
201310:218.
Submit your next manuscript to BioMed Central and take full advantage of:
• Convenient online submission
• Thorough peer review
• No space constraints or color figure charges
• Immediate publication on acceptance
• Inclusion in PubMed, CAS, Scopus and Google Scholar
• Research which is freely available for redistribution