R E S E A R C H
Open Access
An analysis of the molecular evolution of
Hepatitis B viral genotypes A/B/D using a
Bayesian evolutionary method
Guangyu Xu
1,2†, Chengguo Wei
2†, Yuqi Guo
2, Chao Zhang
2, Nan Zhang
3*and Guoqing Wang
2*Abstract
Background:Hepatitis B virus (HBV) infection is a major global health problem. The infectious virion contains an inner“core particle”, which is made of 180 or 240 copies of core protein, alternatively known as hepatitis B core antigen, or HBcAg which encloses the viral genome.
Method:In this study, we characterized HBV genotypes and used Bayesian analyses to estimate date of emergence of the most recent common ancestor (TMRCA) of three HBV genotypes, A, B, and D.
Results:We estimated that the rate of evolution of HBV core protein gene to be 1.127 (0.925–1.329, 95% HPD) substitutions per site per year. The TMRCA of HBV for genotypes A, B, D were 118 (54–194, 95% HPD) year, 184 (78–323, 95% HPD) year and 133 (65–230, 95% HPD) year, respectively. Demographic histories of the HBcAg gene showed that the relative genetic diversity had a sharp increase within the first 10 years of its emergence.
Conclusion:Using a bayesian evolutionary method to predict the outbreak trends of HBV through evolutionary trees of HBV, and provide theoretical foundations for clinical prevention and treatment of HBV.
Keywords:HBV, Genotypes, Bayesian analyses, TMRCA
Background
HBV is a genus of DNA viruses which infects the humans causing acute and chronic hepatitis [1]. The World Health Organization estimates that more than 2 billion people have been infected with the hepatitis B virus [2], of which there are 350 million chronic carriers [3]. In recent years, there have been many studies on HBV genotypes and their clinical relationships. It has been shown that HBV genotypes reflect the natural heterogeneity between virus strains more accurately than serotypes.
There are ten different HBV genotypes (A-J) whose prevalences are variably distributed geographically [4]. Genotype A is common in sub-Saharan Africa, Northern Europe and West Africa. Genotypes B and C are highly
prevalent in Asia. Genotypes D is highly prevalent in Asia and Africa, and D1 in North Africa, Europe, Central Asia, D2 in North Europe, Russia, Japan (Ehime), D3 in South Africa, Europe, D4 in Australia, D5 in East India [5,6]. Genotype E has been reported in West Africa. Genotype F is found in Central and South America, while genotype G is found in France, Germany and the United States. The eighth genotype, H, has been reported to be present in Central America [7]. At present, genotype I has been de-scribed in Vietnam and Laos [8,9]. The newest HBV geno-type, J, was identified in the Ryukyu Islands in Japan, and this genotype has a close relationship with gibbon/orangu-tan genotypes, and human genotype C [10]. There are many applications behind the study of genotypes in HBV. These include elucidation of novel mechanisms of disease pathogenesis, development of biomarkers for disease prognosis or treatment outcome, and identification of po-tential therapeutic targets. At the same time, there were many people have reported the evolutionary analysis of HBV by different regions of genes and genomes [11,12].
* Correspondence:[email protected];[email protected]
†Equal contributors 3
Department of Emergency, The First Affiliated Hospital of Jilin University, Changchun, Jilin 130021, China
2
Key Laboratory of Zoonosis, Ministry of Education, Norman Bethune College of Medicine, Jilin University, Changchun, Jilin 130021, China
Full list of author information is available at the end of the article
HBV is characterized by high rates of replication (1012-13
virions/day), and high rates of mutation (1010-11point
mu-tation/day) which increase the likelihood of the appearance of conserved changes which ultimately can lead to the emergence of new genotypes. The various HBV genotypes are associated with differences in pathogenicity [5], disease progression [13] and responses to antiviral drugs [14].
In this article, we carried out genotype classification of HBV according to the HBcAg (core) gene by the Bayesian method to estimate date of emergence of the most recent common ancestor (TMRCA) of three common HBV ge-notypes. We predicted the outbreak trends of HBV through evolutionary trees of HBV, and provide theoretical foundations for clinical prevention and treatment of HBV.
Material and methods
Sequence collection
A total of 580 HBcAg gene sequences from GenBank were downloaded (www.ncbi.nlm.nih.gov), of which 153 had
known collection dates, genotype and isolate, and country of origin. Samples obtained between 1990 and 2012 were retrieved for analysis (the accession numbers of these se-quences are available through [email protected]). These sequences were processed using BioPerl to generate the format required for manipulation by BEAST 1.6 [15]. Se-quences were aligned using MEGA5 software [16], and edited with the SEAL software (available at http://tree.bio. ed.ac.uk/software/seal/). Any missing nucleotides were
coded as“missing characters”in the nexus block because
BEAST cannot perform the alignments.
Genotyping analysis
Using the HBV genotype data, the strains were col-lected using the Markov Chain Monte Carlo method. MCMC together with the information on collection dates, using Bayesian analyses were performed to esti-mate the time emergence of the most recent common ancestor (TMRCA) [17]. This information led us to make inferences about the oldest, and also the youngest HBV genotypes. The results were summarized using the program TreeAnnotator 1.6.1, and the maximum clade credibility (MCC) tree was constructed. FigTree was used to display the tree.
Bayesian MCMC evolutionary analyses
After the TMRCA was done with BEAST 1.6, convergence was inspected using Tracer v1.6, with uncertainties 30.0
0.0 50.0 100.0 150.0 200.0 250.0
D3_GQ922001_Canada_1984
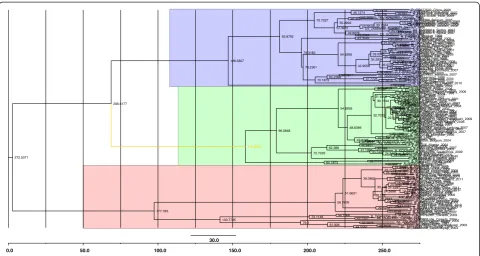
Figure 1The maximum clade credibility (MCC) tree was estimated using Bayesian analysis with HBcAg gene sequences about ~660 bp of HBV.The key nodes above the respective nodes were used to show the posterior probabilities. The green color depict genotype D (n = 54), and blue pink color display genotype A (n = 55) and B (n = 44).
Table 1 Estimates of the relative substitution rates for the core gene of all three codon positions
Summary statistic CP1.mu CP2.mu CP3.mu
Mean 0.506 1.539 0.953
95% HPD lower 0.448 1.458 0.881
95% HPD upper 0.567 1.618 1.030
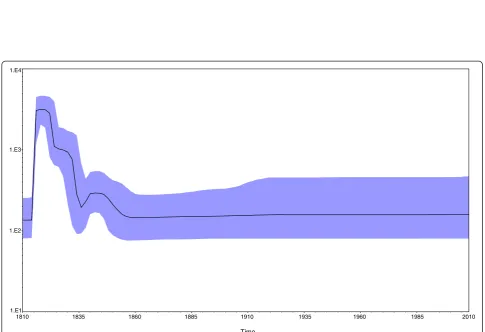
addressed as 95% HPD intervals. Analyses were performed using the Hasegawa-Kishino-Yano (HKY) nucleotide sub-stitution models, with a gamma-distributed among-site rate variation with four rate categories [18]. We did the Bayesian MCMC analysis for 50 million states, and sam-pled every 50,000 states. We set a burn-in of 2 million states for the posterior probabilities, and then showed the results using Tracer, version 1.6. We used Bayesian skyline plots to show the relative viral genetic diversity for HBV core protein gene [19].
About tMRCA
The most recent common ancestor (MRCA) of any set of organisms is the most recent individual from which all organisms in the group are directly descended. Such time to MRCA (TMRCA) estimates can be given based on DNA test results and established mutation rates as practiced in genetic genealogy, or by reference
to a non-genetic, mathematical model or computer simulation [17].
Results and discussion
Phylogenetic analysis
The most common HBV genotype is C, followed by B. However, most of the available data are on genotypes A, B and D. Therefore, we undertook to study the evo-lution of HBV by analyzing these three genotypes. A total of 580 HBcAg gene sequences were downloaded from GenBank (www.ncbi.nlm.nih.gov), of which 153 sequences had collection dates between 1990 and 2012. These were used for molecular characterization. We es-timated the maximum clade credibility (MCC) tree using a Bayesian analysis of core protein (C) gene se-quences with ~660 bp of hepatitis B virus strains. The results are shown in Figure 1. The phylogeny showed that (1) (A/B/D) genotypes were clustered together. The blue color depicts genotype A (n = 55), and pink
Figure 2Marginal density of relative substitution rate densities for all three codon positions of the HBcAg gene.
Table 2 Evolutionary characteristics of HBV genotypes based on the HBcAg gene using the uncorrelated log normal relaxed clock model produced by BEAST
HBV genotype
Location, year reported
HBV TMRCA (years; 95% HPD) Emergence time (year) Substitution rate (CR)* 1.127 (0.925–1.329)
TMRCA(A) Japan,1988 [20] 118 (54–194) 1894
TMRCA (B) Japan,1988 [20] 184 (78–323) 1828
TMRCA (D) Japan,1988 [20] 133 (65–230) 1879
*Substitution rate are expressed as 10-3
Figure 3Marginal density of TMRCA for various HBV genotypes based on the HBcAg gene using an models of exponential population growth and a relaxed molecular clock, which were prepared by BEAST v1.6.1.
Time
1810 1835 1860 1885 1910 1935 1960 1985 2010 1.E1
1.E2 1.E3 1.E4
and green color display, genotypes D (n = 54) and B (n = 44), respectively; (2) genotypes A and D appeared to have a closer evolutional relationship than genotype B. However, they branched laterally from genotype B at an earlier time point; (3) genotype D also has subtypes. The various genotypes of HBV have differences in terms of levels of replication, and expression of viral markers. In addition, natural variations of HBV may occur in the process of the infection in the host. The accumulation of these variations can result in large changes in genomic nucleotide sequences of HBV, and eventually in the appearance of new genotypes.
Evolutionary rate, TMRCA of each HBV genotype we collected
To understand the evolution of HBV, we estimated mo-lecular clock phylogenies, evolution rates, and divergence times using the Bayesian MCMC method. All three codon positions of the HBcAg gene had different relative substi-tution rates (Table 1 and Figure 2). The mean values of the first, second, and third codon positions were 0.506, 1.539 and 0.953, respectively. Among these codon posi-tions, the relative substitution rates of the second and the third codons were all greater than 1. Because the variance ratio was comparatively large, there was high variability and a high outbreak rate of HBV. At the same time, our analysis showed that the HBcAg gene evolutionary rate was estimated to be 1.127E-3 substitutions/site/year (Table 2 and Figure 3). The TMRCA of genotypes A, B and D of HBV were 118, 184 and 133, respectively so their corresponding emergence dates were calculated to be 1894, 1828 and 1879. Table 2 summarizes the dates of ini-tial reports for each genotype included in our analysis. Someone used to calculate the evolutionary rates of HBV by the method of Bayesian algorithm and had found some specific evolutionary areas, these areas may have some-thing to do with the high mutation rates of HBV [11]. The evolution of HBV was also be studied by the gene of HBsAg, its findings showed that HBV has always had high mutation rate in history [12]. Our study used different from these two papers. The first one used 108 HBV ge-nomes. They indeed used more genomes in other geno-types except D. We actually download all HBV genomes and HBcAg region sequences and removed the genomes without region annotation. The second paper used HBsAg gene to do the analysis.
Dynamics of population growth
Bayesian skyline plot analyses was used to investigate the dynamics of HBcAg gene genetic diversity over time (Figure 4), by which changes in genetic diversity can be observed as a function of time. There was a very sharp increase in relative genetic diversity (g) for the HBcAg gene in the first 10 years from 1810. The same tendency
was observed for genotypes A, B, D according the max-imum clade credibility (MCC) tree as shown in Figure 1. The current study shows that the mutation rates for genotype A/B are much higher than that for genotype D. The reason for this may be that the populations included in these studies were mainly European and American, in which genotype A is predominant. in contrast to the situation in Eastern Asia where B genotype is predomin-ant. In Europe and America, hepatitis B immune globu-lin (HBIG) is routinely used to block maternal-neonatal transmission [21], prevent HBV re-infection after liver transplantation [22], as well as to prevent infection after known acute exposures [23]. The observed increase in mutation rates could have been due to the effects of antiviral treatment [24], inoculation of hepatitis B vac-cine or hepatitis B immune globulin [25].
Because the various genotypes of HBV exhibit differ-ent pathogenic features, and responses to drug treat-ment, the study of HBV genotypes has important clinical implications. HBV genotypes (1) can be useful for stud-ies on epidemiology and regional distribution, pathogen-icity and genetic variations, as well as emergence of mutational strains in various populations; (2) can suggest routes of transmission. For example, genotype A has been associated with sexual contact, while genotype D has been associated with blood transmission [14]; (3) the effectiveness of vaccines, particularly with regard to the relationship between genotype and maternal-neonatal transmission; (4) the relationship between genotypes and antiviral efficacy.
Conclusions
We predicted the dynamic phylogenetic trends, which in-dicate outbreak trends of HBV, and provide theoretical foundations for clinical prevention and treatment of HBV.
Competing interests
The authors declare that they have no competing interests.
Authors’contributions
ZN and WGQ conceived the study and designed the experiments. XGY and WCG analyzed the data and wrote the manuscript. GYQ and ZC contributed in data collection. All authors read and approved the final manuscript.
Acknowledgements
We would like to extend our special thanks to the two anonymous reviewers for their helpful comments on our manuscript.
Author details 1
Pharmaceutical College, Beihua University, Jilin city, Jilin 132011, China.2Key Laboratory of Zoonosis, Ministry of Education, Norman Bethune College of Medicine, Jilin University, Changchun, Jilin 130021, China.3Department of Emergency, The First Affiliated Hospital of Jilin University, Changchun, Jilin 130021, China.
References
1. Idrees M, Khan S, Riazuddin S:Common genotypes of hepatitis B virus.
J Coll Physicians Surg Pak2004,14(6):344–347.
2. Li G, Li W, Guo F, Xu S, Zhao N, Chen S, Liu L:A novel real-time PCR assay for determination of viral loads in person infected with hepatitis B virus.
J Virol Methods2010,165(1):9–14.
3. Alam MM, Zaidi SZ, Malik SA, Naeem A, Shaukat S, Sharif S, Angez M, Khan A, Butt JA:Serology based disease status of Pakistani population infected with hepatitis B virus.BMC Infect Dis2007,7:64.
4. McMahon BJ:The influence of hepatitis B virus genotype and subgenotype on the natural history of chronic hepatitis B.Hepatol Intern
2009,3(2):334–342.
5. Yuen MF, Sablon E, Tanaka Y, Kato T, Mizokami M, Doutreloigne J, Yuan HJ, Wong DK, Sum SM, Lai CL:Epidemiological study of hepatitis B virus genotypes, core promoter and precore mutations of chronic hepatitis B infection in Hong Kong.J Hepatol2004,41(1):119–125.
6. Kurbanov F, Tanaka Y, Mizokami M:Geographical and genetic diversity of the human hepatitis B virus.Hepatol Res2010,40(1):14–30.
7. Datta S:An overview of molecular epidemiology of hepatitis B virus (HBV) in India.Virol J2008,5:156.
8. Tran TT, Trinh TN, Abe K:New complex recombinant genotype of hepatitis B virus identified in Vietnam.J Virol2008,82(11):5657–5663. 9. Phung TB, Alestig E, Nguyen TL, Hannoun C, Lindh M:Genotype X/C
recombinant (putative genotype I) of hepatitis B virus is rare in Hanoi, Vietnam–genotypes B4 and C1 predominate.J Med Virol2010, 82(8):1327–1333.
10. Tatematsu K, Tanaka Y, Kurbanov F, Sugauchi F, Mano S, Maeshiro T, Nakayoshi T, Wakuta M, Miyakawa Y, Mizokami M:A genetic variant of hepatitis B virus divergent from known human and ape genotypes isolated from a Japanese patient and provisionally assigned to new genotype J.J Virol2009,83(20):10538–10547.
11. Zhou Y, Holmes EC:Bayesian estimates of the evolutionary rate and age of hepatitis B virus.J Mol Evol2007,65(2):197–205.
12. Zehender G, De Maddalena C, Giambelli C, Milazzo L, Schiavini M, Bruno R, Tanzi E, Galli M:Different evolutionary rates and epidemic growth of hepatitis B virus genotypes A and D.Virology2008,380(1):84–90. 13. Mayerat C, Mantegani A, Frei PC:Does hepatitis B virus (HBV) genotype
influence the clinical outcome of HBV infection?J Viral Hepat1999, 6(4):299–304.
14. Halfon P, Bourliere M, Pol S, Benhamou Y, Ouzan D, Rotily M, Khiri H, Renou C, Penaranda G, Saadoun D,et al:Multicentre study of hepatitis B virus genotypes in France: correlation with liver fibrosis and hepatitis B e antigen status.J Viral Hepat2006,13(5):329–335.
15. Cock PJ, Fields CJ, Goto N, Heuer ML, Rice PM:The Sanger FASTQ file format for sequences with quality scores, and the Solexa/Illumina FASTQ variants.Nucleic Acids Res2010,38(6):1767–1771.
16. Tamura K, Peterson D, Peterson N, Stecher G, Nei M, Kumar S:MEGA5: molecular evolutionary genetics analysis using maximum likelihood, evolutionary distance, and maximum parsimony methods.Mol Biol Evol
2011,28(10):2731–2739.
17. Drummond AJ, Rambaut A:BEAST: Bayesian evolutionary analysis by sampling trees.BMC Evol Biol2007,7:214.
18. Yang Z:Maximum likelihood phylogenetic estimation from DNA sequences with variable rates over sites: approximate methods.
J Mol Evol1994,39(3):306–314.
19. Drummond AJ, Rambaut A, Shapiro B, Pybus OG:Bayesian coalescent inference of past population dynamics from molecular sequences.
Mol Biol Evol2005,22(5):1185–1192.
20. Okamoto H, Tsuda F, Sakugawa H, Sastrosoewignjo RI, Imai M, Miyakawa Y, Mayumi M:Typing hepatitis B virus by homology in nucleotide sequence: comparison of surface antigen subtypes.J Gen Virol1988, 69(Pt 10):2575–2583.
21. Kohno H, Inoue T, Tsuda F, Okamoto H, Akahane Y:Mutations in the envelope gene of hepatitis B virus variants co-occurring with antibody to surface antigen in sera from patients with chronic hepatitis B.
J Gen Virol1996,77(Pt 8):1825–1831.
22. Mathet VL, Feld M, Espinola L, Sanchez DO, Ruiz V, Mando O, Carballal G, Quarleri JF, D’Mello F, Howard CR,et al:Hepatitis B virus S gene mutants in a patient with chronic active hepatitis with circulating Anti-HBs antibodies.J Med Virol2003,69(1):18–26.
23. Lee PI, Chang LY, Lee CY, Huang LM, Chang MH:Detection of hepatitis B surface gene mutation in carrier children with or without
immunoprophylaxis at birth.J Infect Dis1997,176(2):427–430. 24. Kao JH:Hepatitis B virus genotypes and hepatocellular carcinoma in
Taiwan.Intervirology2003,46(6):400–407.
25. Hsu HY, Chang MH, Liaw SH, Ni YH, Chen HL:Changes of hepatitis B surface antigen variants in carrier children before and after universal vaccination in Taiwan.Hepatology1999,30(5):1312–1317.
doi:10.1186/1743-422X-10-256
Cite this article as:Xuet al.:An analysis of the molecular evolution of Hepatitis B viral genotypes A/B/D using a Bayesian evolutionary method.Virology Journal201310:256.
Submit your next manuscript to BioMed Central and take full advantage of:
• Convenient online submission
• Thorough peer review
• No space constraints or color figure charges
• Immediate publication on acceptance
• Inclusion in PubMed, CAS, Scopus and Google Scholar
• Research which is freely available for redistribution