Comparison between Tagged Corpora for the N a m e d Entity
Task
C h i ~ s h i N O B A T A N i g e l C O L L I E R a n d J u n ' i c h i T S U J I I K a n s a i A d v a n c e d R e s e a r c h C e n t e r D e p a r t m e n t o f I n f o r m a t i o n S c i e n c e C o m m u n i c a t i o n s R e s e a r c h L a b o r a t o r y G r a d u a t e S c h o o l o f S c i e n c e
588-2 I w a o k a , I w a o k a - c h o , N i s h i - k u U n i v e r s i t y o f T o k y o , H o n g o 7-3-1 K o b e , H y o g o , 65].-2492 J A P A N B u n k y o - k u , T o k y o , 1 1 3 - 0 0 3 3 J A P A N
nova@crl, go. j p {nigel, tsuj ii}@is, s. u-tokyo, ac. jp
A b s t r a c t
W e present two measures for compar- ing corpora based on infbrmation the- ory statistics such as gain ratio as well as simple term-class ~equency counts. We tested the predictions made by these measures about corpus difficulty in two domains - - news and molecular biol- ogy - - using the result of two well-used paradigms for NE, decision trees and HMMs and found that gain ratio was the more reliable predictor.
made by these measures against actual system performance.
Recently IE systems based on supervised learn- ing paradigms such as hidden Markov models (Bikel et al., 1997), maximum entropy (Borth- wick et al., 1998) and decision trees (Sekine et al., 1998) have emerged that should be easier to adapt to new domains than the dictionary-based systems of the past. Much of this work has taken advantage of smoothing techniques to overcome problems associated with data sparseness (Chen and Goodman, 1996).
The two corpora we use in our NE experiments represent the following domains:
1 I n t r o d u c t i o n
With the advent of the information society and increasing availability of large m o u n t s of infor- mation in electronic form, new technologies such as information extraction are emerging to meet user's information access needs. Recent evalu- ation conferences such as TREC (Voorhees and Harman, 2000) showed the feasibility of this task and highlighted the need to combine information r e t r i e d
(m)
and extraction (IE) to go beyond simply offering the user a long ranked list of in- teresting documents to providing facts for user's questions.The problem of domain dependence remains a serious one and in fact there has been very little work so far to compare the difllculty of IE tasks for different domaln~ and their corpora. Such knowl- edge is useful for developing IE systems that are portable between domains. This paper begins to address this issue, in particular the lowest level of IE task, defined in the T I P S T E R sponsored MUC- 6 conference (MUC, 1995) as
named entity (NE).
This is emerging as a key technology in several other IF-related tasks such as question answer- ing. We seek here to show theoretically motivated measures for comparing the ditficulty of corpora for the NE task in two domains, newswire and molecular-biology. We then test the predictions
• Newswire: acquisition of names of people, or- ganizations and monetary units etc., from the MUC-6 data set.
• Molecular-biology: acquisition of proteins, DNAs, RNAs etc. from a subset of the MED- LINE database (MEDLINE, 1999).
Information extraction in the molecular-biology domain (Seldmlzu et al., 1998) (Craven and Kum- lien, 1999) (Rindflesch et al., 2000) has recently become a topic of interest to the NLP community. This is a result of the need to formalise the huge number of research results that appear in free-text form in online collections of journal abstracts and papers such as MEDLINE for databases such as Swissprot (Ban:och and Apwefler, 1997) and also to search such collections for facts in an intelligent way.
The purpose of our study is not to show a high level of absolute system performance. In fact since we use only the MUC-6 executive succession data set of 60 articles and a new MEDLINE data set of 100 articles we cannot hope to achieve perfor- mance limits. W h a t we aim to do is to compare model performance against the predictions of cor- pus difficulty made by two different methods. In the rest of this paper we firstly introduce the NE models used for evaluation, the two corpora we
examined and then the difficulty comparison met- rics. Predictive scores from the metrics are ex- amined against the actual performance of the NE models.
2 M o d e l s
Recent studies into the use of supervised learning- based modeels for the NE task in the molecular- biology domain have shown t h a t models based on hidden Markov models (HMMs) (Collier et al., 2000) and decision trees (Nobata et al., 1999) are not only adaptable to this highly technical do- main, but are also m u c h more generalizable to new classes of words than systems based on traditional hand-built heuristic rules such as (Fukuda et al., 1998). W e n o w describe two models used in our experiments based on the decision trees package C4.5 (Quiuian, 1993) and H M M s (Rabiner and Juang, 1986).
2.1 Decision tree n a m e d entity r e c o g n i s e r : N E - D T
A decision tree is a type of classifier which has "leaf nodes" indicating classes and "decision nodes" that specify some test to be carried out, with one branch or subtree for each possible out- come of the test. A decision tree can be used to classify an object by starting a t the root of the tree and moving through it until a leaf is en- countered. When we can define suitable features for the decision tree, the system can achieve good performance with only a small amount of training data.
The system we used is based on one t h a t was originally created for Japanese documents ( S e i n e et al., 1998). It has two phases, one for creating the decision tree from training d a t a and the other for generating the class-tagged text based on the decision tree. When generating decision trees, tri- grams of words were used. For this system, words are considered to be quadruple features. The fol- lowing features are used to generate conditions in the decision tree:
P a r t - o f - s p e e c h i n f o r m a t i o n : There are 45 part-of-speech categories, whose definitions are based on Pennsylvania Treebank's cat- egories. We use a tagger based on Adwait Ratnaparkhi's method (Ratnaparkhi, 1996). Character type i n f o r m a t i o n : Orthographic
information is considered such as upper case, lower case, capitalization, numerical expres- sions, symbols. These character features are the same as those used by N E H M M
described in the next section and shown in T a b l e 1.
W o r d l i s t s s p e c i f i c t o t h e d o m a i n : Word lists are made from the training corpus. Only the 200 highest fxequency words are used.
2.2 H i d d e n M a r k o v m o d e l n a m e d e n t i t y r e c o ~ . i s e r : N E H M M
HMMs are a widely u ~ d class of learning algo- rithms and can be considered to be stochastic fi- nite state machines. In the following model, sum- marized here from the full description given in (Collier et al., 2000), we consider words to be or- dered pairs consisting of a surface word, W , and a word feature, F , given as < W, F >. The word features themselves are discussed below. As is common practice, we need to calculate the prob- abilities for a word sequence for the first word's name class and every other word differently since we have no initial name-class to make a transition from. Accordingly we use the following equation to calculate the initial name class probability,
Pr(NC~[ < Wf~,t , Flli,,~ > ) = aof(NC$,,s,[ < Wf,,,,,Ffi,,t > ) +
o~f(gcs~,,,I
< -,Ff~,,, >) +a~f(NCfi,.,,)
(i)
and for all other words and their name classes as follows:
Fr(NCT~ I < Wt,Ft > , < W~-,,Ft-, >,NC~-i) = Aof(NGtl < W~,F~ > , < Wt-,,Ft-1 >,NG~-,) + Alf(NCtI < .,F~ > , < W~-I,F~-i > , N C ~ - i ) + A2f(NC~I < W,,F~ >, < .. F,-, >,NCt-x) + AsI(NG, I < .,Ft > , < _, F~-, > , N G , - , ) + A4f(NC, INC,-,) +
Asf(NC,) (2)
where f(I) is calculated with maximum- likelihood estimates from counts on training data. In our current system we set the constants Ai and al by hand and let ~ ai = 1.0, ~ Ai = 1.0, ao _> a l > ~ , ~o >_ A , . . . >_ As. The cur- rent name-class N C t is conditioned on the cur- rent word and feature, the previous name-class, NCt-1, and previous word and feature.
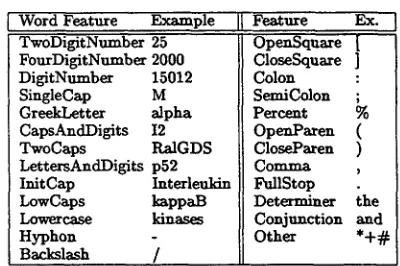
Table 1: Word features v~ith examples Word Feature Example
T w o D i g i t N ~ 25 FourDigitNumber 2000 DigitNumber 15012 SingleCap M GreekLetter alpha CapsAndDigits 12 TwoCaps R a l G D S LettersAnd.Digits p52
I n i t C a p Interleukin LowCaps kappaB Lowercase kinases Hyphon
Backslash /
Feature Ex.
CloseSquare ] Colon
SemiColon ; Percent % OpenParen ( CloseParen ) C o m m a FullStop . Determiner the Conjunction and Other * + ~
Once the state transition probabilities have been calculated according to Equations 1 and 2, the Viterbi algorithm (Viterbi, 1967) is used to search the state space of possible name class as- signments in linear time to find the highest prob- ability path, i.e. to maximise P r ( W , NC). The fi- nal stage of our algorithm t h a t is used after narae- class tagging is complete is to use a clean-up mod-
ule called Unity. This creates a frequency list of words and name-classes and then re-tags the text using the most frequently used name class assigned by the HMM. We have generally found t h a t this improves F-score performance by be- tween 2 and 4%, b o t h for re-tagging spuriously tagged words and for finding untagged words in unknown contexts t h a t had been correctly tagged elsewhere in the text.
Table 1 shows the c h a r ~ t e r features that we used in b o t h NEHMM and NE-DT. Our intuition is that such features will help the model to find similarities between known words t h a t were found in the training set and unknown words and so overcome the unknown word problem.
3 C o r p o r a
We used two corpora in our experiments repre- senting two popular domains in IE, molecular- biology (from MEDLINE) and newswire texts (from MUC-6). These are now described.
3.1 M U C - 6
The corpus for MUC-6 (MUC, 1995) contains 60 articles, from the test corpus for the dry and for- malruns. An example c a n b e s e e n i n Figure 1. We can see several interesting features of the domain such as the focus of NF.,s on people and organiza- tion profiles. Moreover we see t h a t there are many pre-name clue words such as "Ms." or "Rep." indi-
cating that a Republican politician's n a m e should follow.
3.2 Biology
In our tests in the domain of molecular-biology w e are using abstracts available from PubMed's MEDLIhrE. The MEDLINE database is an online collection of abstracts for published journal arti- cles in biology and medicine and contains more than nine million articles. Currently w e have ex- tracted a subset of MEDLINE based on a search using the keywords human AND blood cell AND transcription .factor yielding about 3650 abstracts. Of these 100 docmnents were NE tagged for our experiments using a human domain expert. An example of the annotated abstracts is shown in Figure 2. In contrast to MUC-6 each article is quite short and there are few pre-class clue words making the task much more like terminology iden- tification and classification than pure name find- ing.
4 A f i r s t a t t e m p t a t c o r p u s c o m p a r i s o n b a s e d o n s i m p l e t o k e n f r e q u e n c y
A simple and intuitive approach to NE task dif- ficulty comparison used in some previous studies such as (palmer and Day, 1997) who studied cor- p o r a in six different languages, compares class to term-token ratios on the assumption that rarer classes are more difficult to acquire. T h e relative frequency counts from these ratios also give an in- direct measure of the granularity of a class, i.e. h o w wide it is. While this is appealing, we show that this approach does not necessarily give the best metric for comparison.
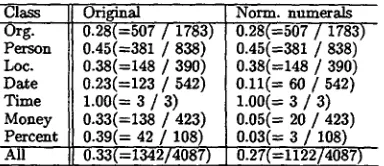
Tables 2 and 3 show the ratio of the number of different words used in N E s to the total number of words in the N E class vocabulary. T h e num- ber of different tokens is influenced by the corpus size and is not a suitable index that can uniformly show the difficulty for different NE tasks, there- fore it should be normalized. Here we use words as tokens. A value close to zero indicates little variation within the class and should imply t h a t the class is easier to acquire. We see t h a t the NEs in the biology domain seem overall to be easier to acquire than those in the MUC-6 domain given hxical variation.
The figures in the second columns of Tables 2 and 3 are normalized so t h a t all numerals are re- placed by a single token. I t still seems though t h a t MUC-6 is a considerably more eheJlenging domain than biology. This is despite the fact t h a t the ratios for ENAMEX expressions such as Date,
[image:3.596.130.330.91.224.2]A graduate of <ENAMEX TYPE=" ORGANIZATION" >Harvard Law SChooI</ENAMEX>, Ms. <ENAMEX TYPE="PERSON'>Washington</ENAMEX> worked as a laywer for the corporate fi- nance division of the <ENAMEX TYPE='ORGANIZATION~>SEC</ENAMEX> in the late <TIMEX TYPE='DATE">1970s</TIMEX>. She has been a congressional staffer since <TIMEX TYPE= "DATE'>1979</TIMEX>. Separately, <ENAMEX TYPE='PERSON'>Clintou</ENAMEX> transi- tion officials said that <ENAMEX TYPE='PERSON">Frank Newman</ENAMEX>, 50, vice chairman and chief financial officer of <ENAMEX TYPE=" ORGANIZATION" >BankAmerica Corp.</ENAMEX>, is expected to be nominated as assistant <ENAMEX TYPE="ORGANIZATION~>Treasury</ENAMEX> secretary for domestic finance.
Figure 1: Example sentences taken from the annotated MUC-6 NE text
<PROTEIN>SOX-4</PROTEIN>, an <PROTEIN>Sty-like HMG box protein</PROTEIN>, is a transcriptional activator in <SOLrRCE.cell-type>lymphocytes</SOUl:tCE>. Previous studies in <SOURCE.cell-type>lymphocytes</SOUB.CE> have described two DNA-binding <PROTEIN>HMG bax proteins</PROTEIN>, <PROTEIN>TCF-I</PROTEIN> and <PROTEIN>LEF-I</PROTEIN>, with affinity for the <DNA>A/TA/TCAAAG motif</DNA> found in several <SOURCE.cell-type>T cell</SOUl~CE>-specific enhancers. Evaluation of cotransfection experiments in <SOURCE.cell-type>non- T cells</SOURCE> and the observed inactivity of an <DNA>AACAAAG concatamer</DNA> in the <PROTEIN>TCF-1 </PROTEIN> / <PROTEIN>LEF-1 </PROTEIN>-expressing <SOURCE.cell-line>T cell line BW5147</SOURCE>, led us to conclude that these two proteins did not mediate the observed enhancer effect.
Figure 2: Example sentences taken from the annotated biology text
Table 2: Frequency values for words in the MUC-6 test corpus
Class Org. Person Loc. Date Time Money Percent A l l
Original
0.28(=507 / 1783) 0.45(=381 / 838) 0.38(=148 / 390) 0.23(=123 / 542)
1.00(= 3 / 3) 0.33(=138 / 423) 0.39(= 42 / 108) 0.33(=1342/4087)
Table 3: Frequency values for words in the biology corpus
Norm. numerals Class Original
0.28(=507 / 1783) DNA 0.21(=245 / 1140) 0.45(=381 / 838) Protein 0.15(=631 / 4125) 0.38(=148 / 390) RNA 0.43(= 30 / 70) 0.11(= 60 / 542) Source 0.16(=248 / 1533) 1.00(= 3 / 3) All 0.17(=1'154/6868) 0.05(= 20 / 423)
0.03(= 3 / 108) 0.27(=1122/4087)
Money and Percent all fall significantly. Expres- sions in the Time class are so rare however that it is d i ~ c u l t to make any sort of meaningftfl compar- ison. In the biology corpus, the ratios are not sig- nificantly changed and the NE classes defined for biology documents seem to have the same chuj-- acteristics as non-numeric ENAMEX classes in MUCC-6 documents.
Comparing between the biology documents and the MUC-6 documents, we may say that identify- ing entities in biology docmnents is easier than identifying ENAMEX entities in MUC-6 docu- ments.
5
E x p e r i m e n t s
We evaluated the performance of our two systems using a cross validation method. For the MUC- 6 corpus, 6-fold cross validation was performed on the 60 texts and 5-fold cross validation was performed for the 100 texts in the biology corpus.
Norm. numerals 0.20(=228 / 1140) 0.13(=540 / 4125) 0.43(= 30 / 70)
0.16(=242 / 1833).
0.15(=I040/6868)We use "F-scores ~ for evaluation of our experi- ments (Van Rijsbergen, 1979). "F-score" is a mea- surement combining "Recall" and "Predsion" and defined in Equation 3. "Recall" is the percent- age of answers proposed by the system t h a t corre- spond to those in the human-made key set. "Pre- cision" is the percentage of correct answers among the answers proposed b y the system. The F-scores presented here are automatically calculated using a scoring program (Chinchor, 1995).
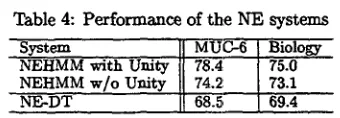
2 x Precision x Recall F-score = Precision + Recall (3) In Table 4 we show the actual performance of our term recognition systems, NE-DT and NEHMM. We can see t h a t corpus comparisons based only on class-token ratios are inadequate to explain why both systems' performance was about the same in both domains or why NEHMM did better in both test corpora than NE-DT. The dif- ference in performance is despite there being more training examples in biology (3301 NEs) than in MUC-6 (2182 NEs). Part of the reason for this is
[image:4.596.111.303.338.421.2]Table 4: Performance of the NE systems
NEHMM with Unity 7&4 75.0 NEHMM w/o Unity 74.2: 73.1
NE-DT 68:~-" 69.4
that the class-token ratios ignore individual sys- tem knowledge, i.e. the types of features that can be captured and useful in the corpus domain. Among other considerations they also fail to con- sider the overlap of words and features between classes in the same corpus domain.
6 C o r p u s c o m p a r i s o n b a s e d o n i n f o r m a t i o n t h e o r e t i c a l m e a s u r e s In this section we attempt to present measures that overcome some of the limitations of the class- token method. We evaluate tbe contribution from each feature used in our NE recognition systems by calculating its entropy. There are t h e e types of feature information used by our two systems: lexo ical information, character type information, and part-of-speech information.
The entropy for NE classes
H(C)
is defined by= - E p(c) l o g 2 p(c)
H(C)
c E Cwhere:
n(O
p(c) = " N
n(c): the number of words in class c N: the total number of words in text We can calculate the entropy for features in the same way.
When a feature F is given, the conditional en- tropy for NE classes
H(CIF)
is defined by- ~ ~ p(~, f) logs p(cll)
H(C]F)
cEC f E F
where:
p(c, I)
=.(c, I)
N n(c, I)p(cll) = n(l)
n(c, f ) : the number of words in class c with the feature value f n ( / ) : the number of words
with the feature value f
Using these entropies, we can calculate infor- mation gain (Breiman et al., 1984) and gain ra- tio (Quinlan, 1990). Information gain for NE classes and a feature
I(C; F) is
given as follows:I(C; F) = H(C) - H(CIF )
The information gain
I(C; F)
shows how the fea- ture F is related with NE classes C. When F is completely independent of C, the value ofI(C; F)
becomes the m i n i m u m value O. The maximum value of
I(C;_F)
is equivalent to that of H(C), when the feature F gives sufficient information to recognize named entities. Information gain can also be calculated by:I ( C ; F) =
H(C) + H(F) - H(C, F)
W e show the values of the above three entropies in Table 5,6, and 7. In these tables, F is replaced with single letters which represent each of the model's features, i.e. character types (T), part- of-speech (P), and hxical information (W).Gain ratio is the normalized value of in.forma- tion gain. The gain ratio
GR(C; F)
is defined byGR(C;
F) = I(C;F)
H(C)The range of the gain ratio
GR(C; F)
is 0 <GR(C;
F) _~ 1 even when the class entropy is different in various corpora, so we can compare the values directly in the different NE recognition tasks.6.1 Character types
Character type features are used to identify named entities in the MUCC-6 and biology corpus. However, the distribution of the character types are quite different between these two types of doc- uments as we can see in Table 5. W e see through the gain-ratio score that character type informa- tion has a greater predictive power for classes in M U C ~ than biology due to the higher entropy of character type and class sequences in the bi- ology corpus, i.e. the greater disorder of this in- formation. The result partially shows why iden- tification and classification is harder in biological documents than in newspaper articles such as the M U C - 6 corpus.
6 . 2 P a r t - o f - s p e e c h
Table 6 shows the entropy scores for part-of- speech (POS) sequences in the two corpora. We see through the gain ratio scores that POS infor- mation is not so powerful for acquiring NEs in the biology domain compared to the MUC-6 domain.
[image:5.596.145.315.73.132.2]Table 5: Values of Entropy for character type Entropy MUC-6 Biology H(T) [[ 1.880 2.013
H(C)
II
0.890 1.264H(C,T)
II
2.345 2.974 I(C;T)[I
.0.425 0.302 GR(C;T) H 0.478 0.239Table 6: Values of Entropy for POSs Entropy MUC-6 Biology "H(P) 4.287 4.037
H(C) 0.890 1.264 H(C,P) 4.750 5.029 I(C;P) 0.426 0.272 GR(C;P) 0.479 0.216
In fact POS information for biology is far less use- ful than character information when we compare the results in Tables 5 and 6, whereas POS has about the same predictive power as character in- formation in the MUC-6 domain. One likely ex- planation for this is t h a t the POS tagger we use in NE-DT is trained on a corpus based on newspaper articles, therefore the assigned POS tags are often incorrect in biology documents.
6.3 Lexical i n f o r m a t i o n
Table 7 shows the entropy statistics for the two domains. Although entropy for words in biology is lower than MUC-6, the entropy for classes is higher leading to a lower gain ratio in biology. We also note that, as we would expect, in comparison to the other two types of knowledge, surface word forms are by far the most useful type of knowledge with a gain ratio in MUC-6 of 0.897 compared to 0.479 for POS and 0.478 for character types in the same domain. However, such knowledge is also the least generalizable and runs the risk of data- sparseness. It therefore has to be complemented by more generalizable knowledge such as character features and POS.
Table 7: Values of Entropy for words --Entropy M U C - 6 Biology
H(W) 9.570 8.89O
H(C) 0.890 1.264 H(C,W) 9.662 9.232 I(C;W) 0.798 0.921 ~ R ( C ; W )
0.897
0.729
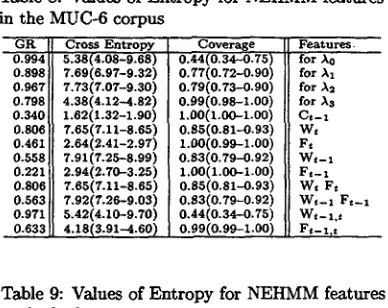
Table 8: Values of Entropy for NEHMM features in the MUC-6 corpus
G R 0.994 0.898 0.967 0.798 0.340 0.806 0.461 0.558 0.221 0.806 0.563 0.971 0.633
Cross Entropy 5.38(4.08-9.68) 7.69(6.97-9.32) 7.73(7.07-9.30) 4.38(4.12-.-4.82) 1.62(1.32-1.90) 7.65(7.11-8.65) 2.64(2.41-2.97) 7.91(7.25--8.99) 2.94(2.70-3.25) 7.65(7.11-6.65) 7.92(7.26-9.03) 5.42(4.10-9.70) 4.18(3.91-4.60) Coverage o.44(o.34-o.78) O. 77(0.72-0.90)
0.79(0.73-0.90) 0.99(0.98-1.00) L00(1.00-L00) 0.65(0.81-0.93) 1.00(0.99-1.00) 0.83(0.79-0.92) 1.00(1.00-1.00) 0.85(0.81,-0.93) 0.83(0.79-0.92) 0.44 (0.34-O.75) 0.99(0.99--1.00) Features. for A0 for Al for A2 for As Ct-1 W t Ft W t - I
F~-x Wt Fz W~-l F=-i Wt-l,~ F~-Lt
Table
in the biology corpus
G R Cross Entropy 0.977 5.83(5.66-6.14) 0.793 7.93(7.77-8.08) 0.929 7.79(7.65-7.85) 0.643 5.07(4.95-5.21) 0.315 2.26(2.24--2.28) 0.694 7.64(7.52-7.78) 0.257 3.12(3.06--3.19) 0.423 7.99(7.62-8.08)
0.093 3.33(3.27-3,43) 0.694 7.64(7.52-7.78) 0.424 7.98(7.82-8.04) 0.904 5.96(5.78-6.24) 0.339 4.66(4.53-4,78)
9: Values of Entropy for NEHMM features
Coverage 0.49(0.48--0.52) o.6o(o.79-o.61) o.so(o.70-o.81) 0.98(0.98-0.98) 1.00(1.00-I.00) 0.89(0.87-0.89) 1.oo(1.OO-l.OO) 0.87(0.86-0.88) 1.00(1.00-1.00) 0.89(0.87-0,89) o.87(0.85-0.86) 0.50(0.49-0.52) 0.99(0.98-0.99) Features for ~to
for A1
for ~t2 for As Ct- I W = Fe
W t Ft
W t - 1 F,-z
Wz-l,t F~-l,t
6.4 C o m p a r i s o n b e t w e e n the comblnutlon of features
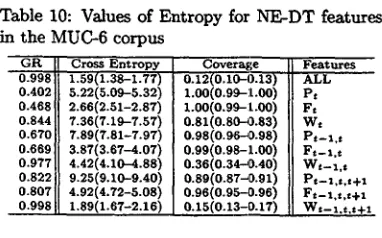
In this section w e show a comparison of gain ra- tio for the features used by both systems in each corpus. Values of gain ratio for each feature set are shown on the 'GR' column in Tables 8, 9, 10 and 111. The values of G R show that surface words have the best contribution in both corpora for both systems. W e can see that gain ratio for all features in N E - D T is actually lower than the top level model for N E H M M in biology, reflecting the actual system performance that we observed.
W e also see that in the biology corpus, the com- bination of all features in N E - D T has a lower con- tribution than in the M U C - 6 corpus. This indi- cates the limitation of the current feature set for the biology corpus and shows that we need to uti- lize other types of features in this domain.
[image:6.596.313.507.84.238.2] [image:6.596.311.509.233.369.2]Table 10: Values of Entropy for NE-DT features in the MUC-6 corpus
0.G91~8 ! Cross Entropy 1.59(1.38-1.77) 0.402 5.22(5.09..-5.32) 0.4681 2.66(2.51-2.87) 0.844 7.36(7.19-7.57) 0.670 7.89(7.81-7.97) 0.6691 3.87(3.67-4.07) 0.977 4.42(4.10-4.88) 0.822 9.25(9.10-9.40) 0.807 4.92(4.72-5.08) 0.998 1.89(1.67-2.16)
Coverage
0.12(0.10-0.13)
1.00(0.99-:t.00) L00(0.99-1.00) o.81(o.8o~.83)
0.98(0.96--0.98)
0.99(0.98-1.00) 0.36(0.34--0.40) 0.89(0.87~0.91) 0.96(0.95--0.96)
0.15(0.13-9.17)
Features ALL Pt Ft Wt Pt-l,$ F t - l . t Wt--l,t P t - l , t , t + l F¢-1.:.~+1 W~-l.t.t+l
Table 11: Values of Entropy for NE-DT features in the biology corpus
G R Cross Entropy 0.937 2.31(2.00-2.50) 0.23"/ 5.31(5.21-5.38) 0.262 3.27(3.14-3.41)
0.416 7.63(7.50-7.79) 0.370 7.78(7.69.-7.86) 0.363 4.57(4.38-4.67) 0.586 5.71(5.37-5.93) 0.541 8.92(8.82-9.02) 0.502 5.46(5.26-5.64)
0.764 2.56(2.25-2.76)
Coverage Features
0.18(0.15-0.19) ALL 1.00(0.99-1.00) P, 1.00(1.00-1.00) Ft
0.87(0.85--0.68) wt 0.97(0.96-0.97) P~-a.=
0.98(0.98-.0.99) F~-I,~ 0.48(0.45--0.50) W t - s,~
0.88(0.87--0.89) Pt-x.~t.t +a
0.96(0.94--0,96) Ft-l.t.~+a
0.20(0.17--0.21) Wt_L¢,t+t
gether with error bounds in parentheses. These values are calculated for pairs of an NE class and features, and averaged for the n-fold experiments. In the MUC-6 corpus, 60 texts are separated into 6 subsets, and one of them is used as the test set and the others are put together to form a train- ing set. Similarly, 100 texts are separated into 5 subsets in the biology corpus. We also show the coverage of the pairs on the 'Coverage' col,,mn. Coverage means t h a t how many pairs which ap- peared in a test set also appear in a trainlug set.
In these columns, the greater the cross entropy between features and a class, the more different their occurrences between tr~iuing and test sets. On the other hand, as the coverage for class- features pairs increases, so does the p a r t of the test set that is covered with the given feature set. The results in both corpora for b o t h systems show a drawback of surface words, since their cov- erage for a test set is lower than t h a t of features like POSs and character types in b o t h c o r p o r a Also, the coverage of surface words in the biol- ogy corpus is higher t h a n in the MUC6 corpus as opposed to other features. The result matches our intuition that vocabulary in the biology corpus is relatively restricted but has a variety of types other than normal English words.
7 C o n c l u s i o n
The need for soundly-motivated metrics to com- pare the usefulness of corpora for specific tasks
and systems is d e a r l y necessary for the develop- ment of robust and portable information extrac- tion systems.
In this paper we have shown t h a t measures for comparing corpora based just on class-token ratios have difficulty predicting system performance and cannot adequately explain the difficulty of the NE t a s k either generally or for specific systems.
While we should be cautious in m a ~ n g sweep- ing conclusions due to the small size of corpora in our study, our results from gain ratio and cross entropy indicate t h a t counts from the features of b o t h systems will be more useful in the MUC6 cor- pus than in the biology corpus. We can also see t h a t while the coverage is limited, surface words play a leading role for both systems. Gain ra- tio statistics for surface words in the two domains were far closer t h a n for any other t y p e of feature, and given that this is also the dominant knowl- edge type this seems to be one likely reason t h a t the performance of systems is about the same in b o t h domains.
We have presented the results of applying two supervised learning based models to the named entity task in two widely different domains and explained the performance through class-token ra- tios, entropy and gain ratio. Measures such as entropy and gain ratio have been found to have the best predictive power, although the features used to calculate gain ratio are not sufficient to describe all the information t h a t is necessary for the named entity task. In future work we intend to extend our study t o new and larger NE corpora in various domains and to try to reduce the error factor in our calculations t h a t is a result of corpus size.
R e f e r e n c e s
A. Bairoch and 1t. Apweiler. 1997. The SWISS- P R O T protein sequence d a t a bank and its new supplement TrEMBL.
Nucleic Acids Research,
25:31-36.
D. Bikel, S. Miller, R. Schwartz, and 11. Wesichedel. 1997. Nymble: a high- performance learning name-finder. In Pro-
ceedings of the Fifth Con/ererenee on Applied
Natural Language Processing, pages
194--201. A. Borthwiek, J. Sterling, E. Agichtein, and11. Grishman. 1998. Exploiting diverse knowl- edge sources via maximum entropy in named entity recognition. In
Proceedings of the Work-
shop
on Very Large Corpora (WYLC'98).
L. Breiman, It. Friedman, A. Olshen, and C. Stone. 1984.
Classification and regressiwa
[image:7.596.132.323.71.190.2]trees. Belmont CA: Wadsworth International Group.
S. Chen and J. Goodman. 1996. A n empiri- cal study of smoothing techniques for language
modeling.
3gst Annual Meeting of the Associ-
ation of Computational Linguistics, California,
USA,
24-27 3tree.N. Chinchor. 1995. MUC-5 evaluation metrics.
In In Proceedings of the Fifth Message Un-
derstanding Conference (MUC-5), Baltimore,
Maryland, USA.,
pages 69-78.N. Collier, C. Nobata, and J. Tsujii. 2000. Ex- tracting the names of genes and gene products
with a hidden Markov model. In
Proceedings
of the 18th International Conference on Com-
putational Linguistics (COLING'2000), Saar-
bruchen, Germany,
July 31st-August 4th.M. Craven and J. Kumlien. 1999. Constructing biological knowledge bases by extracting infor-
mation from text sources. In
Proceedings of the
7th International Conference on Intelligent Sys-
temps for Molecular Biology (ISMB-99),
Hei- delburg, Germany, August 6--10.K. Fukuda, T. Tsunoda, A. Tamura, and T. Tak-
ag i. 1998. Toward information extraction:
identifying protein names from biological pa-
pers. In
Proceedings of the Pacific Symposium
on Biocomputin9'98 (PSB'98), January.
MEDLINE. 1999. The PubMed
database can be found at:.
http://www.ncbi.nlm.nih.gov/PubMed/.
DARPA. 1995.
Proceedings of the Sixth Message
Understanding Conference(MUC-6),
Columbia, MD, USA, November. Morgan Kaufmann.C. Nobata, N. Collier, and I. Tsujii.
1999.
Au- tomatic term identification and classification in biology texts.In Proceedings of the Nat-
ural Language Pacific Rim Symposium (NL-
PRS'gO00),
November.D. Palmer and D. Day. 1997. A statistical
profile of the named entity task. In Proceed-
ings of the Fifth Conference on Applied Natural
Language Processing (ANLP'97), Washington
D.C., USA.,
31 March - 3 April.J.R. Quinlan. 1990. Introduction to Decision Trees. In J.W. Shavlik and T.G. Dietterich, ed-
itors,
Readings in Machine Learning.
MorganKauf:marm Publishers, Inc., San Mateo, Cali- fornia.
J.R. Quinlan. 1993.
cJ.5 Programs for Machine
Learning.
Morgan Kaufmann Publishers, Inc., San Mateo, California.L. Rabiner and B. Juang. 1986. An introduction
to bidden Markov models.
1EEE ASSP Maga-
zine,
pages 4-16, January.A. Ratnaparkhi. 1996. A maximum entropy
model for part-of-speech tagging. In
Uon]er-
ence on Empirical Methods in Natural Language
Processing,
pages 133-142, University of Penn- sylvania, May.T. Rindflesch, L. Tanabe, N. Weinstein, and L.. Hunter. 2000. EDGAR: Extraction of drugs, genes and relations from the biomedical litera-
ture. In
Pacific Symposium on Bio-inforraaties
(PSB '2000), Hawai 'i, USA, January.
T. Sekimizu, H. Park, and J. Tsujii. 1998. Iden-
tifying the interaction between genes and gene
products based on frequently seen verbs in reed-
line abstracts. In
Genome Informatics.
Univer-sal Academy Press, Inc.
Satosbi Sekine, Ralph Grishman, and Hiroyuki Sbinnou. 1998. A Decision Tree Method for
Finding and Classifying Names in Japanese
Texts. In
Proceedings o] the Sixth Workshop
on Very Large Corpora,
Montreal, Canada, Au- gust.C. Van Rijsbergen. 1979.
Information Retrieval.
Butterworths, London.
A. J. Viterbi. 1967. Error bounds for convolutions codes and an asymptotically optimum decoding
algorithm.
IEEE Transactions on Information
Theory, IT-13(2):260-269.
E.M. Voorhees and D.K. Harman, editors.
2000.
The Eighth Text REtrieval Confer-