Learning cascaded latent variable models for biomedical text classification
Ming Liu Gholamreza Haffari
Faculty of Information Technology, Monash University
ming.m.liu, gholamreza.haffari, wray.buntine @ monash.edu Wray Buntine
Abstract
In this paper, we develop a weakly su-pervised version of logistic regression to help to improve biomedical text classi-fication performance when there is lim-ited annotated data. We learn cascaded latent variable models for the classifica-tion tasks. First, with a large number of unlabelled but limited amount of labelled biomedical text, we will bootstrap and semi-automate the annotation task with partially and weakly annotated data. Sec-ond, both coarse-grained (document) and fine-grained (sentence) levels of each in-dividual biomedical report will be taken into consideration. Our experimental work shows this achieves higher classification results.
1 Introduction
In recent years, large amounts of biomedical text have become available with the development of electronic medical record (EMR) systems. The type of biomedical text ranges from reports of CT scans to doctoral notes and discharge summaries. Based on these biomedical text, there are medi-cal tasks such as disease identification, diagnostic surveillance and evaluation and other clinical sup-port services. Manual extraction and classification for these medical tasks from biomedical text is a time-consuming and often costly effort.
Biomedical text classification systems which consider both manual effort (e.g. annotation) and predictive performance are more appropriate in the medical context than those which only con-sider classification predictive performance. Early biomedical classification methods are rule-based (Tinoco et al., 2011; Matheny et al., 2012), which requires medical experts to develop logical rules to identify reports consistent with some diseases.
The main advantages of such rule-based systems is that high precision can be achieved, but the weak-ness lies in the fact that the process is not easily transferable to similar tasks, because medical ex-perts have to carefully develop specific types of rules and formulas for different kinds of diseases. In recent years, machine learning methods have been widely used in disease identification from biomedical text(Ehrentraut et al., 2012; Bejan et al., 2012; Martinez et al., 2015; Hassanpour and Langlotz, 2015), which also ask medical experts to do some annotation work for building training data. Unlabelled free biomedical text in hospitals and other clinical organizations is abundant but manual annotation is very expensive.
Exploiting fine-grained sentence level proper-ties for coarse-grained document level classifi-cation has attracted large amounts of attention. Pang(Pang and Lee, 2004) first explored subjec-tivity extraction methods based on a minimum cut formulation, in which they performed subjectiv-ity detection on individual sentences and imple-mented document level polarity classification by leveraging those extracted subjective sentences. McDonald(T¨ackstr¨om and McDonald, 2011) pro-posed a structured model for jointly classifying the sentiment of text at varying levels of granu-larity, they showed that this task can be reduced to sequential classification with constrained in-ference. Yessenalina(Yessenalina et al., 2010) described a joint two-level approach for docu-ment level sentidocu-ment classification that simulta-neously extracts useful sentences, and Fang(Fang and Huang, 2012) extended it by incorporating as-pect information to the structured model to asas-pect level sentiment analysis.
Exper-imental results show that the combined cascaded model is efficient in biomedical text classification tasks.
2 Methodology
In this section, we propose variants developed from a cascaded logistic regression model: the partially supervised model called as logistic re-gression with hard EM (LREM) and the weakly supervised model named as weak logistic regres-sion with hard EM (WLREM). LREM is trained with part of the fully-annotated data and all of the partially-annotated data. WLREM is trained with the same part of the fully-annotated data and all of the weakly annotated data.
2.1 Preliminaries
Let d be a document consisting of n sen-tences,X = (Xi)ni=1, with a
document-sentence-sequence pair denoted d = (d,X). Let yd de-note the document level polarity andZ= (Zi)ni=1
be the sequence of sentence level polarity. In what follows, we assume that there are three types of training sets: a small set of fully labeled in-stancesDF which are annotated at both sentence
and document levels, another small set of par-tially labeled instances DP which are annotated
only at the document level, and a large set of weakly annotated instancesDU (explained later).
Besides, we assume that all Zi take values in
{P OS(+1), N EG(−1), N EU(0)}whileydis in {P OS(+1), N EG(−1)}.
The following three cascaded models are based on logistic regression, with the following standard parametrization
Pθ
yd|X=X
Z
Pα(yd|Z)Pβ(Z|X) (1)
whereθ={α, β}, andαandβare the parameters of document and sentence level classifiers respec-tively.
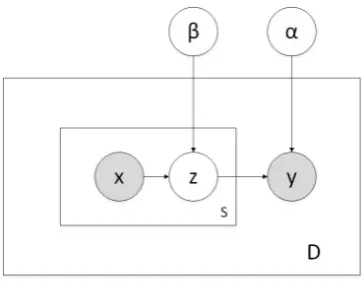
2.2 The partially supervised model
The partially supervised model (LREM) is trained from the sets of fully labeled data DF and
par-tially labelled data DP. Since the sentence
po-larity is unknown inDP, a hard EM algorithm is
used to iteratively estimate Z and maximize the cascaded goal function. Figure 1 outlines LREM. The parameters,αandβ, of this model can be
es-Figure 1: A partially supervised model.
timated by maximizing the joint conditional like-lihood function
α, β= arg max
α,β
XN
d=1
logPθ(yd|X)
(2)
whereN =|DF ∪DP|.
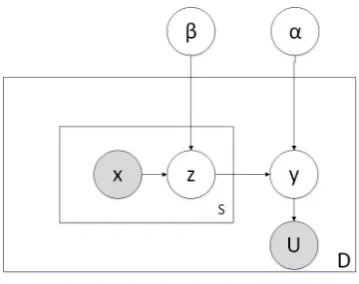
2.3 The weakly supervised model
The weakly supervised model (WLREM) is trained from the sets of fully labeled dataDF and
weakly labelled data DU. In our case, the
docu-ment polarity is unknown fromDU, while U
rep-resents the patient level diagnostic result in the treating hospital. Generally, if a patient is diag-nosed with positive infection in the hospital, the reports of this patient are more likely to be pos-itive. We get this estimated probability from a confusion matrix ofDF as shown in table 1. We
Table 1: Confusion matrix of fully-annotated dataset
DF y=POS y=NEG
U=POS 167 68
U=NEG 41 82
notice that P(U = P OS|y = P OS) = 0.803, which is a trustful prior information for guessing
y, thus we can extend the previous partially super-vised model into a weakly one. Figure 2 shows WLREM. The parameters,αandβ, of this model can be estimated by maximizing the joint condi-tional likelihood function
Pθ(Ud|X) =Py,ZPβ(Z|X)Pα(yd|Z)P(Ud|yd)
α, β = arg maxα,β
QM
d=1Pθ(Ud|X)
(3)
[image:2.595.325.507.60.202.2]Figure 2: A weakly supervised model.
3 Combining partial and weak supervision
The partially and weakly supervised models both have their merits. The former requires document level annotation, while the latter can be used di-rectly with available documents except for an ini-tial guess of the document level polarity. In or-der to achieve the best predictive performance, we propose to combine the merits of these two mod-els.
3.1 A combined cascaded latent variable model
Given in Algorithm 1, ComLREM is an integra-tion of the above two models (LREM+WLREM), which can make full use of the partially and weakly annotated data.
Algorithm 1ComLREM
α, β←update for dataDF via Eqn (2)
Zi ←0for all the sentences inDP ∪DU
y←1for all the documents inDU
whilethe convergence condition is meetdo forevery documentd∈DP do
nd←number of sentences ofd
fork= 1tondinddo
Zkd= arg maxZd kPθ y
d|X
.from Equation (1)
forevery documentd∈DUdo
nd←number of sentences ind
fork= 1tondinddo
Zkd, Yd= arg maxZd k,Yd
Pβ(Z|X)Pα(yd|Z)P(Ud|yd)
α, β←update for all data via Eqns (2), (3)
Table 2: Feature representation
Feature level Discription
Sentence-level Uni-gram tokens + MetaMap concepts
Report-level
Pos sentence exists or not Neg sentence exists or not No. of pos sentences No. of neg sentences No. of other sentences Polarity of the first sentence Polarity of the last sentence Percentage of pos sentences Percentage of neg sentences Pos sentence exists in the beginning Pos sentence exists in the end Neg sentence exists in the beginning Neg sentence exists in the end
3.2 Feature representation
Two main types of features are explored: Bag and Structural. Bag features are applied to the sentence-level classification, while structural fea-tures are built on the results of sentence-level clas-sification.
Dates, time and numbers are normalised into DATE, TIME, and NUM symbols. Reports are segmented into sentences using the JulieLab (Tomanek et al., 2007) automatic sentence seg-mentor. Stop words are terms and phrases which are regarded as not conveying any significant se-mantics to the sentences and reports, NLTK stop word list was chosen to do the filtering. The Ge-nia Tagger (Tsuruoka et al., 2005) is used to do to-kenization and lemmatization. The MetaMap con-cepts (Aronson, 2001) come from the mappings of biomedical knowledge representation. Table 1 il-lustrates the feature representation at the sentence and report levels.
4 Experiment
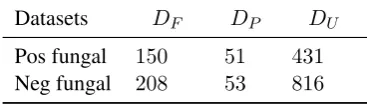
As shown in (Martinez et al., 2015), CT reports for fungal disease detection were collected from three hospitals. For each report, only the free text section were used, which contains the radiologist’s understanding of the scan and the reason for the requested scan as written by clinicians. Every re-port was de-identified: any potentially identifying information such as name, address, age/birthday, gender were removed. Table 2 shows the num-ber of distribution of reports over fully-annotated, partially-annotated and verified data sets.
[image:3.595.303.526.68.235.2]Table 3: Fully-annotated, partially-annotated and weakly annotated datasets
Datasets DF DP DU
Pos fungal 150 51 431
Neg fungal 208 53 816
PR curve is an estimated measure of the test ac-curacy.The results presented here are 5-fold cross validation outcomes on the fully-annotated data.
[image:4.595.75.294.349.502.2]Fig. 3 and 4 show the ROC curves and PR curves of the four models: LR is the baseline algo-rithm, LREM is trained based on part of the fully-annotated data and all of the partially-fully-annotated data, WLREM is trained based on part of the fully-annotated data and all of the unfully-annotated data, and ComLREM is an integration of the above two models.
Figure 3: ROC curve of LR, LREM, WLREM and ComLREM.
Figure 4: PR curve of LR, LREM, WLREM and ComLREM.
We can see from Fig. 3 that WLREM obtained higher ROC score than LR, the area under LREM and WLREM ROC curve is 0.774 and 0.861, which shows that the involvement of weakly anno-tated data contributes higher than that of partially annotated data to the improvement of classifica-tion performance. It is noticed WLREM achieved greater improvement than LREM, because theDU
contains big volume and trustful prior information. The highest ROC score (0.870) was achieved with a combination of the above two models, which is within our expectation. Fig. 4 shows the PR curves of the four models, there is a trade-off be-tween precision and recall with recall as the most important metric. When the threshold is set to ob-tain a high recall (> 0.9), ComLREM obtained higher precision than other models. Overall, with true positive rate or recall as the first priority, the combined model ComLREM achieved the best classification performance.
We also compared our model with Mar-tinez’s system (Martinez et al., 2015), in which they applied conservative rules over sentence-classification output. Their sentence-level classi-fier used SVMs with words and Bag-of-concepts features. Since the conservative rules in-dicate that a report is labeled as positive if any sentence in it is labeled positive, the report-level prediction is not probabilistic and the PR curve can not be drawn accordingly. In order to make some comparison, we adjusted the threshold of our report-level logistic regression classifier to make our recall the same as theirs (0.930), and see whether the precision improves. Table 3 shows the compared results, we noticed that both WL-REM and ComLWL-REM outperforms the Conserva-tive SVM approach, which indicates that the esti-mation we made from the unlabelled data is trust-ful and can be used to improve classification per-formance.
Table 4: Comparison of the experimental results
Models Recall Precision F score
Conservative SVM 0.930 0.694 0.795 LR 0.930 0.646 0.762 LREM 0.930 0.656 0.769 WLREM 0.930 0.703 0.801 ComLREM 0.930 0.707 0.802
5 Conclusion
[image:4.595.75.294.572.722.2]do-main. We therefore proposed a combined cas-caded latent variable model, which effectively combines both partial and weak supervision for biomedical text classification. Sentence label is regarded as a latent variable in this model, and both fine-grained and coarse-grained features are considered in the learning process. In the future, we consider to develop active learning methods to-wards our cascaded latent variable model and fur-ther reduce manual annotation cost.
References
Alan R Aronson. 2001. Effective mapping of biomed-ical text to the umls metathesaurus: the MetaMap program. InProceedings of the AMIA Symposium, page 17. American Medical Informatics Associa-tion.
Cosmin Adrian Bejan, Fei Xia, Lucy Vanderwende, Mark M Wurfel, and Meliha Yetisgen-Yildiz. 2012. Pneumonia identification using statistical feature se-lection. Journal of the American Medical Informat-ics Association, 19(5):817–823.
Claudia Ehrentraut, Hideyuki Tanushi, Hercules Dalia-nis, and J¨org Tiedemann. 2012. Detection of hospi-tal acquired infections in sparse and noisy Swedish patient records. A machine learning approach using Na¨ıve Bayes, Support Vector Machines and C, 4.
Lei Fang and Minlie Huang. 2012. Fine granular as-pect analysis using latent structural models. In Pro-ceedings of the 50th Annual Meeting of the Associ-ation for ComputAssoci-ational Linguistics: Short Papers-Volume 2, pages 333–337. Association for Compu-tational Linguistics.
Saeed Hassanpour and Curtis P Langlotz. 2015. Infor-mation extraction from multi-institutional radiology reports. Artificial intelligence in medicine.
David Martinez, Michelle R Ananda-Rajah, Hanna Suominen, Monica A Slavin, Karin A Thursky, and Lawrence Cavedon. 2015. Automatic detection of patients with invasive fungal disease from free-text computed tomography (CT) scans. Journal of biomedical informatics, 53:251–260.
Michael E Matheny, Fern FitzHenry, Theodore Sper-off, Jennifer K Green, Michelle L Griffith, Eduard E Vasilevskis, Elliot M Fielstein, Peter L Elkin, and Steven H Brown. 2012. Detection of infectious symptoms from va emergency department and pri-mary care clinical documentation. International journal of medical informatics, 81(3):143–156.
Bo Pang and Lillian Lee. 2004. A sentimental educa-tion: Sentiment analysis using subjectivity summa-rization based on minimum cuts. InProceedings of the 42nd annual meeting on Association for Compu-tational Linguistics, page 271. Association for Com-putational Linguistics.
Oscar T¨ackstr¨om and Ryan McDonald. 2011. Semi-supervised latent variable models for sentence-level sentiment analysis. InProceedings of the 49th An-nual Meeting of the Association for Computational Linguistics: Human Language Technologies: short papers-Volume 2, pages 569–574. Association for Computational Linguistics.
Aldo Tinoco, R Scott Evans, Catherine J Staes, James F Lloyd, Jeffrey M Rothschild, and Peter J Haug. 2011. Comparison of computerized surveillance and manual chart review for adverse events. Journal of the American Medical Informatics Association, 18(4):491–497.
Katrin Tomanek, Joachim Wermter, Udo Hahn, et al. 2007. A reappraisal of sentence and token split-ting for life sciences documents. InMedinfo 2007: Proceedings of the 12th World Congress on Health (Medical) Informatics; Building Sustainable Health Systems, page 524. IOS Press.
Yoshimasa Tsuruoka, Yuka Tateishi, Jin-Dong Kim, Tomoko Ohta, John McNaught, Sophia Ananiadou, and Junichi Tsujii. 2005. Developing a robust part-of-speech tagger for biomedical text. Advances in informatics, pages 382–392.