Unsupervised Feature Selection for Relation Extraction
Jinxiu Chen1 Donghong Ji1 Chew Lim Tan2 Zhengyu Niu1
1Institute for Infocomm Research 2Department of Computer Science
21 Heng Mui Keng Terrace National University of Singapore
119613 Singapore 117543 Singapore
{jinxiu,dhji,zniu}@i2r.a-star.edu.sg [email protected]
Abstract
This paper presents an unsupervised re-lation extraction algorithm, which in-duces relations between entity pairs by grouping them into a “natural” num-ber of clusters based on the similarity of their contexts. Stability-based crite-rion is used to automatically estimate the number of clusters. For removing noisy feature words in clustering proce-dure, feature selection is conducted by optimizing a trace based criterion sub-ject to some constraint in an unsuper-vised manner. After relation clustering procedure, we employ a discriminative category matching (DCM) to find typi-cal and discriminative words to repre-sent different relations. Experimental results show the effectiveness of our al-gorithm.
1 Introduction
Relation extraction is the task of finding rela-tionships between two entities from text contents. There has been considerable work on supervised learning of relation patterns, using corpora which have been annotated to indicate the information to be extracted (e.g. (Califf and Mooney, 1999; Ze-lenko et al., 2002)). A range of extraction mod-els have been used, including both symbolic rules and statistical rules such as HMMs or Kernels. These methods have been particularly success-ful in some specific domains. However, manu-ally tagging of large amounts of training data is
very time-consuming; furthermore, it is difficult for one extraction system to be ported across dif-ferent domains.
Due to the limitation of supervised methods, some weakly supervised (or semi-supervised) ap-proaches have been suggested (Brin, 1998; Eu-gene and Luis, 2000; Sudo et al., 2003). One common characteristic of these algorithms is that they need to pre-define some initial seeds for any particular relation, then bootstrap from the seeds to acquire the relation. However, it is not easy to select representative seeds for obtaining good results.
Hasegawa, et al. put forward an unsuper-vised approach for relation extraction from large text corpora (Hasegawa et al., 2004). First, they adopted a hierarchical clustering method to clus-ter the contexts of entity pairs. Second, afclus-ter con-text clustering, they selected the most frequent words in the contexts to represent the relation that holds between the entities. However, the ap-proach exists its limitation. Firstly, the similar-ity threshold for the clusters, like the appropriate number of clusters, is somewhat difficult to pre-defined. Secondly, the representative words se-lected by frequency tends to obscure the clusters.
unsupervised manner. Furthermore, after relation clustering, we employ a discriminative category matching (DCM) to find typical and discrimina-tive words to represent different relations types.
2 Proposed Method
Feature selection for relation extraction is the task of finding important contextual words which will help to discriminate relation types. Unlike su-pervised learning, where class labels can guide feature search, in unsupervised learning, it is ex-pected to define a criterion to assess the impor-tance of the feature subsets. Due to the interplay between feature selection and clustering solution, we should define an objective function to evaluate both feature subset and model order.
In this paper, the model selection capability is achieved by resampling based stability analysis, which has been successfully applied to several un-supervised learning problems (e.g. (Levine and Domany, 2001), (Lange et al., 2002), (Roth and Lange et al., 2003), (Niu et al., 2004)). We extend the cluster validation strategy further to address both feature selection and model order identifica-tion.
Table 1 presents our model selection algorithm. The objective function MFk,k is relevant with both feature subset and model order. Clustering solution that is stable against resampling will give rise to a local optimum ofMFk,k, which indicates both important feature subset and the true cluster number.
2.1 Entropy-based Feature Ranking
LetP = {p1, p2, ...pN}be a set of local context
vectors of co-occurrences of entity pair E1 and
E2. Here, the context includes the words occur-ring between, before and after the entity pair. Let
W = {w1, w2, ..., wM} represent all the words occurred in P. To select a subset of important features from W, words are first ranked accord-ing to their importance on clusteraccord-ing. The im-portance can be assessed by the entropy criterion. Entropy-based feature ranking is based on the as-sumption that a feature is irrelevant if the presence of it obscures the separability of data set(Dash et al., 2000).
We assume pn, 1 ≤ n ≤ N, lies in feature
space W, and the dimension of feature space is
Table 1: Model Selection Algorithm for Relation Extrac-tion
Input: CorpusDtagged with Entities(E1, E2); Output: Feature subset and Model Order (number of relation types);
1. Collect the contexts of all entity pairs in the document corpusD, namelyP;
2. Rank features using entropy-based method described in section 2.1;
3. Set the range (Kl, Kh) for the possible number of
relation clusters;
4. Set estimated model orderk=Kl;
5. Conduct feature selection using the algorithm pre-sented in section 2.2;
6. RecordFˆk,k and the score of the merit of both of
them, namelyMF,k;
7. Ifk < Kh,k=k+ 1, go to step 5; otherwise, go to
Step 7;
8. Selectkand feature subsetFˆkwhich maximizes the
score of the meritMF,k;
M. Then the similarity between i-th data point
pi and j-th data point pj is given by the
equa-tion: Si,j = exp(−α∗Di,j), where Di,j is the
Euclidean distance betweenpiandpj, andαis a
positive constant, its value is−ln 0D.5, whereDis the average distance among the data points. Then the entropy of data set P with N data points is defined as:
E=− N X
i=1
N X
j=1
(Si,jlogSi,j+ (1−Si,j) log(1−Si,j))
(1)
For ranking of features, the importance of each word I(wk) is defined as entropy of the data
af-ter discarding feature wk. It is calculated in this
way: remove each word in turn from the feature space and calculate E of the data in the new fea-ture space using the Equation 1. Based on the observation that a feature is the least important if the removal of it results in minimum E, we can obtain the rankings of the features.
2.2 Feature Subset Selection and Model Order Identification
In this paper, for each specified cluster number, firstly we perform K-means clustering analysis on each feature subset and adopts a scattering cri-terion ”Invariant Cricri-terion” to select an optimal feature subset F from the feature subset space. Here,trace(PW−1PB)is used to compare the
clus-ter quality for different feature subsets 1, which
1trace(P−1
W PB)istraceof a matrix which is the sum
Table 2: Unsupervised Algorithm for Evaluation of Fea-ture Subset and Model Order
Function: criterion(F, k, P, q)
Input: feature subsetF, cluster numberk, entity pairs setP, and sampling frequencyq;
Output: the score of the merit ofFandk;
1. With the cluster number k as input, perform k-means clustering analysis on pairs setPF
;
2. Construct connectivity matrixCF,kbased on above
clustering solution on full pairs setPF;
3. Use a random predictorρkto assign uniformly drawn
labels to each entity pair inPF
;
4. Construct connectivity matrixCF,ρkbased on above
clustering solution on full pairs setPF
;
5. Constructqsub sets of the full pairs set, by randomly selectingαNof theNoriginal pairs,0≤α≤1; 6. For each sub set, perform the clustering analysis in
Step2,3,4, and resultCF,kµ ,CF,ρµ k;
7. ComputeMF,kto evaluate the merit of k using
Equa-tion 3; 8. ReturnMF,k;
measures the ratio of between-cluster to within-cluster scatter. The higher thetrace(PW−1PB), the
higher the cluster quality.
To improve searching efficiency, features are first ranked according to their importance. As-sumeWr={f1, ..., fM}is the sorted feature list.
The task of searching can be seen in the feature subset space:{(f1, ..., fk),1≤k≤M}.
Then the selected feature subset F is eval-uated with the cluster number using the ob-jective function, which can be formulated as:
ˆ
Fk = arg maxF⊆Wr{criterion(F, k)}, subject tocoverage(P, F) ≥ τ 2. Here, Fˆ
k is the
opti-mal feature subset,Fandkare the feature subset and the value of cluster number under evaluation, and thecriterionis set up based on resampling-based stability, as Table 2 shows.
Let Pµ be a subset sampled from full entity pairs set P with size α|P| (α set as 0.9 in this paper.), C(Cµ) be |P| × |P|(|Pµ| × |Pµ|) con-nectivity matrix based on the clustering results on
P(Pµ). Each entrycij(cµij) ofC(Cµ) is calculated
in the following: if the entity pairpi ∈ P(Pµ), pj ∈ P(Pµ) belong to the same cluster, then cij(cµij) equals 1, else 0. Then the stability is
de-matrix as: PW = Pc
j=1
P
Xi∈χj(Xi−mj)(Xj−mj)
t
and PB is the between-cluster scatter matrix as: PB = Pc
j=1(mj−m)(mj−m)
t
, where m is the total mean vec-tor andmjis the mean vector forjthcluster and(Xj−mj)t
is the matrix transpose of the column vector(Xj−mj).
2
letcoverage(P, F)be the coverage rate of the feature setFwith respect toP. In practice, we setτ= 0.9.
fined in Equation 2:
M(Cµ, C) = P
i,j1{C µ
i,j=Ci,j= 1, pi∈Pµ, pj∈Pµ} P
i,j1{Ci,j= 1, pi∈Pµ, pj∈Pµ}
(2)
Intuitively,M(Cµ, C)denotes the consistency between the clustering results onCµandC. The assumption is that if the cluster numberkis actu-ally the “natural” number of relation types, then clustering results on subsets Pµ generated by sampling should be similar to the clustering re-sult on full entity pair setP. Obviously, the above function satisfies0≤M ≤1.
It is noticed that M(Cµ, C) tends to decrease when increasing the value of k. Therefore for avoiding the bias that small value of k is to be selected as cluster number, we use the cluster validity of a random predictor ρk to normalize M(Cµ, C). The random predictor ρ
k achieved
the stability value by assigning uniformly drawn labels to objects, that is, splitting the data into k clusters randomly. Furthermore, for each k, we tried q times. So, in the step 7 of the algorithm of Table 2, the objective functionM(CF,kµ , CF,k)
can be normalized as equations 3:
MF,knorm= 1
q
q X
i=1
M(Cµi
F,k, CF,k)− 1
q
q X
i=1
M(Cµi
F,ρk, CF,ρk)
(3)
Normalizing M(Cµ, C) by the stability of the random predictor can yield values independent of k.
After the number of optimal clusters and the feature subset has been chosen, we adopted the K-means algorithm for the clustering phase. The output of context clustering is a set of context clusters, each of them is supposed to denote one relation type.
2.3 Discriminative Feature identification
For labelling each relation type, we use DCM (discriminative category matching) scheme to identify discriminative label, which is also used in document classification (Gabriel et al., 2002) and weights the importance of a feature based on their distribution. In this scheme, a feature is not important if the feature appears in many clusters and is evenly distributed in these clusters, other-wise it will be assigned higher importance.
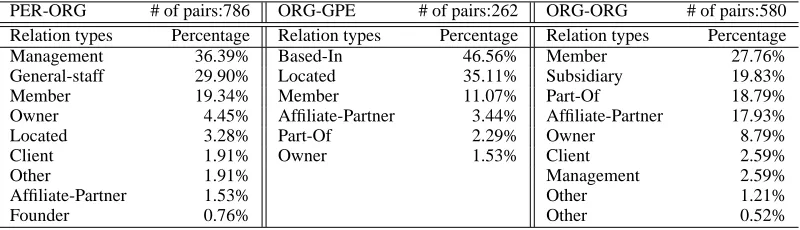
To weight a feature fi within a category, we
Table 3:Three domains of entity pairs: frequency distribution for different relation types PER-ORG # of pairs:786 ORG-GPE # of pairs:262 ORG-ORG # of pairs:580 Relation types Percentage Relation types Percentage Relation types Percentage
Management 36.39% Based-In 46.56% Member 27.76%
General-staff 29.90% Located 35.11% Subsidiary 19.83%
Member 19.34% Member 11.07% Part-Of 18.79%
Owner 4.45% Affiliate-Partner 3.44% Affiliate-Partner 17.93%
Located 3.28% Part-Of 2.29% Owner 8.79%
Client 1.91% Owner 1.53% Client 2.59%
Other 1.91% Management 2.59%
Affiliate-Partner 1.53% Other 1.21%
Founder 0.76% Other 0.52%
• The relative importance offi within a cluster is
de-fined as: W Ci,k = loglog2(pfi,k+1)
2(Nk+1) , wherepfi,kis the
number of those entity pairs which contain featurefi
in cluster k. Nk is the total number of term pairs in
cluster k.
• The relative importance offiacross clusters is given
by:CCi= log
N·maxk∈Ci{W Ci,k}
PN k=1W Ci,k
· 1
logN, whereCi
is the set of clusters which contain featurefi. N is the
total number of clusters.
Here,W Ci,k andCCi are designed to capture
both local information within a cluster and global information about the feature distribution across clusters respectively. Combining bothW Ci,kand CCi we define the weightWi,k offiin cluster k
as: Wi,k = W C2
i,k·CCi2 p
W C2
i,k+CCi2
·√2,0≤Wi,k ≤1.
3 Experiments and Results
3.1 Data
We constructed three subsets for domains PER-ORG, ORG-GPE and ORG-ORG respectively from ACE corpus3 The details of these subsets are given in Table 3, which are broken down by different relation types. To verify our proposed method, we only extracted those pairs of entity mentions which have been tagged relation types. And the relation type tags were used as ground truth classes to evaluate.
3.2 Evaluation method for clustering result
Since there was no relation type tags for each cluster in our clustering results, we adopted a permutation procedure to assign different rela-tion type tags to only min(|EC|,|T C|) clusters, where |EC|is the estimated number of clusters, and |T C| is the number of ground truth classes
3http://www.ldc.upenn.edu/Projects/ACE/
(relation types). This procedure aims to find an one-to-one mapping function Ωfrom the T C to
EC. To perform the mapping, we construct a contingency tableT, where each entry ti,j gives
the number of the instances that belong to both thei-th cluster andj-th ground truth class. Then the mapping procedure can be formulated as:Ω =ˆ
arg maxΩ P|T C|
j=1 tΩ(j),j, whereΩ(j)is the index
of the estimated cluster associated with thej-th class.
Given the result of one-to-one mapping, we can define the evaluation measure as follows:
Accuracy(P) =
P jtΩ(ˆ j),j P
i,jti,j
. Intuitively, it reflects
the accuracy of the clustering result.
3.3 Evaluation method for relation labelling
For evaluation of the relation labeling, we need to explore the relatedness between the identified labels and the pre-defined relation names. To do this, we use one information-content based mea-sure (Lin, 1997), which is provided in Wordnet-Similarity package (Pedersen et al., 2004) to eval-uate the similarity between two concepts in Word-net. Intuitively, the relatedness between two con-cepts in Wordnet is captured by the information content of their lowest common subsumer (lcs) and the information content of the two concepts themselves , which can be formalized as follows:
Relatednesslin(c1, c2) = 2×IC(lcs(c1,c2))
IC(c1)+IC(c2) . This
measure depends upon the corpus to estimate in-formation content. We carried out the experi-ments using the British National Corpus (BNC) as the source of information content.
3.4 Experiments and Results
dif-Table 4:Automatically determined the number of relation types using different feature ranking methods.
Domain Context
Window Size
# of real relation types
Model Or-der Base-line
Model Order with
χ2
Model Order with Freq
Model Or-der with Entropy
PER-ORG 0-5-0 9 7 7 7 7
2-5-2 9 8 6 7 8
0-10-0 9 8 6 8 8
2-10-2 9 6 7 6 8
5-10-5 9 5 5 6 7
ORG-GPE 0-5-0 6 3 3 3 4
2-5-2 6 2 3 4 4
0-10-0 6 6 4 5 6
2-10-2 6 4 3 4 5
5-10-5 6 2 3 3 3
ORG-ORG 0-5-0 9 7 7 7 7
2-5-2 9 7 5 6 7
0-10-0 9 9 8 9 9
2-10-2 9 6 6 6 7
5-10-5 9 8 5 7 9
ferent settings of context window size (WINpre
-WINmid-WINpost) for each domain.
Table 4 shows the results of model order iden-tification without feature selection (Baseline) and with feature selection based on different feature ranking criterion( χ2 , Frequency and Entropy). The results show that the model order identifica-tion algorithm with feature selecidentifica-tion based on en-tropy achieve best results: estimate cluster num-bers which are very close to the true values. In ad-dition, we can find that with the context setting, 0-10-0, the estimated number of the clusters is equal or close to the ground truth value. It demonstrates that the intervening words less than 10 are appro-priate features to reflect the structure behind the contexts, while the intervening words less than 5 are not enough to infer the structure. For the con-textual words beyond (before or after) the enti-ties, they tend to be noisy features for the relation estimation, as can be seen that the performance deteriorates when taking them into consideration, especially for the case without feature selection.
Table 5 gives a comparison of the aver-age accuracy over five different context win-dow size settings for different clustering settings. For each domain, we conducted five cluster-ing procedures: Hasegawa’s method,RLBaseline, RLF Sχ2, RLF SF req and RLF SEntropy. For
Hasegawa’s method (Hasegawa et al., 2004), we set the cluster number to be identical with the number of ground truth classes. ForRLBaseline,
we use the estimated cluster number to
clus-ter contexts without feature selection. For
RLF Sχ2,RLF SF req andRLF SEntropy, we use
the selected feature subset and the estimated clus-ter number to clusclus-ter the contexts, where the fea-ture subset comes fromχ2, frequency and entropy criterion respectively. Comparing the average ac-curacy of these clustering methods, we can find that the performance of feature selection methods is better than or comparable with the baseline sys-tem without feature selection. Furthermore, it is noted thatRLF SEntropy achieves the highest
av-erage accuracy in three domains, which indicates that entropy based feature pre-ranking provides useful heuristic information for the selection of important feature subset.
[image:5.595.106.495.83.269.2]Table 5:Performance of the clustering algorithms over three domains: the average accuracy over 5 different context window size.
Domain Hasegawa’s
method
RLBaseline RLFSχ2 RLFSF req RLFSEntropy
PER-ORG 32.4% 34.3% 33.9% 36.6% 41.3%
ORG-GPE 43.7% 47.4% 47.1% 48.4% 50.6%
ORG-ORG 26.5% 36.2% 36.0% 38.7% 42.4%
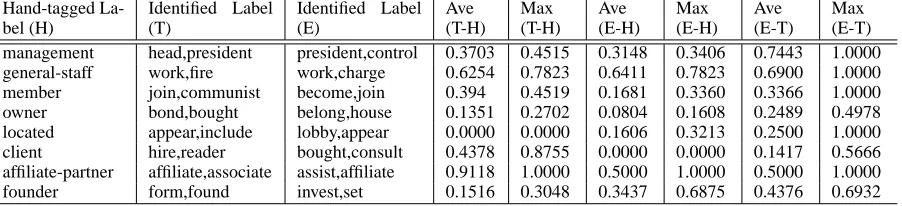
Table 6: Relation Labelling using DCM strategy for the domain PER-ORG. Here, (T) denotes the identified relation labels from ground truth classes. (E) is the identified relation labels from our estimated clusters. ‘Ave (T-H)’ denotes the average relatedness between (T) and (H). ‘Max (T-H)’ denotes the maximum relatedness between (T) and (H).
Hand-tagged La-bel (H)
Identified Label (T)
Identified Label (E)
Ave (T-H)
Max (T-H)
Ave (E-H)
Max (E-H)
Ave (E-T)
Max (E-T) management head,president president,control 0.3703 0.4515 0.3148 0.3406 0.7443 1.0000 general-staff work,fire work,charge 0.6254 0.7823 0.6411 0.7823 0.6900 1.0000
member join,communist become,join 0.394 0.4519 0.1681 0.3360 0.3366 1.0000
owner bond,bought belong,house 0.1351 0.2702 0.0804 0.1608 0.2489 0.4978
located appear,include lobby,appear 0.0000 0.0000 0.1606 0.3213 0.2500 1.0000
client hire,reader bought,consult 0.4378 0.8755 0.0000 0.0000 0.1417 0.5666
affiliate-partner affiliate,associate assist,affiliate 0.9118 1.0000 0.5000 1.0000 0.5000 1.0000
founder form,found invest,set 0.1516 0.3048 0.3437 0.6875 0.4376 0.6932
‘head’ or ‘control’; ‘member’ vs. ‘join’, ‘be-come’, etc., while the abstract words and the fea-tures are located far away in Wordnet. Table 6 also lists the relatedness between (E) and (T). We can see that the labels are comparable by their maximum relatedness(E-T).
4 Conclusion and Future work
In this paper, we presented an unsupervised ap-proach for relation extraction from corpus. The advantages of the proposed approach includes that it doesn’t need any manual labelling of the re-lation instances, it can identify an important fea-ture subset and the number of the context clusters automatically, and it can avoid extracting those common words as characterization of relations.
References
Mary Elaine Califf and Raymond J.Mooney. 1999. Rela-tional Learning of Pattern-Match Rules for Information Extraction, AAAI99.
Sergey Brin. 1998. Extracting patterns and relations from world wide web. In Proc. of WebDB’98. pages 172-183.
Kiyoshi Sudo, Satoshi Sekine and Ralph Grishman. 2003. An Improved Extraction Pattern Representation Model for Automatic IE Pattern Acquisition. Proceedings of ACL 2003; Sapporo, Japan.
Eugene Agichtein and Luis Gravano. 2000. Snowball: Ex-tracting Relations from large Plain-Text Collections, In
Proc. of the5thACM International Conference on Digi-tal Libraries (ACMDL’00).
Takaaki Hasegawa, Satoshi Sekine and Ralph Grishman. 2004. Discovering Relations among Named Entities from Large Corpora, ACL2004. Barcelona, Spain.
Dmitry Zelenko, Chinatsu Aone and Anthony Richardella. 2002. Kernel Methods for Relation Extraction, EMNLP2002. Philadelphia.
Lange,T., Braun,M.,Roth, V., and Buhmann,J.M.. 2002. Stability-Based Model Selection, Advances in Neural In-formation Processing Systems 15.
Levine,E. and Domany,E.. 2001. Resampling Method for Unsupervised Estimation of Cluster Calidity, Neural Computation, Vol.13, 2573-2593.
Zhengyu Niu, Donghong Ji and Chew Lim Tan. 2004. Doc-ument Clustering Based on Cluster Validation, CIKM’04. November 8-13, 2004, Washington, DC, USA.
Volker Roth and Tilman Lange. 2003. Feature Selection in Clustering Problems, NIPS2003 workshop.
Manoranjan Dash and Huan Liu. 2000. Feature Selection for Clustering, Proceedings of Pacific-Asia Conference on Knowledge Discovery and Data Mining.
Gabriel Pui Cheong Fung, Jeffrey Xu Yu and Hongjun Lu. 2002. Discriminative Category Matching: Effi-cient Text Classification for Huge Document Collections, ICDM2002. December 09-12, 2002, Japan.
D.Lin. 1997. Using syntactic dependency as a local context to resolve word sense ambiguity. In Proceedings of the 35th Annual Meeting of ACL,. Madrid, July 1997.
[image:6.595.79.530.200.303.2]