Probabilistic Prototype Model for Serendipitous Property Mining
Taesung Lee∗
IBM T. J. Watson Research Center [email protected]
Seung-won Hwang
Yonsei University
Zhongyuan Wang† Microsoft Research [email protected]
Abstract
Besides providing the relevant information, amusing users has been an important role of the web. Many web sites provide serendipitous (unexpected but relevant) information to draw user traffic. In this paper, we study the representative scenario of mining an amusing quiz. An existing approach leverages a knowledge base to mine an unexpected property then find quiz questions on such property, based on prototype theory in cognitive science. However, existingdeterministic modelis vulnerable to noise in the knowledge base. Therefore, we instead propose to leverage probabilistic approach to build a prototype that can overcome noise. Our extensive empirical study shows that our approach not only significantly outperforms baselines by 0.06 in accuracy, and 0.11 in serendipity but also shows higher relevance than the traditional relevance-pursuing baseline using TF-IDF.
1 Introduction
Unlike the traditional purpose of the web providing relevant information or answers to user questions, conversely, recent web services ask users unexpected trivia questions to amuse them. Bing provides a set of interesting quizzes with an image of the day on the front page. Figure 1 describes an amusing quiz question generation on a long ‘neck’ ofgiraffe, which we use as a motivating scenario throughout this paper.
Inspired by Figure 1, we study the problem of finding a “serendipitous” property a such as ‘neck’ for any given entitye. Table 1 categorizes existing automatic quiz generation efforts pursuing relevance and unexpectedness, respectively. Inspired by Jeopardy!, Seyler et al. (2015) focus on relevance to the domain and a certain difficulty level. Inspired by Bing questions, Lee et al. (2016) seek unexpected entity-property pair(e, a).
In clear contrast, we complement the solution space by pursuing the intersection of finding unexpected but still relevant properties, which is often named asserendipitous(or Case B). As the existing determin-isticmodel (DM, Lee et al. (2016)) fails to distinguish Case B and C, we propose a newprobabilistic
model (PM).
• DM: Unexpectedness of ‘neck’ can be found by building a deterministic prototype using the average of (normalized) property frequencies of all MAMMALS. As the frequency of ‘neck’ for agiraffe is far higher than the average, this can be found.
• PM: DM is effective when the underlying data (i.e., knowledge base) to derive probabilities are not noisy, but an automatically harvested knowledge base inevitably contains noise. For example, Probase, mining textual patterns such as “<property>of<category>,” may contain ‘some part’ as a property of agiraffe, which can be recognized as a desirable unexpected property by DM. We propose a probabilistic model that overcomes this problem.
∗This work was done at Yonsei University and Microsoft Research. †Zhongyuan Wang is now with Facebook Inc.
This work is licenced under a Creative Commons Attribution 4.0 International Licence. Licence details: http://creativecommons.org/licenses/by/4.0/
Our extensive evaluation results using real-life Flickr data and the Probase knowledge base validate that our approach not only significantly outperforms baselines by 0.06 in accuracy and 0.11 in serendipity, but also shows higher relevance than the traditional relevance-pursuing baseline using TF-IDF.
Figure 1:Bing quiz scenario used by DM (Lee et al., 2016).
Expected (Lee et al., 2016)Unexpected Relevant
(Seyler et al., 2015) Case A Case B
[image:2.595.285.524.124.195.2]Irrelevant - Case C
Table 1:Dimensions of a mining problem.
2 Related work
This paper studies the serendipitous property mining problem of finding relevant yet unexpected proper-ties for a given entity based on a knowledge base. Therefore, our work is closely related to knowledge acquisition. Also, mining unexpected part of knowledge can be considered as serendipitous mining or outlier detection.
2.1 Knowledge acquisition
Our serendipitous property mining system leverages automatically harvested knowledge on the web. Par-ticularly, measuring unexpectedness requires knowing the expectation, which requires worldly knowl-edge. The basis of such knowledge acquisition works is taxonomies that contain categories and their entities (Carlson et al., 2010; Suchanek et al., 2007; Wu et al., 2012). Among them, Probase (Wu et al., 2012) provides a conditional probability of an entity for a category, and also that of a property given an entity, from which we probabilistically model the expectation (i.e., prototype in our approach).
Besides the automatically harvested knowledge bases, other types of knowledge such as a traditional DB (Merzbacher, 2002) or a linked open data (Marie et al., 2013) are manually generated and often do not cover new entities, like new idols possibly attracting click-through. Therefore, we rely on an automatically harvested knowledge base.
2.2 Serendipitous mining
The primary metric for recommender system is prediction accuracy. However, focusing solely on this metric is reported to limit user satisfaction by always recommending predictable items, such as a new comedy for a comedy fan who can discover it without recommendation. To amuse users, serendipitous mining is studied in recommendation and search. Several approaches (Onuma et al., 2009; Nakatsuji et al., 2010) focus on finding serendipitous items such as funny zombie movie, which is both relevant and unexpected, from user-item matrices. Another direction is pursuing serendipity in search: The existing approaches propose to consider emotional expressions (Hauff and Houben, 2012; Bordino et al., 2013) or presentations such as bold font (O’Brien, 2011), to detect surprises and apply that in search results. These efforts cannot be applied to our problem as a user-item matrix or the text format is unavailable, but our knowledge-based signals are orthogonal and thus can be straightforwardly applied to improve both lines of the work.
2.3 Outlier detection
consider observations which have little or no neighbors as outliers (Jin et al., 2006). Most of these ap-proaches are designed, trained, or tuned for a target domain using labeled data or using user specified parameters, which is not suitable for our scenario targeting diverse categories. Moreover, these solutions categorize observations into two: normal observations and outliers. Lee et al. (2016), mining quiz ques-tions given images, also leverage the similar notion of classifying the properties into the two, which we use as a baseline and show their ineffectiveness in our experiments, due to their inability to distinguish noise and serendipitous properties.
3 Knowledge base
We leverage an automatically harvested knowledge base for human-like unexpected and relevant property mining. In particular, we leverage Probase‘is-a’knowledge and its property data to mine probabilities, which is essentially equivalent to deriving probabilities from a huge corpus. Probase is a large knowl-edge base containing millions of categories and their information includingentities,properties, and their
typicalitieswhich we describe below.
Is-A knowledge
The backbone of Probase is probabilistic knowledge of huge amount of‘is-a’relations between entities and categories (Wu et al., 2012)1. For example, Probase contains a relation: “giraffeis-aMAMMAL” wheregiraffeis an entity and MAMMALis a category. A category may contain many entities (e.g., MAMMAL contains giraffeand platypus), and an entity may also belong to several categories (e.g.,giraffebelongs to both MAMMAL and ANIMAL). Such relationships are mined from a huge amount of web documents using patterns (Wu et al., 2012).
Property knowledge
Properties are words representing a certain aspect of an entity. For example, ‘neck’ is a property of the entities in category MAMMAL. Properties of an entity are obtained by several approaches including pattern-based extraction methods (Lee et al., 2013).
Typicality
Based on the number of pattern occurrences, we can compute the conditional probability of a certain element given a condition, which we also calltypicality. For example, given category MAMMAL, peo-ple would usually think of typical mammals such asdog. In particular, Probase has diverse types of typicalities including theentity typicality for a category, andproperty typicality for an entity.
P(E|C) is a conditional probability of entityE given categoryC. For example, we can obtain the probabilityP(E = giraffe|C = mammal), representing how typical entitygiraffeis for category MAMMAL. Such probability can be obtained using all occurrences of MAMMAL, and the co-occurrences of MAMMALandgiraffe:
P(E = giraffe|C= mammal) = Freq(mammalFreq(mammal),giraffe) (1)
whereFreq(x, y)represents the co-occurrence ofxandy, andFreq(x)indicates the occurrence ofxin Probase. We can similarly compute other probabilities includingP(C),P(E),P(C|E). Also, we can obtainP(A|E)whereAis a property andE is an entity.
We can consider a typicality as the amount of people’s interest in the topic since it is derived from how frequently we discuss the topic. We usually have general topics of interest for entities in a certain category: ‘lifespan’, ‘diet’, ‘size’ and so on for mammals. But, if the heart of a giraffe is often discussed in comparison to other mammals, it can be an unexpected topic about a giraffe.
4 Methods
In this section, we describe our approach to model prototype and mine serendipitous properties. We follow the framework presented in (Lee et al., 2016) that leverages the category of a given entity, and propose a method for unexpected property mining. Therefore, we assume that we have the given topic entitye, and its categoryc.
4.1 Modeling a prototype
Identifying an unexpected property of an entity requires comparison to what we consider expected. If we expect most mammals have a heart with the size in a specific range, the extra large heart of agiraffe
can be unexpected. Therefore, defining the prototype of a category—which represents the human ex-pectation for entities in the category— is the key step to find serendipitous properties. We may consider selecting a typical entity among the existing entities in the category (such asdogfor MAMMAL). How-ever, typical properties such as ‘lifespan’ can be missing withdog due to data sparsity. In this case, ‘lifespan’ of any entity can be rather considered unexpected.
DM (Lee et al., 2016) models a deterministic prototype modelRDM
c as ahypotheticalentity using the average typicalities in the category. Note that, instead of the values of properties, their typicalities are leveraged to directly capture the human interest on the properties for entities and the category. That is, highP(height|giraffe)means that ‘height’ draws human interest so that it is discussed frequently with
giraffeon the web. If some property is frequently mentioned with most entities in a category, it can be considered the representative property of the category. Then, we can consider some property of an entity is unexpected if the property is particularly more frequently mentioned with the entity than with other entities in the category.
Thus, using the average of typicalities allows us to compute the representativeness of the property for the category (e.g., MAMMAL). Formally, RDMc is defined as an ordered set of the average of property typicalities in the categorycas follows:
RDM
c ={avge∈cP(a|e)P(e|c)|ais a property} (2)
whereP(a|e) is the property typicality given entity, andP(e|c)is the entity typicality given category (Section 3). This hypothetical prototype does not suffer from missing properties caused by data sparsity. However, this approach is vulnerable to noise of another cause: ‘some part’, wrongfully identified as a property, would be considered unexpected due to its infrequency.
Instead of this deterministic approach, we leverage a probabilistic method similar to (Eskin, 2000), which is originally designed for intrusion detection, to model the prototype. Unlike its category-agnostic approach using a Markov chain, we leverage the category information to model the prototype with beta distributions. In particular, we define a prototype of categorychypothetically as an ordered set of random variablesRc={Xa,c|ais a property}(an example distribution ofXa,cis shown as the blue dashed line in Figure 2(b)). That is, unlike DM using averages to produce an ordered set of expected typicalities, we build probability distributions.
Given this model, we can consider that the properties of an entity in the cate-gory are realizations of the random variables. To illustrate, suppose we have Rc =
{Xlifespan,mammal, Xtail,mammal, Xheart,mammal}, and typicalities of dog P(lifespan|dog), P(tail|dog), and P(heart|dog) are 0.3, 0.6, and 0.1 respectively. Then, we consider 0.3, 0.6 and 0.1 are realizations of Xlifespan,mammal, Xtail,mammal and Xheart,mammal with the corresponding
probabilitiesP(Xlifespan,mammal = 0.3), P(Xlifespan,mammal = 0.6), and P(Xlifespan,mammal = 0.1).
By measuring the likelihood of this event (having 0.3, 0.6, and 0.1) using these probabilities, we can measure how unexpected this entity or its properties are. Later in Section 4.2, we will argue how this model distinguishes Case B and C in Figure 2 and explain how we measure the unexpectedness.
Formally, we consider an entity of the category as an ordered set of properties represented as{P(a|e)}
0 0.03 0.06
0 0.02 0.04 0.06 0.08 0.1
O ccu rr en ces P(a|e) values Empirical probability Estimated beta distribution
0 0.03 0.06
0 0.02 0.04 0.06 0.08 0.1
O ccu rr en ces P(a|e) values 0 0.03 0.06
0 0.02 0.04 0.06 0.08 0.1
O ccu rr en ces P(a|e) values R ele van t Ir re le van t Expected Unexpected
(a) Case A expecting high𝑃𝑃(𝑎𝑎|𝑒𝑒). (b) Case B expecting low𝑃𝑃(𝑎𝑎|𝑒𝑒).
(c) Case C with unpredictable 𝑃𝑃(𝑎𝑎|𝑒𝑒).
Mean
𝑥𝑥∗ Expected value range Mean
𝑥𝑥∗ Expected value range
Mean
[image:5.595.74.525.64.350.2]𝑥𝑥∗ Expected value range
Figure 2:Distribution ofXa,c.
the typicalityP(a|e)for eachaconstitutes parameter probabilitiesp1, . . . , pkof the multinomial distri-bution Mult(n|p1, . . . , pk). We exploit a Dirichlet distribution of a single dimension, which is a beta
distribution, to modelP(a|e)since a Dirichlet distribution is a conjugate prior of a multinomial distribu-tion. That is, each random variableXa,cin prototypeRcis modeled as a beta distribution corresponding to a property of entities in categoryc:Xa,c∼Beta(x;αa,c, βa,c).
Now we have to learn the parameters specifying the beta distributionsBeta(x;αa,c, βa,c)of the pro-totypeRc. In particular, we use a setOa,cof property typicalityP(a|e)for each entityein the identified categorycas samples together with its occurrence probabilityP(e|c), that we obtain from Probase. That is, we give a larger weight to a more typical entity in the model. LetXa,c be a random variable mod-eled by a beta distributionBeta(x;αa,c, βa,c). We find parametersαa,c andβa,cso thatXa,c generates the observationOa,c = {xea,c = P(a|e)|e ∈ c}with their associated occurrences P(e|c). Then, we have P(x1 ≤ Xa,c < x2) = Pes.t. x1≤P(a|e)<x2P(e|c). Thus, the mean µ of the beta distribution
Beta(x;αa,c, βa,c)isPe∈cP(a|e)P(e|c), and the varianceσ2isPe∈c(P(a|e)−µ)2P(e|c). The pa-rametersαa,candβa,ccan be fitted by the widely adopted method of moments using the mean and the variance, of exploiting the first and second moments ofBeta(x;αa,c, βa,c).
4.2 Mining unexpected properties
With the obtained probabilistic prototype Rc = {Xa,c|ais a property} for category c, we discover serendipitous properties of the given entity, and show why noisy properties are not mined. We can consider that entities in the category are created by drawing each property typicalityP(a|e) from the beta distribution of the prototype. If a property typicality of the given entity is unlikely based on the prototype, we can consider the property is serendipitous.
Case A: Property is relevant and expected
First, Figure 2(a) depicts a distribution skewed to high values. For example, ‘lifespan’ is a common prop-erty for the most of entities in MAMMAL. Therefore, highP(lifespan|giraffe)does not meangiraffe has an unexpected property.
Case B: Property is unexpected, but relevant (serendipitous)
In contrast, Figure 2(b) shows a distribution skewed to lowP(a|e). In this case, we expect a relatively low value, and thus highP(a|e)of the topic entity implies a serendipitous event. For example, although the most entities in MAMMALhave a property ‘neck,’ it is not frequently mentioned, and hence we expect to have lowP(neck|e)value. Therefore, the distribution ofXneck,mammalis skewed to low values. Then,
the high value ofP(neck|giraffe)indicates thatgiraffehas an serendipitous property ‘neck.’ Case C: Property is noisy
Unlike Case A and B modeling relevant properties, the prototype may include a random variable rep-resenting a noisy property. Specifically, when a noisy property is modeled, it looks like Figure 2(c). A noisy property does not show a general tendency, and it is rather randomly distributed as often modeled by a uniform distribution. That is, since a noisy property is modeled like a uniform-esque distribution as shown in Figure 2(c), the most value ofP(a|e)is expected to happen, and would not be considered serendipitous.
Computing unexpected relevance
Based on these observations, we compute our measure of serendipitous properties. Formally, as exploited in (Eskin, 2000), we compute the log-likelihood of an entity-property probabilityP(Xa,c =xea,c)of the given topic entity using the obtained distribution forXa,c ofRc. In addition, we use a minus sign to obtain a measure indicating a more serendipitous property with a greater value.
I(xea,c) = −log(P(Xa,c=xea,c))
= −logBeta(x;αa,c, βa,c) (3)
Upon this value, we also consider that a serendipitous property of a well-known or more typical entity can more easily draw user attention. Thus, we quantify the degree of being serendipitous for propertya of entityethat belongs to categorycas follows.
H(c, e, a) =I(xa,ce )P(e|c) (4)
We measure this value for each property of the given topic entity, and consider one with the highest score the most interesting, so that we present it to users.
5 Evaluation
In this section, we evaluate our systems using various measures evaluating several facets of the proposed work. Throughout the evaluation, we compare our method PM with DM (Lee et al., 2016) in the same setting of using Flickr and Yahoo! Answers.
5.1 Serendipitous property discovery
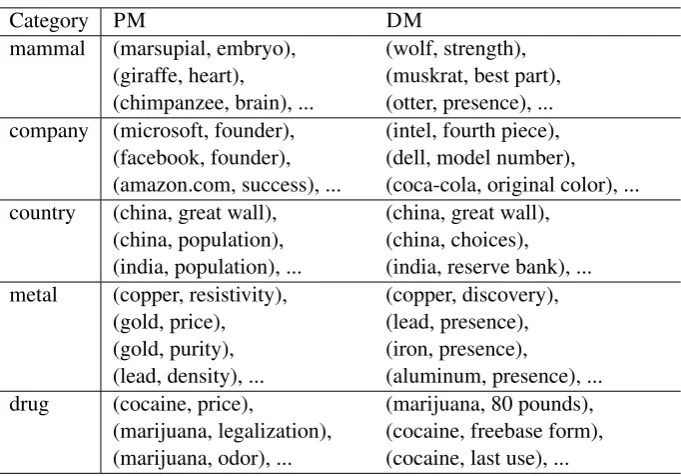
Table 2:Mined unexpected entity-property pairs for diverse categories.
Category PM DM
mammal (marsupial, embryo), (giraffe, heart),
(chimpanzee, brain), ...
(wolf, strength), (muskrat, best part), (otter, presence), ... company (microsoft, founder),
(facebook, founder), (amazon.com, success), ...
(intel, fourth piece), (dell, model number), (coca-cola, original color), ... country (china, great wall),
(china, population), (india, population), ...
(china, great wall), (china, choices), (india, reserve bank), ... metal (copper, resistivity),
(gold, price), (gold, purity), (lead, density), ...
(copper, discovery), (lead, presence), (iron, presence),
(aluminum, presence), ... drug (cocaine, price),
(marijuana, legalization), (marijuana, odor), ...
(marijuana, 80 pounds), (cocaine, freebase form), (cocaine, last use), ...
Table 3:Unexpectedness of discovered properties
Method SS@5
PM 0.31
DM 0.25
example, unlike other mammals, a marsupial has a pouch on her stomach to carry her babies. China is known to have the largest population in the world.
We also quantitatively evaluate the accuracy, or how well the discovered serendipitous properties are aligned with human judges. The serendipitous property (Case B in Table 1) should be relevant to the given entity and category pair, but peculiar in the category. In addition, the property is the most useful in our scenario drawing users if the property leads to a novel information (less known). We build a labeled dataset by annotating the mined property with the serendipitous score on a scale of 0, 1/3, 2/3 and 3/3. In particular, 3/3 point is given if the property is relevant, peculiar, and novel; 2/3 point is given if the property is relevant, and peculiar; 1/3 point is given if the property is relevant; and 0 point is given if the property is irrelevant. For example, the population of China is extraordinarily large which is serendipitous, but this property is well known so that we give 2/3. We have built a gold standard of size 386 independently labeled by three assessors from which we observe sufficient agreement (0.64 pairwise cosine similarity), and thus use the average of the scores assigned by the assessors. We leverageSS@5, the average serendipitous scores of the top-5 properties for each entity.
Table 3 shows the evaluation result of serendipitous property discovery methods. We see that ours show the highest score. While our approach might find a typical property for a typical entity (e.g., ‘size’ for dog), the discovered properties are mostly relevant, and often peculiar. On the other hand, DM frequently present irrelevant ones such as noisy properties (e.g., 2 cups, olddddddd guns), and thus show the lower scores.
5.2 Trivia question mining evaluation
5.2.1 Relevance and serendipity
We measure both relevance, andserendipity(i.e., pleasant surprise) using the evaluation procedure intro-duced by (Ge et al., 2010). to evaluate a recommender system or a serendipitous web search method. It shares the same spirit as our goal that we amuse users with serendipitous properties.
Both for relevance and serendipity, we label question relevance into relevant(1) and irrelevant(0). We randomly show a query image and one of the topN result questions from any methods so that an assessor is not biased to a certain method. Note that no other information is shown to the assessor.
Then, we first measure the average relevance of the results for all images in J for each method. Formally, we compute the relevance as follows.
Average relevance@N =
P
jPNk relj,k
N|J| (5)
whererelj,kis the relevance (1 or 0) of the rankkquestion forj∈J.
Measurements of serendipity have been established in the context of evaluating recommendation sys-tems (Ge et al., 2010; Shani and Gunawardana, 2011). Specifically, (Ge et al., 2010) evaluates serendipity as the ratio of unexpected but relevant results based on abenchmark modelthat generates expected rec-ommendations, which are relevance-pursuing results. That is, from the result questions of each method, we remove the expected ones that are retrieved by the benchmark model. Then the remainder is con-sidered unexpected. By checking the relevance of the remainder, we measure the relevance of the unex-pected results.
As a benchmark model, we might consider Yahoo! Answers search results or TF-IDF-based results using the host page keywords. Unfortunately, Yahoo! Answers returns very few or no results when there are more than two keywords, which is often much less than the number of keywords an image has (e.g., “giraffe zoo savanna” gives no result on Yahoo! Answers). To make the matters worse, obtaining top 100 results for subsets of keywords on Yahoo! Answers and joining the results also gives few or no intersection. Therefore, we use TF-IDFto obtain the benchmark results.
Formally, suppose thatBM@Nis the topN questions retrieved by the benchmark model, andRS@N is the topN questions retrieved by a method we want to test. Then, we calculate the unexpected recom-mendation set as follows.
UNEXP@N =RS@N−BM@N (6)
These unexpected recommendations may or may not be relevant to the query, but we want unexpected but still relevant ones. Therefore, we measure the serendipity based on the relevance of each item in UNEXP. Based on relevance labelsrelj,kofk-th result for imagej, serendipity is defined as follows.
SRDP(RS)@N =
P
(j,k)∈UNEXP@Nrelj,k
[image:8.595.178.422.617.675.2]N (7)
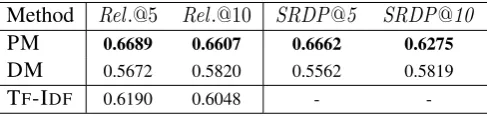
Table 4:Average question relevance and serendipity atN.
Method Rel.@5 Rel.@10 SRDP@5 SRDP@10
PM 0.6689 0.6607 0.6662 0.6275
DM 0.5672 0.5820 0.5562 0.5819
TF-IDF 0.6190 0.6048 -
-Table 4 shows the average relevance and the serendipity of each method. As a reference, we also include TF-IDF, which does not consider unexpectedness, to show the results of a typical relevance-pursuing model. Note that TF-IDFis the benchmark model and hence it does not provide unexpected questions for serendipity.
Table 5:Average Kendall coefficient for the questions.
Methods Q1. Q2. Q3. Q4.
PM 0.4960 0.3980 0.2486 0.3538 DM -0.0558 -0.0764 -0.2567 -0.2026
than PM because it gives lower score to those close to the average, but it may instead acquire and lever-age noisy properties as unexpected. For example, DM may consider ‘fourth piece’ ofIntel, which is extracted due to ambiguity and hence rare in the category, as unexpected. Therefore, it leverages such a property and in turn mines irrelevant trivia quizzes. We can also see that our approach shows higher serendipity than the baseline regardless ofN. As in relevance, the baseline shows low serendipity be-cause they highlight noisy properties as we have already seen in Section 5.1. Note that we can see PM show comparable or better relevances with TF-IDFas our approach pursuing serendipitous properties distinguishes noises.
5.2.2 Kendall’s tau-b rank correlation coefficient
We evaluate the results considering their ranks using Kendall’s tau-b rank correlation coeffi-cient(Kendall, 1938). Kendall’s coefficient ranges from -1 (perfect ranking disagreement) to +1 (perfect ranking agreement).
We build a reference ranking according to the several evaluation dimensions since “pleasant” in serendipity (pleasant surprise) can be interpreted in different ways. Therefore, we use several criteria such as ‘more relevant questions rank higher’ based on (Bordino et al., 2013) and evaluate individual dimensions. Specifically, we generate a task with a photograph and two randomly chosen result trivia quizzes out of those returned by all tested methods. A result trivia quiz that is more suitable for each of the following criteria is labeled as ‘better.’
• Q1. The trivia quiz is relevant to the image. (i.e., ‘pleasant’ means ‘relevant’)
• Q2. If someone is interested in the image, they would also be interested in the trivia quiz. (i.e., ‘pleasant’ means ‘interesting given interest to the image’)
• Q3. Even if you are not interested in the image, the trivia quiz is interesting to you personally. (i.e., ‘pleasant’ means ‘interesting regardlessly to the image’)
• Q4. You learn something new about the image from the trivia quiz. (i.e., ‘pleasant’ means ‘novel’)
Note that Q2 and Q3 try to evaluate both the image or topic-centric view of interestingness (Q2), and the intrinsic interestingness of the trivia quiz (Q3) as in (Bordino et al., 2013). For example, if a method shows high performance on Q3 but not on Q2, its trivia quiz tends to deviate much from the image/topic. However, the method is anyway presenting interesting trivia quiz.
A human assessor has to label each of criteria for a given task. As used in (Bordino et al., 2013), the reference ranking for each criterion is built by a simple voting-based approach, by ranking items with the greater number of ‘better’ votes higher. Since this evaluation may heavily depend on human assessors, we validate the gold standard by measuring the agreement. Thirty tasks are randomly sampled and evaluated by four human assessors. We measure Fleiss’ kappa (Fleiss, 1971) to obtainκ = 0.57, which shows moderate agreement (Landis and Koch, 1977). In addition, considering only confident answers by removing those tasks with any ‘not sure’ vote, we obtain higher agreementκ= 0.71, which shows substantial agreement.
6 Conclusions and future work
This paper studies the serendipitous property mining problem of finding relevant yet unexpected prop-erties for a given entity. Although the serendipitous information mining is important for industry to increase website traffic, it has not been studied actively on general knowledge due to lack of knowledge or having noisy knowledge. Such noisy knowledge is challenging as noisy properties can be evaluated as unexpected. We empirically show that probabilistic modeling of a prototype for each category alleviates the noise problem, while the existing approach is prone to pick up the noisy properties that may signifi-cantly detract the user experience of the applications like trivia questions. Our evaluation results suggest that our approach shows not only higher serendipity than the baselines, but also higher relevance than a traditional baseline using TF-IDFoptimized for relevance.
We expect many research topics can be stemmed from our work. One possibility of modeling a prototype would be neural embedding. Comparing its performance with our probabilistic model will be a good research direction. Meanwhile, our approach is limited to properties, and the proposed framework evaluates one property of an entity at each time. But taking relations into account, or considering more than one properties/relations may give even more interesting questions and facts. Also, we expect a similar approach can be exploited to mine outstanding issues from social network data which have a considerable amount of noise.
7 Acknowledgments
This work was supported by the Yonsei University New Faculty Research Seed Funding Grant of 2015, the Yonsei University Research Fund (Post Doc. Researcher Supporting Program) of 2015 (project no.: 2015-12-0211), and Institute for Information & communications Technology Promotion(IITP) grant funded by the Korea government(MSIP) (No.B0101-16-0307, Basic Software Research in Human-level Lifelong Machine Learning (Machine Learning Center)).
References
Andreas Arning, Rakesh Agrawal, and Prabhakar Raghavan. 1996. A linear method for deviation detection in large databases. InProc. 2ndInternational Conference on Computational Linguistics (KDD 1996), pages 164–
169. ACM.
Ilaria Bordino, Yelena Mejova, and Mounia Lalmas. 2013. Penguins in sweaters, or serendipitous entity search on user-generated content. InProc. 20thACM International Conference on Information and Knowledge Manage-ment (CIKM 2013). ACM.
Andrew Carlson, Justin Betteridge, Bryan Kisiel, Burr Settles, Estevam R. Hruschka Jr., and Tom M. Mitchell. 2010. Toward an architecture for never-ending language learning. InProc. 24thConference on Artificial Intel-ligence (AAAI 2010). AAAI Press.
Eleazar Eskin. 2000. Anomaly detection over noisy data using learned probability distributions. InProc. 17th International Conference on Machine Learning (ICML 2000), pages 255–262. Morgan Kaufmann.
Hongqin Fan, Osmar R Za¨ıane, Andrew Foss, and Junfeng Wu. 2006. A nonparametric outlier detection for effectively discovering top-n outliers from engineering data. In Proc. Pacific-Asia conference on knowledge discovery and data mining (PAKDD 2006), pages 557–566. Springer.
Joseph L Fleiss. 1971. Measuring nominal scale agreement among many raters.Psychological bulletin, 76(5):378. Mouzhi Ge, Carla Delgado-Battenfeld, and Dietmar Jannach. 2010. Beyond accuracy: Evaluating recommender systems by coverage and serendipity. InProc. 4thConference on Recommender Systems (RECSYS 2010), pages
257–260. ACM.
Claudia Hauff and Geert-Jan Houben. 2012. Serendipitous browsing: Stumbling through wikipedia. InProc. 34th European Conference on IR Research (ECIR 2012).
M. G. Kendall. 1938. A new measure of rank correlation. Biometrika, 30(1-2):81–93.
Edwin M. Knorr and Raymond T. Ng. 1997. A unified approach for mining outliers. InProc. 2rdInternational Conference on Computational Linguistics (KDD 1997), pages 219–222. ACM.
J Richard Landis and Gary G Koch. 1977. The measurement of observer agreement for categorical data. Biomet-rics, pages 159–174.
Taesung Lee, Zhongyuan Wang, Haixun Wang, and Seung-won Hwang. 2013. Attribute extraction and scoring: A probabilistic approach. In Proc. 29th International Conference on Data Engineering (ICDE 2013), pages
194–205. IEEE.
Taesung Lee, Seung-won Hwang, and Zhongyuan Wang. 2016. Trivia quiz mining using probabilistic knowl-edge. InProc. 2016 IEEE/ACM International Conference on Advances in Social Networks Analysis and Mining (ASONAM 2016).
Nicolas Marie, Fabien Gandon, Myriam Ribi`ere, and Florentin Rodio. 2013. Discovery hub: On-the-fly linked data exploratory search. InProc. 9th International Conference on Semantic Systems (I-SEMANTICS 2013), pages 17–24.
Matthew Merzbacher. 2002. Automatic generation of trivia questions. InProc. 13th International Symposium on Foundations of Intelligent Systems (ISMIS 2002), pages 123–130.
Makoto Nakatsuji, Yasuhiro Fujiwara, Akimichi Tanaka, Toshio Uchiyama, Ko Fujimura, and Toru Ishida. 2010. Classical music for rock fans?: Novel recommendations for expanding user interests. InProc. 19thACM Inter-national Conference on Information and Knowledge Management (CIKM 2010), pages 949–958. ACM. Heather L. O’Brien. 2011. Exploring user engagement in online news interactions. InProc. Annual Meeting on
Association for Information Science and Technology (ASIST 2011), pages 1–10. Wiley Subscription Services, Inc., A Wiley Company.
Kensuke Onuma, Hanghang Tong, and Christos Faloutsos. 2009. Tangent: A novel, ’surprise me’, recommen-dation algorithm. InProc. 15th International Conference on Computational Linguistics (KDD 2009), pages
657–666. ACM.
Sridhar Ramaswamy, Rajeev Rastogi, and Kyuseok Shim. 2000. Efficient algorithms for mining outliers from large data sets. InProc. SIGMOD International Conference on Management of Data (SIGMOD 2000), pages 427–438. ACM.
D Seyler, M Yahya, and K Berberich. 2015. Generating quiz questions from knowledge base. InProc. 24st International World Wide Web Conference (WWW 2015). ACM.
Guy Shani and Asela Gunawardana. 2011. Evaluating recommendation systems. In Recommender Systems Handbook, pages 257–297. Springer US.
Fabian M. Suchanek, Gjergji Kasneci, and Gerhard Weikum. 2007. Yago: A Core of Semantic Knowledge. In
Proc. 16thInternational World Wide Web Conference (WWW 2007). ACM.