ChAT: A Time-Linked System for Conversational Analysis
Michelle L. Gregory
Douglas Love
Stuart Rose
Anne Schur
Pacific Northwest National Laboratory 609 Battelle Blvd
Richland, WA 99354
{michelle.gregory;douglas.love;stuart.rose;anne.schur}@pnl.gov
Abstract
We present a system for analyzing conver-sational data. The system includes state-of-the-art natural language processing compo-nents that have been modified to accom-modate the unique nature of conversational data. In addition, we leverage the added richness of conversational data by analyz-ing various aspects of the participants and their relationships to each other. Our tool provides users with the ability to easily identify topics or persons of interest, in-cluding who talked to whom, when, entities that were discussed, etc. Using this tool, one can also isolate more complex net-works of information: individuals who may have discussed the same topics but never talked to each other. The tool includes a UI that plots information over time, and a se-mantic graph that highlights relationships of interest.
1
Introduction
The ability to extract and summarize content from data is a fundamental goal of computational lin-guistics. As such, a number of tools exist to auto-matically categorize, cluster, and extract information from documents. However, these tools do not transfer well to data sources that are more conversational in nature, such as multi-party meet-ings, telephone conversations, email, chat rooms, etc. Given the plethora of these data sources, there is a need to be able to quickly and accurately ex-tract and process pertinent information from these sources without having to cull them manually.
Much of the work on computational analysis of dialogue has focused on automatic topic segmenta-tion of conversasegmenta-tional data, and in particular, using features of the discourse to aid in segmentation (Galley et al, 2003; Stolcke et al., 1999; Hirschberg & Hakatani, 1996.). Detailed discourse and conversational analytics have been the focus of much linguistic research and have been used by the computational community for creating models of dialogue to aid in natural language understanding and generation (Allen & Core, 1997; Carletta et al., 1997; van Deemter et al., 2005; Walker et al., 1996). However, there has been much less focus on computational tools that can aid in either the analy-sis of conversations themselves, or in rendering conversational data in ways such that it can be used with traditional data mining techniques that have been successful for document understanding.
This current work is most similar to the NITE XML Toolkit (Carletta & Kilgour, 2005) which was designed for annotating conversational data. NITE XML is system in which transcripts of con-versations are viewable and time aligned with their audio transcripts. It is especially useful for adding annotations to multi-modal data formats. NITE XML is not analysis tool, however. Annotations are generally manually added. In this paper, we present a Conversational Analysis Tool (ChAT) which integrates several language processing tools (topic segmentation, affect scoring, named entity extraction) that can be used to automatically anno-tate conversational data. The processing compo-nents have been specially adapted to deal with conversational data.
ChAT is not an annotation tool, however, it is analysis tool. It includes a UI that combines a vari-ety of data sources onto one screen that enables users to progressively explore conversational data. For example, one can explore who was present in a
given conversation, what they talked about, and the emotional content of the data. The data can be viewed by time slice or in a semantic graph. The language processing components in ChAT are ver-satile in that they were developed in modular, open designs so that they can be used independently or be integrated into other analytics tools. We present ChAT architecture and processing components in Section 2. In section 3 we present the UI , with a discussion following in section 4.
2
ChAT Architecture
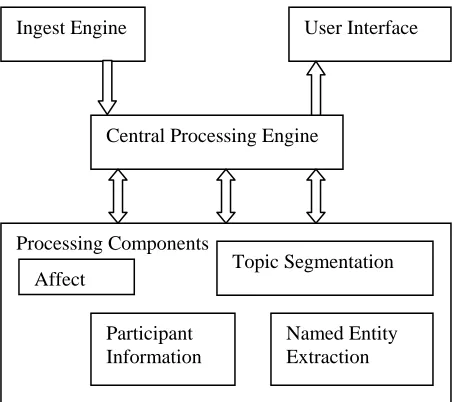
[image:2.612.72.299.309.510.2]ChAT is a text processing tool designed to aid in the analysis of any kind of threaded dialogue, in-cluding meeting transcripts, telephone transcripts, usenet groups, chat room, email or blogs. Figure 1 illustrates the data processing flow in ChAT.
Figure 1: ChAT Architecture.
Data is ingested via an ingest engine, then the central processing engine normalizes the format (time stamp, speaker ID, utterance; one utterance per line). Processing components are called by the central processing engine which provides the input to each component, and collects the output to send to the UI.
We designed the system to be general enough to handle multiple data types. Thus, with the excep-tion of the ingest engine, the processing compo-nents are domain and source independent. For example, we did not want the topic segmentation to rely on features specific to a dataset, such as
acoustic information from transcripts. Addition-ally, all processing components have been built as independent plug-ins to the processing engine: The input of one does not rely on the output of the oth-ers. This allows for a great deal of flexibility in that a user can choose to include or exclude vari-ous processes to suit their needs, or even exchange the components with new tools. We describe each of the processing components in the next section.
2.1
Ingest Engine
The ingest engine is designed to input multiple data sources and transform them into a uniform structure which includes one utterance per line, including time stamp and participant information. So far, we have ingested three data sources. The ICSI meeting corpus (Janin et al., 2003) is a corpus of text transcripts of research meetings. There are 75 meetings in the corpus, lasting 30 minutes to 1.5 hours in duration, with 5-8 participants in each meeting. A subset of these meetings were hand coded for topic segments (Galley, et al., 2003). We also used telephone transcripts from the August 14, 2003 power grid failure that resulted in a regional blackout1. These data consist of files containing transcripts of multiple telephone conversations be-tween multiple parties. Lastly, we employed a chat room dataset that was built in-house by summer interns who were instructed to play a murder mys-tery game over chat. Participants took on a charac-ter persona as their login and content was based on a predefined scenario, but all interactions were un-scripted beyond that.
1
http://energycommerce.house.gov/108/Hearings/09032003hearing1061/hearing .htm
Ingest Engine User Interface
Central Processing Engine
Processing Components
Topic Segmentation
Participant Information
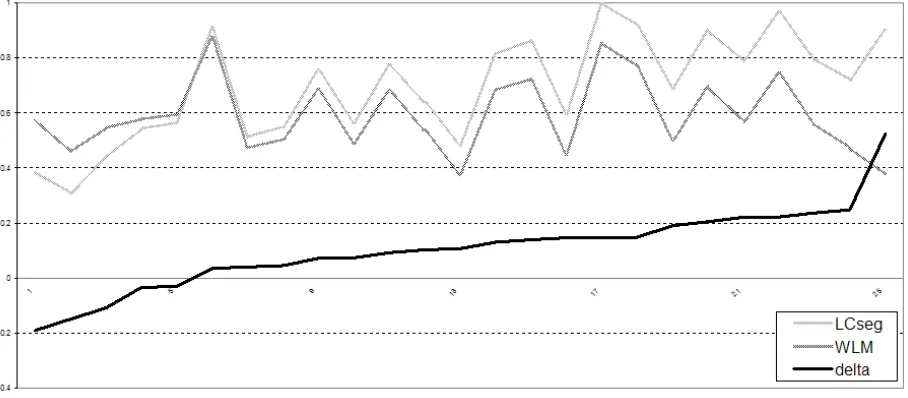
Figure 2. Plot of WindowDiff evaluation metric for LCseg and WLM on meeting corpus. p-value = 0.032121 for two-sample equal variance t-test.
2.2
Topic Segmentation
The output of the ingest process is a list of utter-ance that include a time (or sequence) stamp, a participant name, and an utterance. Topic segmen-tation is then performed on the utterances to chunk them into topically cohesive units. Traditionally, algorithms for segmentation have relied on textual cues (Hearst, 1997; Miller et al. 1998; Beeferman et al, 1999; Choi, 2000). These techniques have proved useful in segmenting single authored documents that are rich in content and where there is a great deal of topic continuity. Topic segmenta-tion of conversasegmenta-tional data is much more difficult due to often sparse content, intertwined topics, and lack of topic continuity.
Topic segmentation algorithms generally rely on a lexical cohesion signal that requires smoothing in order to eliminate noise from changes of word choices in adjoining statements that do not indicate topic shifts (Hearst, 1997; Barzilay and Elhadad, 1997). Many state of the art techniques use a slid-ing window for smoothslid-ing (Hearst, 1997; Miller et al. 1998; Galley et al., 2003). We employ a win-dowless method (WLM) for calculating a suitable cohesion signal which does not rely on a sliding window to achieve the requisite smoothing for an effective segmentation. Instead, WLM employs a
constrained minimal-spanning tree (MST) algo-rithm to find and join pairs of elements in a se-quence. In most applications, the nearest-neighbor search used by an MST involves an exhaustive, O(N2), search throughout all pairs of elements. However since WLM only requires information on the distance between adjoining elements in the se-quence the search space for finding the two closest adjoining elements is linear, O(N), where N is the number of elements in the sequence. We can there-fore take advantage of the hierarchical summary structure that an MST algorithm affords while not incurring the performance penalty.
Of particular interest for our research was the success of WLM on threaded dialogue. We evalu-ated WLM’s performance on the ICSI meeting corpus (Janin et al, 2003) by comparing our seg-mentation results to the results obtained by imple-menting LCSeg (Galley et al., 2003). Using the 25 hand segmented meetings, our algorithm achieved a significantly better segmentation for 20 out of 25 documents. Figure 2 shows the hypothesized seg-ments from the two algorithms on the ICSI Meet-ing Corpus.
integration of acoustic cues for speech transcripts, for example) features to aid in segmentation be-cause we wanted our system to be as versatile as possible. This approach provides the best segmen-tation possible for a variety of data sources, regard-less of data type.
2.3
Named Entity Extraction
In addition to topics, ChAT also has integrated software to extract the named entities. We use Cicero Lite from the Language Computer Corpora-tion (LCC) for our entity detecCorpora-tion (for a product description and evaluation, see Harabagiu et al., 2003). Using a combination of semantic represen-tations and statistical approaches, Cicero Lite iso-lates approximately 80 entity types. ChAT currently makes use of only a handful of these categories, but can easily be modified to include more. Because named entity extraction relies on cross-utterance dependencies, the main processing engine sends all utterance from a conversation at once rather than an utterance at a time.
2.4
Sentiment Analysis
In addition to topic and entity extraction, conversa-tions can also be analyzed by who participated in them and their relationship to one another and their attitude toward topics they discuss. In an initial attempt to capture participant attitude, we have included a sentiment analysis, or affect, compo-nent. Sentiment analysis is conducted via a lexical approach. The lexicon we employed is the General Inquirer (GI) lexicon developed for content analy-ses of textual data (Stone, 1977). It includes an extensive lexicon of over 11,000 hand coded word stems, and 182 categories, but our implementation is limited to positive (POS) and negative (NEG) axes. In ChAT, every utterance is scored for the number of positive and negative words it contains. We make use of this data by keeping track of the affect of topics in general, as well as the general mood of the participants.
2.5
Participant Roles
Analyzing conversations consists of more than analyzing the topics within them. Inherent to the nature of conversational data are the participants.
Using textual cues, one can gain insight into the relationships of participants to each other and the topics. In ChAT we have integrated several simple metrics as indicators of social dynamics amongst the participants. Using simple speaker statistics, such as number of utterances, number of words, etc., we can gain insight to the level of engagement of participants in the conversation. Features we use include:
• The number of utterance
• Proportion of questions versus
state-ments
• Proportion of “unsolicited” statements
(ones not preceded by a question mark)
Additionally, we use the same lexical resources as we use for sentiment analysis for indications of personality type. We make use of the lexical cate-gories of strong, weak, power cooperative, and power conflict as indicators of participant roles in the conversational setting. Thus far, we have not conducted any formal evaluation on the sentiment analysis with this data, but our initial studies of our pos and neg categories show a 73% agreement with hand tagged positive and negative segments on a different data set.
3
User Interface
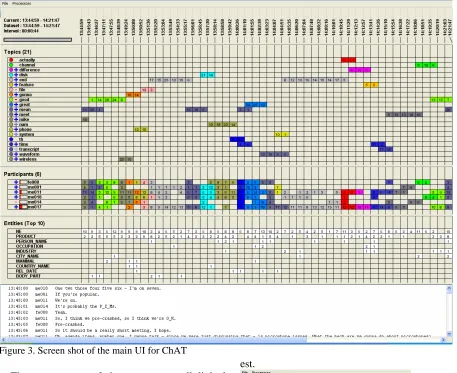
Figure 3. Screen shot of the main UI for ChAT
The components of the system are all linked through the X-axis, representing time, as seen in Figure 3. Depending on the dataset, positions along the time axis are based on either the time stamp or sequential position of the utterance. The default time range is the whole conversation or chat room session, but a narrower range can be selected by dragging in the interval panel at the top of the UI. Note that all of the values for each of the compo-nents are recalculated based on the selected time interval. Figure 4 shows that a time selection re-sults in a finer grained subset of the data, allowing one to drill down to specific topics of
[image:5.612.313.541.448.680.2]inter-est.
The number of utterance for a given time frame is indicated by the number inside the box corre-sponding to the time frame. The number is recalcu-lated as different time frames are selected.
3.1.1
Topics
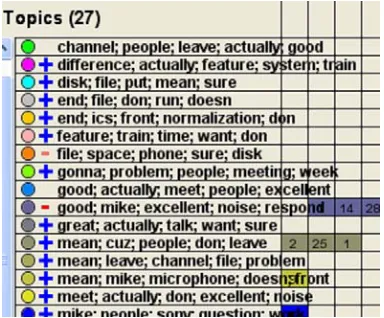
[image:6.612.71.263.375.534.2]The central organizing unit in the UI is topics. The topic panel, detailed in Figure 5, consists of three parts: the color key, affect scores, and topic labels. Once a data file is imported into the UI, topic seg-mentation is performed on the dataset according to the processes outline in Section 3.2. Topic labels are assigned to each topic chunk. Currently, we use the most prevalent word tokens as the label, and the user can control the number of words per label. Each topic segment is assigned a color, which is indicated by the color key. The persistence of a color throughout the time axis indicates which topic is being discussed at any given time. This allows a user to quickly see the distribution of top-ics of a meeting, for example. It also allows a user to quickly see the participants who discussed a given topic.
Figure 5. Topic Labels in the Topic Panel.
3.1.2
Affect
Affect scores are computed for each topic by counting the number of POS or NEG affect words in each utterance that comprises a topic within the selected time interval. Affect is measured by the proportion of POS to NEG words in the selected time frame. If the proportion is greater than 0, the score is POS (represented by a +), if it is less than 0, it is NEG (-). The degree of sentiment is
indi-cated by varying shades of color on the + or – symbol.
Note that affect is computed for both topics and participants. An affect score on the topic panel in-dicates overall affect contained in the utterances present in a given time frame, whereas the affect score in the participant panel indicates overall af-fect in a given participant’s utterances for that time frame.
3.1.3
Participants
The participant panel (Figure 6) consists of three parts: speaker labels, speaker contribution bar, and affect score. The speaker label is displayed in al-phabetical order and is grayed out if there are no utterances containing the topic in the selected time frame. The speaker contribution bar, displayed as a horizontal histogram, shows the speaker’s propor-tion of utterances during the time frame. Non ques-tion utterances are displayed in red while utterances containing questions are displayed in green as seen. For example, in Figure 6, we can see that speaker me011 did most of the talking (and was generally negative), but speaker me018 had a higher proportion of questions.
Figure 6. Participant Panel.
3.1.4
Named Entities
[image:6.612.314.532.397.558.2]3.2
Semantic Graph
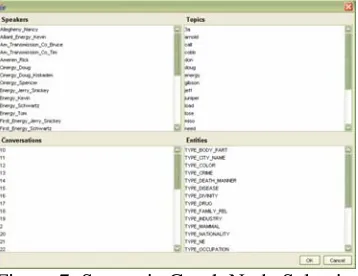
[image:7.612.74.253.227.365.2]Data that is viewed in the main UI can be sent to a semantic graph for further analysis. The graph al-lows a user to choose to highlight the relationships associated with a topic, participant, or individual named entity. The user selects objects of interest from a list (see Figure 7), then the graph function organizes a graph according to the chosen object, see Figure 8, that extracts the information from the time-linked view and represent it in a more abstract view that denotes relationships via links and nodes.
Figure 7. Semantic Graph Node Selection.
The semantic graph can help highlight relation-ships that might be hard to view in the main UI. For example, Figure 8 represents a subset of the Blackout data in which three participants, indicated by blue, all talked about the same named entity, indicated by green, but never talked to each other, indicated by the red conversation nodes.
Figure 8. Graph of the Relationship between Three Par-ticipants.
4
Discussion
In this paper, we have presented ChAT, a system designed to aid in the analysis of any kind of threaded dialogue. Our system is designed to be flexible in that the UI and processing components work with multiple data types. The processing components can be used independently, or within the UI. The UI aids users in in-depth analysis of individual conversations. The components can be run independent of the UI and in batch, resulting in an xml document containing the original tran-scripts and the metadata added by the processing components. This functionality allows the data to be manipulated by traditional text mining tech-niques, or to be viewed in any other visualization.
We have not performed user evaluation on the interface. Our topic segmentation performs better than the current state of the art, and named-entity extraction we have integrated is commercial grade. We are currently working on an evaluation of the affect scoring. While our topic segmentation is good, we are working to improve the labels we use for the topics. Most importantly, we plan on ad-dressing the usefulness of the UI with user studies.
References
R. Barzilay and M. Elhadad. Using lexical chains for text summarization. In Proc.of the Intelligent Scal-able Text Summarization Workshop(ISTS’97), ACL, 1997.
D. Beeferman, A. Berger, and J. Lafferty. 1999. Statisti-calmodels for text segmentation. Machine Learning, 34(1–3):177–210.
Carletta, J.C. and Kilgour, J. (2005) The NITE XML Toolkit Meets the ICSI Meeting Corpus: Import, An-notation, and Browsing. MLMI'04: Proceedings of the Workshop on Machine Learning for Multimodal Interaction. Samy Bengio and Herve Bourlard, eds. Springer-Verlag Lecture Notes in Computer Science Volume 3361.
F. Choi. 2000. Advances in domain independent linear text segmentation. In Proc. of NAACL’00.
van Deemter, Emiel Krahmer & Mariët Theune. 2005 .Real versus template-based Natural Language Gen-eration: a false opposition? Computational Linguis-tics 31(1), pages 15-24.
[image:7.612.73.285.487.650.2]Multi-party Conversation. In Proceedings of the 41st An-nual Meeting of the Association for Computational Linguistics (ACL-03). July 2003. Sapporo, Japan.
S. Harabagiu, D. Moldovan, C. Clark, M. Bowden, J. Williams, and J. Bensley. 2003. Answer Mining by Combining Extraction Techniques with Abductive Reasoning, Proceedings of the Twelfth Text Retrieval Conference (TREC ):375.
M. A. Hearst. TexTiling: Segmenting text info multi-paragraph subtopic passages. Computational Linguis-tics, 23(1):33–64, 1997.
J. Hirschberg and C. Nakatani. A prosodic analysis of discourse segments in direction-giving monologues. In Proc.ACL, pp. 286–293, Santa Cruz, CA, 1996.
A. Janin, D. Baron, J. Edwards, D. Ellis, D. Gelbart,N. Morgan, B. Peskin, T. Pfau, E. Shriberg, A. Stolcke, and C. Wooters. 2003. The ICSI meeting corpus. In
Proc. of ICASSP-03, Hong Kong
N. E. Miller, P. Wong, M. Brewster, and H. Foote. TOPIC ISLANDS - A wavelet-based text visualiza-tion system. In David Ebert, Hans Hagen, and Holly Rushmeier, editors, IEEE Visualization '98, pages 189-196, 1998.
A. Stolcke, E. Shriberg, D. Hakkani-Tur, G. Tur, Z. Rivlin, K. Sonmez (1999), Combining Words and Speech Prosody for Automatic Topic Segmentation.
Proc. DARPA Broadcast News Workshop, pp. 61-64, Herndon, VA.