114
Investigation On Performance Of Diesel Engine With Tyre Pyrolysis
Oil
K.Suresh Kumar1 A.N.S.Satya Prasad2 A.Hari Krishna3 A.Siva Krishna4 D.Chandra Shekar5 M.Venkatesh Prasad6
1Asst.Professor, Mechanical Engineering, NNRG, Telangana, India 2, 3, 4, 5, 6
Student, Mechanical Engineering, NNRG, Telangana, India
ABSTRACT: Alternative fuels and advanced technology vehicles are seen by proponents as integral to improving urban air quality, decreasing dependence on foreign oil, and reducing emissions of greenhouse gases. However, major barriers — especially economics — currently prevent the widespread use of these fuels and technologies. Because of these barriers, and the potential benefits, there is continued congressional interest in providing incentives and other support for their development and commercialization. To overcome this problem, it is very important to find alternative fuels. Increase in energy demand, stringent emission norms and depletion of oil resources led to finding alternative fuels for internal combustion engines. Many alternative fuels like alcohols, bio-diesel, liquid petroleum gas (LPG), compressed natural gas (CNG), etc have been already commercialized in the transport sector. The main focus of this review is to shed light on the importance of tyre pyrolysis oil as an alternative fuel for diesel engines. In this context, tyre pyrolysis oil has recently been receiving renewed interest. In the present work performance characteristics and emissions are evaluated on single cylinder four stroke diesel engine fuelling with 10%, 20%, 30%, 40%, 50%, 60%, for tyre pyrolysis oil by volume. Due to high viscosity and soot formation, above 60% was not taken tyre pyrolysis oil- diesel blend. Experiments are carried out on a diesel engine, which is a single cylinder four stroke engine capable of developing a power output of 7.5KW at 1500 rpm. Performance parameters such as Brake Power, Specific Fuel Consumption, Indicated Thermal Efficiency, Brake Thermal Efficiency, Volumetric Efficiency, Mechanical
Efficiency, Brake Mean Effective Pressure and Indicated Mean Effective Pressure are calculated based on the experimental analysis of the engine. Emissions such as Carbon Monoxide, Hydro Carbons are measured.
KEYWORDS: Emissions, trans-esterification, Internal combustion engine, Tyre pyrolysis oil and Efficiency
1. 1.INTRODUCTION
Compression ignition engines are employed particularly in the field of heavy transportation and agriculture on account of their higher thermal efficiency and durability. However, diesel engines are the major contributors of oxides of nitrogen and particulate emissions. Hence more stringent norms are imposed on exhaust emissions. Following the global energy crisis in the 1970s and the increasingly stringent emission norms, the search for alternative renewable fuels has intensified. Fast depletion of fossil fuels demands an urgent need to carry out research work to find out the viable alternative fuels; and since atmospheric pollutants are increasing, an eco friendly fuel needs to be developed to meet the fossil fuel depletion. Thus a lot of research has been done to recover energy from waste materials, including materials that are not bio-degradable. Such materials include biomass, municipal solid wastes, industrial wastes, agri- cultural wastes and other low grade fuels, as well as high energy density materials such as rubber and plastics. The tyre and tube wastes pose big environmental problem because rubber is an artificial polymer and also not biodegradable. The photo- degradation of rubber waste takes more time as compared to biomass.
2. LITERATURE SURVEY
The gradual depletion of world petroleum reserves, increases in prices of petroleum based fuels and environmental pollution due to exhaust emissions have encouraged studies to search for alternative fuels. In view of these, vegetable oil has been considered as alternative fuels for compression ignition engines. Vegetable oils are renewable, nontoxic, biodegradable, and have low emission profiles. However, there are some drawbacks related to the use of straight vegetable oils in diesel engines primarily due to their high viscosity, lower volatility and lower heat content. The high viscosity causes some problems in atomization of injector systems and combustion in cylinders of diesel engines. Also, in long term operations, high viscosity of
vegetable oils may lead to ring sticking, formation of injector deposits, development of gumming, as well as incompatibility with lubricating oils.Different techniques have been developed to solve their high viscosity and low volatility problems of vegetable oils, such as preheating oils, blending or dilution with other fuels, Trans-Esterification and thermal cracking/pyrolysis [1, 2, 10–12]. Trans-Esterification appears to be the most promising technique which is a chemical process of converting vegetable oil into biodiesel fuel. Biodiesel can be used as a blend in diesel engines without modification. Detailed reviews about trans-Esterification process are available in the literature . The price of edible vegetable oils is higher than that of the diesel fuel. Therefore, instead of using such oils, the use of waste vegetable oils and non-edible crude vegetable oils has been considered as potential alternative fuels.
Research on the pyrolysis mechanism is very important for reactor design and desired product profiles. When tyre particles are heated in a pyrolysis reactor, pyrolysis occurs
when the par- ticles' surface reaches a certain temperature [7].
115
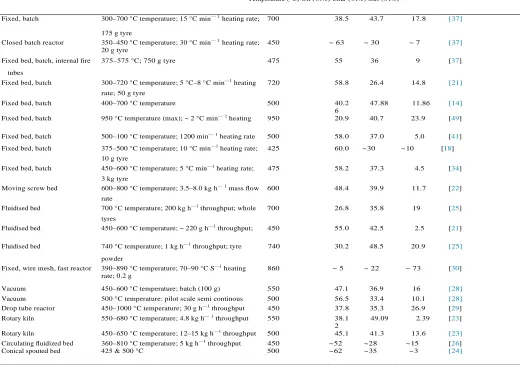
between 700 °C and 800 °C. Fuel oil was produced without much gas at low tem- perature (below 500 °C) and the char fraction was found to decrease as temperature increased from 300 to 720 °C [9].Cui et al. found that the pyrolysis kinetics of the scrap tyre rubbers can be well represented by the first-order irreversible decomposition reactions of its components [10]. Fig. 1(a) and(b) gives some typical
curves of derivative thermogravimetry (DTG) and
thermogravimetric analysis (TGA) which were found to provide valuable information on pyrolysis kinetics and mechan- isms of scrap tyre rubbers [11]. Heating at a rate of 10 °C/min in nitrogen, the peak at the lower temperature is caused by the decomposition of natural rubber, and that at the higher tem- perature is caused by the decomposition of butadiene rubber (for a trunk tyres) [12].
Reactor Experimental conditions Maximum oil yield References
Temperature (°C) Oil (wt%) Char (wt%) Gas (wt%)
Fixed, batch 300–700 °C temperature; 15 °C min—1 heating rate; 700 38.5 43.7 17.8 [37]
175 g tyre
Closed batch reactor 350–450 °C temperature; 30 °C min—1 heating rate;
20 g tyre
450 ~ 63 ~ 30 ~ 7 [37]
Fixed bed, batch, internal fire 375–575 °C; 750 g tyre 475 55 36 9 [37]
tubes
Fixed bed, batch 300–720 °C temperature; 5 °C–8 °C min—1 heating 720 58.8 26.4 14.8 [21]
rate; 50 g tyre
Fixed bed, batch 400–700 °C temperature 500 40.2
6
47.88 11.86 [14]
Fixed bed, batch 950 °C temperature (max); ~ 2 °C min—1 heating 950 20.9 40.7 23.9 [49]
Fixed bed, batch 500–100 °C temperature; 1200 min—1 heating rate 500 58.0 37.0 5.0 [41]
Fixed bed, batch 375–500 °C temperature; 10 °C min—1 heating rate; 425 60.0 ~ 30 ~ 10 [18]
10 g tyre
Fixed bed, batch 450–600 °C temperature; 5 °C min—1 heating rate; 475 58.2 37.3 4.5 [34]
3 kg tyre
Moving screw bed 600–800 °C temperature; 3.5–8.0 kg h—1 mass flow 600 48.4 39.9 11.7 [22]
rate
Fluidised bed 700 °C temperature; 200 kg h—1 throughput; whole 700 26.8 35.8 19 [25]
tyres
Fluidised bed 450–600 °C temperature; ~ 220 g h—1 throughput; 450 55.0 42.5 2.5 [21]
Fluidised bed 740 °C temperature; 1 kg h—1 throughput; tyre 740 30.2 48.5 20.9 [25]
powder
Fixed, wire mesh, fast reactor 390–890 °C temperature; 70–90 °C S—1 heating
rate; 0.2 g
860 ~ 5 ~ 22 ~ 73 [30]
Vacuum 450–600 °C temperature; batch (100 g) 550 47.1 36.9 16 [28]
Vacuum 500 °C temperature: pilot scale semi continous 500 56.5 33.4 10.1 [28]
Drop tube reactor 450–1000 °C temperature; 30 g h—1 throughput 450 37.8 35.3 26.9 [29]
Rotary kiln 550–680 °C temperature; 4.8 kg h—1 throughput 550 38.1
2
49.09 2.39 [23]
Rotary kiln 450–650 °C temperature; 12–15 kg h—1 throughput 500 45.1 41.3 13.6 [23]
Circulating fluidized bed Conical spouted bed
360–810 °C temperature; 5 kg h—1 throughput
425 & 500 °C
450 500
~ 52 ~ 62
~ 28 ~ 35
~ 15 ~ 3
[26]
[24]
In the present investigation, , Tyre pyrolysis oil was considered as a potential alternative fuel for compression ignition engines. Specifications of the , Tyre pyrolysis oil investigated and compared with other vegetable oils and this was the basic motivation behind the research in this project. The engine tests were carried out on a direct injection diesel engine fuelled with diesel fuel and10%, 20%, 30%, 40%, 50% and 60% , Tyre pyrolysis oil -diesel blends by volume.
3. ANALYSIS OF TYRE PYROLYSIS OIL The Fourier Transform Infrared Spectroscopy (FTIR) offers a quantitative and qualitative analysis for organic and inorganic
[image:2.612.50.570.175.540.2]samples. The spectra produce a profile of the sample a distinctive molecular fingerprint that can be used to screen and scan samples for many different components. It identifies chemical bonds in amolecule by producing an infrared absorption spectrum. The FTIR is an effective analytical instrument for detecting functional groups and characterizing covalent bonding formation. The FTIR test was carried out with Perkin Elmer Spectrum ONE equipment which has a scan range of 450-4000 cm-1with a resolution of 1.0 cm-1. The FTIR analysis of TPO revels that, the functional group present are almost aromatics and hydrocarbons.
TABLE NO 1.1 Properties of Tyre pyrolysis oil
PROPERTIES DIESEL Tyre pyrolysis oil
116 4. SPECIFICATION OF THE PROBLEM
In the present work the performance characteristics and emissions are evaluated on single cylinder four stroke diesel engine air cooled, which is capable of developing a power output of 7.5kW at 1500rpm, fuelling with 10%, 20%, 30%, 40%, 50%, 60%, for Tyre Pyrolysis Oil by volume. Due to high viscosity and soot formation, above 60% was not taken in Tyre Pyrolysis Oil- diesel blend. The Performance parameters
such as Brake Power, Specific Fuel Consumption, Indicated Thermal Efficiency, Brake Thermal Efficiency, Volumetric Efficiency, Mechanical Efficiency, Brake Mean Effective Pressure, Indicated Mean Effective Pressure are calculated based on the experimental analysis of the engine. Emissions such as Carbon Monoxide, Hydro Carbons are measured.
5. EXPERIMENTAL SETUP
The experimental setup is fabricated to fulfill the objective of the present work. The various components of the experimental set up including modification are shown in fig no.1.
Various Parts of Experimental Setup 1. Alamgair Engine 2 Alternator
3.Diesel Tank
4.Air Filter
5.Three Way Valve
6.Exhaust Pipe
7.Probe
8.Exhaust Gas Analyser
9.Alternative Fuel Tank
10.Burette
11.Three Way Valve
12.Control Panel
a. EXPERIMENTAL PROCEDURE
Before starting the engine, the lubricating oil level in the engine is checked and it is also ensured that all moving and rotating parts are lubricated.
The various steps involved in the setting of the experiments are
1. The Experiments were carried out after installation
of the engine
2. The injection pressure is set at 200 bar for the entire test.
3. Precautions were taken, before starting the
experiment.
4. Always the engine was started with no load
condition
5. The engine was started at no load condition and allowed to work for at least 10 minutes to stabilize.
6. The readings such as fuel consumption, spring
balance reading, cooling water flow rate, manometer reading etc., were taken as per the observation table.
7. The load on the engine was increased by 20% of FULL Load using the engine controls and the readings were taken as shown in the table.
8. Step 3 was repeated for different loads from
no load to full load.
9. After completion of test, the load on the engine was completely relieved and then the engine was stopped.
10. The results were calculated theoretically and
tabulated.
The above experiment is repeated for various loads on the engine. The experimental procedure is similar as foresaid. While starting the engine, the fuel tank is filled in required fuel proportions up to its capacity. The engine is allowed to run for 20 min, for steady state conditions, before load is performed.
There was no separation of diesel and Tyre Pyrolysis Oil blends even at B50 and B60. f diesel. Finally, the engine is run by blend (200 atm) at various loads and the corresponding observations are
Density at 15 0C (kg/m3) 823 907
Flash point (0C) 56 40
117
noted.
The test is carried on the single cylinder CI Engine for the following fuel blends:
1.100% Diesel
2.10% Tyre Pyrolysis Oil + 90% Diesel
3.20% Tyre Pyrolysis Oil + 80% Diesel
4.30% Tyre Pyrolysis Oil + 70% Diesel
5.40% Tyre Pyrolysis Oil + 60% Diesel
6.50% Tyre Pyrolysis Oil + 50% Diesel
7.60% Tyre Pyrolysis Oil + 40% Diesel
6. 6.RESULTS AND DISCUSSIONS
Experiments were conducted when the engine was fuelled with Tyre Pyrolysis Oil and their blends with diesel in proportions of 20:80, 30:70 and 40:60 (by volume) which are generally called as TPO-20, TPO-30 and TPO-40 respectively. The experiment covered a range of loads.
The performance of the engine was evaluated in terms of brake specific fuel consumption, brake thermal efficiency and volumetric efficiency. The emission characteristics of the engine were studied in terms, concentration of HC and CO. The results obtained for Tyre Pyrolysis Oil and their blends with diesel were compared with the results of diesel used as fuel.
[image:4.612.59.553.232.375.2].
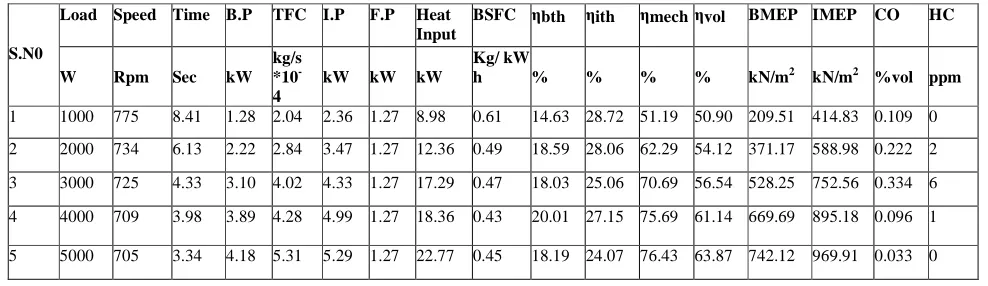
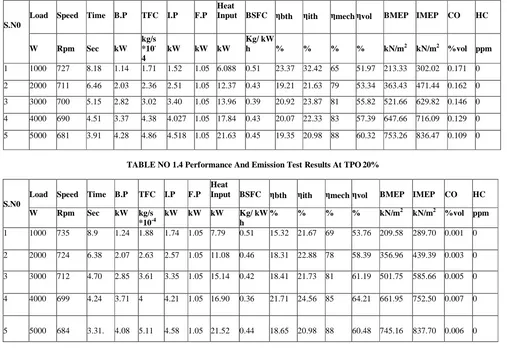
TABLE NO 1.2 Performance And Emission Test Results At Pure Diesel
S.N0
Load Speed Time B.P TFC I.P F.P Heat Input
BSFC ηbth ηith ηmech ηvol BMEP IMEP CO HC
W Rpm Sec kW kg/s *10 -4
kW kW kW
Kg/ kW
h % % % % kN/m2 kN/m2 %vol ppm
1 1000 775 8.41 1.28 2.04 2.36 1.27 8.98 0.61 14.63 28.72 51.19 50.90 209.51 414.83 0.109 0
2 2000 734 6.13 2.22 2.84 3.47 1.27 12.36 0.49 18.59 28.06 62.29 54.12 371.17 588.98 0.222 2
3 3000 725 4.33 3.10 4.02 4.33 1.27 17.29 0.47 18.03 25.06 70.69 56.54 528.25 752.56 0.334 6
4 4000 709 3.98 3.89 4.28 4.99 1.27 18.36 0.43 20.01 27.15 75.69 61.14 669.69 895.18 0.096 1
118
TABLE NO 1.3 Performance And Emission Test Results At TPO 10%
S.N0
Load Speed Time B.P TFC I.P F.P Heat
Input BSFC ηbth ηith ηmech ηvol BMEP IMEP CO HC
W Rpm Sec kW kg/s *10 -4
kW kW kW
Kg/ kW
h % % % % kN/m2 kN/m2 %vol ppm
1 1000 727 8.18 1.14 1.71 1.52 1.05 6.088 0.51 23.37 32.42 65 51.97 213.33 302.02 0.171 0
2 2000 711 6.46 2.03 2.36 2.51 1.05 12.37 0.43 19.21 21.63 79 53.34 363.43 471.44 0.162 0
3 3000 700 5.15 2.82 3.02 3.40 1.05 13.96 0.39 20.92 23.87 81 55.82 521.66 629.82 0.146 0
4 4000 690 4.51 3.37 4.38 4.027 1.05 17.84 0.43 20.07 22.33 83 57.39 647.66 716.09 0.129 0
5 5000 681 3.91 4.28 4.86 4.518 1.05 21.63 0.45 19.35 20.98 88 60.32 753.26 836.47 0.109 0
TABLE NO 1.4 Performance And Emission Test Results At TPO 20%
S.N0
Load Speed Time B.P TFC I.P F.P Heat
Input BSFC ηbth ηith ηmech ηvol BMEP IMEP CO HC
W Rpm Sec kW kg/s *10-4
kW kW kW Kg/ kW h
% % % % kN/m2 kN/m2 %vol ppm
1 1000 735 8.9 1.24 1.88 1.74 1.05 7.79 0.51 15.32 21.67 69 53.76 209.58 289.70 0.001 0
2 2000 724 6.38 2.07 2.63 2.57 1.05 11.08 0.46 18.31 22.88 78 58.39 356.96 439.39 0.003 0
3 3000 712 4.70 2.85 3.61 3.35 1.05 15.14 0.42 18.41 21.73 81 61.19 501.75 585.66 0.005 0
4 4000 699 4.24 3.71 4 4.21 1.05 16.90 0.36 21.71 24.56 85 64.21 661.95 752.50 0.007 0
5 5000 684 3.31. 4.08 5.11 4.58 1.05 21.52 0.44 18.65 20.98 88 60.48 745.16 837.70 0.006 0
TABLE NO 1.5 Performance And Emission Test Results At TPO 30%
S.N0
Load Speed Time B.P TFC I.P F.P Heat Input
BSFC ηbth ηith ηmech ηvol BMEP IMEP CO HC
W Rpm Sec kW kg/s *10-4
kW kW kW Kg/ kW h
% % % % kN/m2 kN/m2 %vol ppm
1 1000 721 6.93 1.01 2.181 2.26 1.15 9.88 0.68 12.12 23.64 41 47.96 207.70 414.30 0.002 1
2 2000 710 6.30 1.91 2.411 3.12 1.15 10.93 0.41 17.75 29.07 58 52.65 361.97 573.76 0.003 2
3 3000 697 4.73 2.65 3.24 4.01 1.15 14.34 0.36 18.76 27.98 63 53.93 509.34 724.97 0.008 3
4 4000 680 3.87 3.40 3.96 4.65 1.15 17.41 0.35 20.34 26.34 71 55.74 658.52 879.97 0.006 2
5 5000 669 3.49 4.10 4.63 5.35 1.15 21.42 0.30 20.15 26.10 75 61.09 799.11 1017.88 0.009 4
[image:5.612.61.563.462.591.2]119
S.N0
Load Speed Time B.P TFC I.P F.P Heat Input
BSFC ηbth ηith ηmech ηvol BMEP IMEP CO HC
W Rpm Sec kW kg/s *10-4
kW kW kW Kg/ kW h
% % % % kN/m2 kN/m2 %vol ppm
1 1000 732 7.09 1.14 2.03 2.14 1 8.75 0.52 13.65 24.92 51 55.86 201.57 372.19 0.001 0
2 2000 720 6.14 2.01 2.62 3.20 1 11.23 0.41 18.17 28.67 59 59.03 354.19 562.30 0.004 0
3 3000 708 4.84 2.37 3.31 3.93 1 14.13 0.39 19.15 27.32 65 61.5 470 682.95 0.002 0
4 4000 697 4.72 3.56 4.02 4.76 1 15.99 0.33 22.76 29.39 71 66.7 654.5 870.12 0.034 0
5 5000 689 3.17 4.21 4.75 5.42 1 19.76 0.31 21.36 26.55 76 57.3 778.36 1001.91 0.017 0
TABLE NO 1.7 Performance And Emission Test Results At TPO 50%
S.N0
Load Speed Time B.P TFC I.P F.P Heat Input
BSFC ηbth ηith ηmec h
ηvol BMEP IMEP CO HC
W Rpm Sec kW kg/s *10-4
kW kW kW Kg/ kW h
% % % % kN/m2 kN/m2 %vol ppm
1 1000 720 8.30 1.11 1.99 2.31 1 8.16 0.51 13.47 27.82 47 51.68 207.84 409.95 0.0019 0
2 2000 709 6.10 2.02 2.52 3.12 1 11.26 0.44 16.66 28.22 60 54.21 371.85 577.03 0.003 0
3 3000 686 5.56 2.75 2.96 4.05 1 12.34 0.34 20.72 31.29 67 56.94 507.92 714.57 0.003 1
4 4000 679 4.35 3.31 3.52 4.65 1 15.44 0.36 22.38 29.30 71 60.20 648.61 833.04 0.004 0
5 5000 666 3.67 4.20 4.15 5.40 1 18.71 0.34 22.99 27.23 75 62.64 802.30 1019.27 0.007 0
TABLE NO 1.8 Performance And Emission Test Results At TPO 60%
S.N0
Load Speed Time B.P TFC I.P F.P Heat Input
BSFC ηbth ηith ηmech ηvol BMEP IMEP CO HC
W Rpm Sec kW kg/s *10-4
kW kW kW Kg/ kW h
% % % % kN/m2 kN/m2 %vol ppm
1 1000 725 8.32 1.13 1.87 1.73 1.25 8.08 0.51 14.83 32.37 41 55.39 203.19 466.44 0.001 0
2 2000 708 6.4 1.91 2.36 2.54 1.25 10.95 0.44 17.16 31.03 52 56.33 349.69 614.18 0.002 0
3 3000 710 4.99 2.56 3.17 3.35 1.25 13.32 0.39 20.02 30.93 59 60.75 498.18 765.33 0.003 3
4 4000 687 4.31 3.26 3.55 4.19 1.25 15.28 0.35 23.28 32.31 69 61.47 660.23 932.16 0.002 0
120 0
1 2 3 4 5 6
1 0 0 0 2 0 0 0 3 0 0 0 4 0 0 0 5 0 0 0
T
F
C
K
G
/S
LOAD KW
F R I C T I O N P O W E R
Diesel TPO 10 TPO 20 TPO 30
TPO 40 TPO 50 TPO 60
0 20 40 60 80 100
1 0 0 0 2 0 0 0 3 0 0 0 4 0 0 0 5 0 0 0
L O A D V S M E C H A N I C A L E F F I C I E N C Y
DIESEL TPO 10 TPO 20 TPO 30
TPO 40 TPO 50 TPO 60
0 200 400 600 800 1000
1 0 0 0 2 0 0 0 3 0 0 0 4 0 0 0 5 0 0 0
L O A D V S B M E P
Diesel TPO 10 TPO 20 TPO 30
TPO 40 TPO 50 TPO 60
0 5 10 15 20 25
1 0 0 0 2 0 0 0 3 0 0 0 4 0 0 0 5 0 0 0
L O A D V S B R A K E E F F I C I E N C Y
DIESEL TPO 10 TPO 20 TPO 30 TPO 40 TPO 50 TPO 60
0 0.1 0.2 0.3 0.4 0.5 0.6 0.7 0.8
1 0 0 0 2 0 0 0 3 0 0 0 4 0 0 0 5 0 0 0
L O A D V S B S F C
DIESEL TPO 10 TPO 20 TPO 30
TPO 40 TPO 50 TPO 60
0 5 10 15 20 25 30 35
1 0 0 0 2 0 0 0 3 0 0 0 4 0 0 0 5 0 0 0
L O A D V S I N D I C A T E D T H E R M A L E F F I C I E N C Y
DIESEL TPO 10 TPO 20 TPO 30
121
In friction power all blends of tyre pyrolysis oil and diesel performs almost same but with small difference diesel tops the list.
In mechanical efficiency the blends of tyre
pyrolysis oil 10 and 20 performs best when compared with all other blends and diesel.
In case BMEP all blends of tyre pyrolysis oil
including diesel the performance is almost equal.
From part load 1000 to 3000 tyre pyrolysis oil
10 performs best and at part load 5000 tyre pyrolysis oil 50 serves the best.
At an average the diesel performs best in BSFC
but at higher loads tyre pyrolysis oil 10 gives the best.
In indicated thermal efficiency the tyre
pyrolysis oil 60 performs the best at all parts load.Even tyre pyrolysis oil 50, 40 and 30 performs better than diesel.
In IMEP expect the blends of tyre pyrolysis
oil 10 and 20, all others blends performs better than diesel and tyre pyrolysis oil 60 tops the list.
In volumetric efficiency all blends of tyre
pyrolysis oil along diesel performes equally and tyre pyrolysis oil 40 performes best in all till part load 4000.
In emission of pollutants such as CO and HC
all blends of tyre pyrolysis oil are very less when compared to diesl in some part loads the emission are zero when tyre pyrolysis oil is used.
7. CONCLUSIONS
The conclusions are made from the results obtained in the experiment conducted using diesel engine in which Tyre pyrolysis oil is used as fiel.From the above analysis tyre pyrolysis oil is best substitute for diesel in all formats since performance is almost same in all part loads..Mainly in the case emissions tyre pyrolysis oil is best when compared with diesel.From all the above results tyre pyrolysis oil 60 has best charactersitics it better for the usage as fuel.
REFRENCES
[1] Murugesan A, Umarani C, Subramanian R,
Nedunchezhian N. Bio-diesel as an alternative fuel for diesel engines – a review. Renew Sustain Energy Rev 2009;13:653–62.
[2] Wang H, Xu H, Xuan X. Review of waste tire
reuse and recycling in china –
[3] current situation problems and countermeasure.
Nat Sci 2009;2(1).
[4] Jang JW, Yoo TS, Oh JH, Iwasakai I. Discarded
tyre recycling practices in the United States,Japan and
0 200 400 600 800 1000 1200
1 0 0 0 2 0 0 0 3 0 0 0 4 0 0 0 5 0 0 0
L O A D V S I M E P
DIESEL TPO 10 TPO 20 TPO 30
TPO 40 TPO 50 TPO 60
0 10 20 30 40 50 60 70 80
1 0 0 0 2 0 0 0 3 0 0 0 4 0 0 0 5 0 0 0
L O A D V S V O L U M E T R I C E F F I C I E N C Y
DIESEL TPO 10 TPO 20 TPO 30
TPO 40 TPO 50 TPO 60
0 1 2 3 4 5 6 7
1 0 0 0 2 0 0 0 3 0 0 0 4 0 0 0 5 0 0 0
L O A D V S H C
DIESEL TPO 10 TPO 20 TPO 30
TPO 40 TPO 50 TPO 60
0 0.05 0.1 0.15 0.2 0.25 0.3 0.35 0.4
1 0 0 0 2 0 0 0 3 0 0 0 4 0 0 0 5 0 0 0
L O A D V S C O
DIESEL TPO 10 TPO 20 TPO 30
122
Korea. Resour Conserv Recycl 1998;22:1–14.
[5] Harshaft A. Solid waste treatment technology.
Environ Sci Technol 1972;6:412–21.
[6] Antoniou N, Zabaniotou A. Features of an
efficient and environmentally attractive used tyres pyrolysis with energy and material recovery. Renew Sustain Energy Rev 2012:539–58.
[7] Lanoir D, Trouve G, Delfosse L. Physical and
chemical characterization of automotive shredder residues. Waste Manag 1997;17:1475–82.
[8] Yongrong Yang, Jizhong Chen, Guibin Zhao,
Technical advance on the pyrolysis of used tires in China. In: Proceedings of the China-Japan International Aca- demic Symposium, 6; 2000.
[9] Senneca O, Salatino P, Chirone R. Fast
heating-rate thermogravimetric study of the pyrolysis of scrap tyres. Fuel 1999;78:1575–81.
[10]Wey MY, et al. Low energy and chemical free
activation of pyrolytic tire. J Air Waste Manag 1995;45:855–63.
[11]Cui H, et al. Biocrude Production through Pyrolysis
of Used Tyres. Chem Ind Eng (China) 1999;50:826– 33.
[12]Williams PT, Besler S.
Pyrolysis-thermogravimetric analysis of tyres and tyre components. Fuel 1995;14:1277–83.
[13]Lopez Felix A, El Hadad Amir A, Alguacil
Francisco J, Centeno Teresa A, Lobato Belen. Kinetica of the thermal degradation of granulated scrap tyres: a model- free analysis. Mater Sci 2010;9.
[14]Williams PT. Pyrolysis of waste tyres: a review.
Waste Manag 2013;33:1714–
[15]28.
[16]Aydın H, Ilkılıc C. Optimization of fuel production
from waste vehicle tires by pyrolysis and resembling to diesel fuel by various desulfurization methods. Fuel 2012;102:605–12.
[17]Williams PT, Besler S, Taylor DT. The pyrolysis
of scrap automotive tyres: the
[18]influence of temperature and heating rate on
product composition. Fuel 1990;69:1474–82.
[19]Dodds J, Domenico WF, Evans DR. Scrap tyres:a
resource and technology
[20]evaluation of tyre pyrolysis and other selected
alternative technologies. US Deptartment of Energy Report EGG-241. US: Washington, DC; 1983.
[21]Islam MN, Khan MFR, Alam MZ. Production and
characterization of scrap tyre
[22]pyrolysis oil and its blend. In: Proceedings of the
International Conference on Mechanical Engineering, Bangaladesh; 2003. p. 26–8.
[23]Kar Y. Catalytic pyrolysis of car tire waste using
expanded perlite. Waste
[24]Manag 2011;31:1772–82.
[25]Banar M, Akyıldız V, Ozkan A, Cokaygil Z, Onay
O. Characterization of pyrolytic oil obtained from pyrolysis of tire derived fuel (TDF). Energy Convers Manag 2012;62:22–30.
[26]Rada EC, Ragazzi M, Dal Maschio R, Ischia M,
Panaitescu VN. Energy recovery from tyres waste through thermal option. Sci Bull, Politeh Univ Buchar, Ser D Mech Eng 2012;74:201–10.
[27]Williams PT, Brindle AJ. Catalytic pyrolysis of
tyres: influence of catalyst
[28]temperature. Fuel 2002;81:2425–34.
[29]Aylón E, Fernández-Colino A, Murillo R, Navarro
MV, García T, Mastral AM. Valorisation of waste tyre by pyrolysis in a moving bed reactor. Waste Manag 2011;30:1220–4.
[30]Galvagno S, Casu S, Casabianca T, Calabrese A,
Cornacchia G. Pyrolysis process
[31]for the treatment of scrap tyres: preliminary
experimental results. Waste Manag 2002;22:917– 23.
[32]Arabiourrutia M, Lopez G, Elordi G, Olazar M,
Aguado R, Bilbao J. Product distribution obtained in the pyrolysis of tyres in a conical spouted bed reactor. Chem Eng Sci 2007;62:5271–5.
[33]Kaminsky W, Shin H. Pyrolysis of plastic waste
and scrap tyres using a flui-dized bed process. American Chemical Society; 1980. p. 423–33.
[34]Dai X, Yin X, Wu C, Zhang W, Chen Y. Pyrolysis
of waste tires in a circulating
[35]fluidized bed reactor. Energy 2001;26:385–99.
[36]Lopez G, Olazar M, Aguado R, Bibao J. Continous
pyrolysis of waste tyres in a conical spouted bed reactor. Fuel 2010;89:1946–52.
[37]Roy C, Chaala A, Darmstadt H. The vacuum
pyrolysis of used tires: end-uses for oil and carbon black products. Appl Pyrolysis 1999;51:201–21.
[38]Conesa J, Martian-Gulloan I, Font R, Jauhiainen J.
Complete study of the pyr- olysis and gasification of scrap tires in a pilot plant reactor. Environ Sci Technol 2004;38:3189–94.
[39]Zabaniotou AA, Stavropoulos G. Pyrolysis of used
automobile tires and residual
[40]char utilization. Appl Pyrolysis 2003;70:711–22.
[41]Rada Elena Cristina, Ragazzi Marco, Maschio
Roberto dal, Ischia Marco, Panaitescu Valeriu Nicolae. Energy recovery from tyres waste through thermal option. U.P.B. Sci Bull 2012;4:201–10.
[42]William PT, Besler S, Taylor DT. The pyrolysis of
scrap automotive tyres. Fuel 1990;69:1474–82.
[43]Merchant AA, Petrich MA. Pyrolysis of scrap tires
and conversion of chars to activated carbon. AICHE J 1993;39:1370–6.
[44]Cunliffe AM, Williams PT. Composition of oils
derived from the batch pyrolysis of tires. Anal Appl Pyrolysis 1998;44:131–52.
[45]Suhanya M, Thirumarimurugan M, Kannadasan T.
Recovery of oil from waste
[46]tyres using pyrolysis method. Int J Res Eng
Technol 2013;1:81–90.
[47]Mazloom G, Farhadi F, Khorasheh F. Kinetic
modeling of pyrolysis of scrap tires. Appl Pyrolysis 2009;84:157–64.
[48]Islam MR, Joardder MUH, Hasan SM, Takai K,
Haniu H. Feasibility study of thermal treatment of solid tire wastes in Bangladesh by using pyrolysis technology. Waste Manag 2011;31:2142–9.
[49]Williams PT, Besler S.
Pyrolysis-thermogravimetric analysis of tyres and tyre
[50]components. Fuel 1995;74:1277–83.
[51]Pradhan Debalaxmi, Singh RK. Thermal pyrolysis
of bicycle waste tyre using batch reactor. Int J Chem Eng Appl 2011;2:332–6.
[52]Gray Terry. Tire derived fuel: environment
characteristics and performance. In: Proceedings of the First Northeast Regional scrap tire conference; 2004. p.1–19.
[53]Leung DYC, Wang CL. Kinetic study of scrap
tyre pyrolysis and combustion.
[54]Appl Pyrolysis 1998;45:153–69.
[55]Isabel de Marco Rodriguez MF, et al. Pyrolysis of
scrap tyres. J Fuel Process Technol 2001;72:9–22.
[56]Rodriquez Isabel de Marco, Laresgoiti MF,
Cabrero MA, Torres A, Chomon MJ,
123
Technol 2001;72:9–22.
[58]Williams PT. Combustion of tyre pyrolysis oil.
Process Saf Environ Prot 1998;4:291–301.
[59]Hariharan S. Effect of diethyl ether on tyre
pyrolysis oil fueled diesel engine. Fuel 2013;104:109–15.
[60]Ilkilic C, Aydin H. Fuel production from waste
vehicle tires by catalytic pyr- olysis and its
application in a diesel engine. Fuel Process Technol 2011;92 (5):1129–35.
[61]Williams PT. Combustion of tyre pyrolysis oil.
Process Saf Environ Prot
[62]1998;76(4):291–301.
[63]Cunliffe Adrian M, Paul Williams T. Composition
of oils derived from the batch pyrolysis of tyres. App Pyrol 1998;44:131–52.
[64]Williams PT, Bottrill RP, Cunliffe AM.
Combustion of tyre pyrolysis oil. lChemE
[65]1998;76:291–301.
[66]Williamson AM, Badr O.Assessing the viability of using
rape methyl ester (RME) as an alternative to mineral diesel fuel for powering road vehicles in the UK. Applied Energy1998; 59(2– 3):187–214.
[67]Ma F, Hanna MF. Biodiese l production: A review.
Bioresource Technology 1999; 70:1–15.
[68]Srivastava A, Prasad R.Triglyceride s-based diesel fuels.
Renewable and Sustainable Energy Reviews 2000; 4:111– 33.
[69]Kalam MA, Husnawan M, Masjuki HH. Exhaust
emission and combustion evaluation of coconut oil-powered indirect injection diesel engine. Renew able Energy 2003; 28:2405–15.
[70]Kalligeros S, Zannikos F, Stournas S, Lois E,
Anastopoulos G, Teas CH, Sakellaropoulos F. An
investigation of using biodiesel/marine diesel blends on the performance of a stationary diesel engine.Biomass and Bioenergy, 2003; 24(2):141–9.
[71]Choi CY, Bower GR, Reitz RD. Effects of bio-diesel
fuels and multiple injections on DI diesel engines. SAE paper no. 970218; 1997.
[72]Hunke AL, Barsic NJ. Performance and emission
characteristic of a naturally aspirated diesel engine with vegetable oils (Part-2). SAE Paper 810955;1981.
[73]Gerhard Vellguth. Performance of vegetable oils and