Suggested citation: Jones, R. N., Symons, J. and Young, C. K. (2015) Assessing the Economic Value of Green Infrastructure, Victoria Institute of Strategic Economic Studies, Victoria University, Melbourne.
Acknowledgements: We would like to thank Yvonne Lynch, Renee Walton, Michelle Gooding, David Callow, Kathryn Barlow, Rachel Hornsby, the staff at the Cities of Melbourne, Banyule, Kingston and Moonee Valley. We would also like to thank the Department of Environment, Land Water and Planning (Victoria) for their funding and support of this project. Cover photo: Melbourne Water.
ROGER JONES, JOHN SYMONS
ROGER JONES, JOHN SYMONS
ROGER JONES, JOHN SYMONS
ROGER JONES, JOHN SYMONS,,,, CELESTE YOUNG
CELESTE YOUNG
CELESTE YOUNG
CELESTE YOUNG
VICTORIA
INSTITUTE OF
STRATEGIC
ECONOMIC
STUDIES
A
SSESSING THE
E
CONOMIC
V
ALUE OF
G
REEN
I
NFRASTRUCTURE
:
G
REEN
P
APER
i Suggested citation: Jones, R. N., Symons, J. and Young, C. K. (2015) Assessing the Economic Value of Green Infrastructure: Green Paper. Climate Change Working Paper No. 24. Victoria Institute of Strategic Economic Studies, Victoria University, Melbourne.
Acknowledgements: This paper contributes to the project the project Assessing the Economic Value of Green Infrastructure. Yvonne Lynch, Renee Walton, Emily Boucher, Ian Shears, John Milkins, David Callow, Adrian Murphy, Michelle Gooding and Ben Johnston have been integral to the development of this project along with the support of many teams at City of Banyule, City of Kingston, City of Melbourne, City of Moonee Valley and the Victorian Department of Environment, Land Water and Planning. This project is supported by funding from the Government of Victoria.
Cover images: Melbourne Water.
© 2015 Victoria University and the Government of Victoria
ISBN: 978-1-86272-706-9
Victoria Institute of Strategic Economic Studies Victoria University
ii
Executive summary
This green paper discusses the economic aspects of valuing green infrastructure at the local
government scale. Supported by funding provided by the Government of Victoria, and led by the City of Melbourne, Victoria University is developing an economic framework for green infrastructure in collaboration with four local government bodies: the Cities of Banyule, Kingston, Melbourne and Moonee Valley.
Green infrastructure includes parks and reserves, backyards and gardens, waterways and wetlands, greenery on streets and transport corridors, pathways and greenways, squares and plazas, roof gardens and living walls, sports fields, and cemeteries.
The project aims to:
Produce an economic framework to value the benefits of green infrastructure in order to develop the business case for adapting now. As much as is feasible, the project will explore the multiple benefits of green infrastructure in order to develop an
understanding of potential returns on investment by adapting urban environments at the local government scale. The ultimate goal of the project is to put investment in green infrastructure at the local government level on a more even footing with investment in grey infrastructure.
This paper discusses the economic issues informing framework construction in covering the following topics:
• The nature of Greater Melbourne, emphasising the early establishment of green open space, parks and gardens and how that has defined the city’s character.
• The concept of green infrastructure is contrasted with conventional infrastructure, outlining similarities, differences and interactions.
• The concept of total economic value (TEV) associated with environmental good and services.
• The major differences between environmental and ecological economics and how they apply to green infrastructure.
• The methods and tools used to value the benefits of green infrastructure.
Conventional economics is not well suited to valuing green infrastructure because of its need to convert a diverse range of values into dollars. The economic literature and practice has many different views about how non-market values should be managed, some of which are suitable for valuing various aspects of green infrastructure. The findings in the paper contribute to a number of recommendations informing how a framework for valuing green infrastructure may be constructed.
The nature of Melbourne
iii Botanical Gardens and Observatory. By the late 19th century, the sell-off of public parks was
prevented by public protest, establishing a political legacy that survives to this day.
The outer urban areas were not so fortunate. Wetlands were drained and prized landscapes built over. Creeks were turned into cement drains to control flooding. This process is now being reversed as important areas are being reclaimed and rehabilitated. Research into urban ecology is providing the knowledge on how to deliver a wide range of values to the community. Ecosystem services are now being recognised as important for climate change adaptation, while urban green infrastructure in general is increasingly being seen as an important contributor to Melbourne’s liveability. The
integration of natural, Indigenous, European and multicultural heritage into a post-industrial future is still very rudimentary but progressing.
Summary of green infrastructure benefits
Green infrastructure (GI) benefits provided by ecosystem goods and services are divided into three main groups:
1. 1.1.
1. Economic benefitsEconomic benefitsEconomic benefitsEconomic benefits
Green infrastructure contributes to the economy via the direct supply of goods and services. The indirect benefits to the economy are many but hard to quantify. By improving amenity, GI can increase property values and improve consumer activity in some precincts. Ecosystem services also provide a ‘free service’ that can support other economic activities such as recreation, sport and tourism. In some cases, it may provide the basis for such activities (e.g., ecotourism).
2. 2.2.
2. Social benefitsSocial benefitsSocial benefitsSocial benefits
Social benefits are diverse and often hard to measure as many are indirect, such as community identity, amenity and equity. Health benefits include mental, physical and spiritual health. The provision of clean air and water, and places to walk and exercise provide the basis for improved community welfare. Green infrastructure can also help connect communities through social activities in public spaces.
3. 3.3.
3. Environmental benefitsEnvironmental benefitsEnvironmental benefitsEnvironmental benefits
Environmental benefits contribute directly to environmental protection or to improvements in environmental health that may indirectly contribute to social and economic benefits. Direct benefits include healthy ecosystems, healthy populations of flora and fauna, connectivity of different spaces, and structure that promotes and protects species diversity. The ecological resilience created by healthy ecosystems also supports the overall resilience of a place to environmental extremes.
Valuing green infrastructure
The total economic value (TEV) of the broader environment was originally developed because by only considering the dollar benefits of development, harm to people and the environment was being ignored, which led to investments that may not have been undertaken had the harmful effects been considered. In this capacity, TEV was used to negate potential harm. However, TEV is now being applied in a positive sense to provide new ecosystem services in areas where they are lacking or where additional services can improve human and environmental health and welfare.
iv rarely accounted for in cost-benefit analyses. The combination of very different values ranging from dollars to ethics under the umbrella of TEV disallows the calculation of a single total economic value. The TEV concept is therefore best for classifying and accounting for ecosystem services and
identifying the values they contribute to, but should not be used to add all those values into a single number. Comprehensive economic value is a better term because it can accommodate a variety of measures that are both quantitative and qualitative.
Environmental and ecological economics have important differences, especially regarding how they consider the weak and strong substitutability of ecosystem goods and services. Environmental economics considers that environmental and manufactured services are largely substitutable. That is, if an environmental service is removed, the economy can replace it; perhaps not one to one, but in an economically feasible way. It also takes the lead from orthodox economics in calculating marginal change in human utility as the primary measure of benefit. This assumes that people want things but don’t care where they come from and are comfortable substituting one need for another.
Ecological economics looks at the total value of an asset and what it produces, including intangibles. It assumes that human needs cannot be collapsed into a single measure of utility, taking a much more philosophical approach to value. It does so by combining science and economics. Science plays a key role in identifying levels of substitutability, critical thresholds, biodiversity values and ecological health. The loss of a significant ecosystem, or a species, is considered to have an ethical importance on a par with the human right to existence. Qualitative to quantitative methods are used to value various aspects of green infrastructure, depending on the weighting between utility (material goods and services) and intangible, especially intrinsic, value.
These values are exercised on three levels, each requiring different methods of valuation:
• At the individual level, expanded cost-benefit analysis can be used to assess benefits in market and market-like situations. This can include willingness to pay, willingness to avoid loss and benefit transfer methods if used where suitable.
• At the community level, community and intrinsic values are best assessed using deliberative democracy-type approaches rather than adapting methods suited to market analysis.
• At the institutional level, formal and informal rules direct local government and set the framework for how valuation is carried out and applied.
Aggregating goods and services
Goods and services are exclusive if they are personal and consumptive, and non-exclusive if shared and non-consumptive. Exclusive goods can be used or consumed by one person, whereas air and views are non-exclusive because they are shared. All four combinations of public/private and consumptive/consumptive are possible. Many of the goods and services provided by GI are non-exclusive, but may be limited because only a certain number of people can enjoy them before they become over-exploited.
v Demand for social benefits can be allocated to individuals or to the community depending on context. Conventional economic approaches aggregate individual preferences and apply those to cost-benefit methods. Community values are shared preferences, considered to be different to the sum of individual preferences. They are based on relationships that include trust, reciprocity and shared values, and are mostly intangible. Tools for estimating community values are not well developed and often there is no single or correct answer. Ethical considerations of fairness and justice are also important. This project is treating individual and community benefits separately. Care must be taken to avoid double counting, so the test used to distinguish these different types of benefit is whether a group that benefits from a good or service could be any group of individuals or whether that benefit is unique to a community.
Asset valuation
Classes, subclasses and types of green infrastructure can be based on those developed for local government for conventional infrastructure by adapting them to account for the different types of green infrastructure. Assets can also be linked to the delivery of goods and services by using an asset valuation and maintenance program that addresses infrastructure development, maintenance, upkeep and replacement. These are linked to specific service levels. By adopting life cycle investment, an asset management program can focus on sustainable service delivery.
Valuing green growth
The main differences between green infrastructure and conventional infrastructure are:
• The high proportion of intrinsic value to total value.
• A large contribution to social and environmental values rather than conventional economic values.
• The relatively low substitutability of some assets.
• The biological aspect of growing assets, goods and services.
• Its long-lived nature and maintenance of value over long time periods.
Discounting is used to ask two main questions:
• What is the value of doing this now as compared to later? and
• Which of the options on the table provides the best return over time?
Discounting does two main things:
1. It takes the basic human preference for having something now compared to later.
2. It allows for the present value of future returns to be contrasted with the up-front investment costs and upkeep.
The results calculate net present value of an up-front investment with the flow of returns over time, discounted by a percentage for each unit of time, usually a year. Benefits can be expressed as dollars, from an ethical perspective, or a combination of both. The social discount rate is the rate applied to public investment expected to produce some form of social return.
vi park. We recommend that long-term investments in green infrastructure that are expected to provide long-term social and environmental returns should use the UK Green Book social discount rates as a base case. There is a case for green infrastructure with few co-benefits that replaces conventional infrastructure to use the higher social discount rates associated with costing conventional
infrastructure.
Conclusion
A framework for green infrastructure at the local government scale that aims to build resilience to climate change will need to promote the following attributes:
1. Resilience
• Green infrastructure needs to be resilient. Because the urban form tends to accentuate climatic extremes, green infrastructure needs to be resilient to extremes of hot and cold, wet and dry, and rapidly changing conditions.
• By lessening these extremes, GI will provide resilience for the surrounding built infrastructure, reducing damages and wear where possible.
• GI can confer resilience on the community and business by providing places where people meet and interact, increasing physical and social connectivity, and strengthening community bonds and values.
• The economic framework itself needs be adaptable in order to manage the different types of projects and contexts in which green infrastructure will be planned and implemented. 2. Risk reduction
• Climate impact risk reduction contributes to resilience, but is purposely designed to provide specific services that lessen the physical, emotional and financial cost of damaging events.
• Key risks identified in the urban environment are flash flooding, coastal flooding, drought, extreme heat, and windy and exposed environments. GI can be designed to reduce the impact of all these risks and/or to speed recovery from damage and loss.
3. Liveability
• Urban environments are not always comfortable places. Grey infrastructure is built to be resistant, and buildings are often constructed with a carefully thought out interior designed for comfort but not so much the exterior. GI can be sued to soften these effects.
• Improved walkability through provision of shelter.
• General urban cooling in summer, reduce exposure in winter (if well designed).
• Services that support individual and community health and wellbeing.
• Spaces for gatherings, meetings and outings.
Three levels of benefit need to be built into the framework, namely: 1. Individual – benefits that contribute to personal welfare. 2. Community – benefits that accrue to community welfare. 3. Institutional – benefits that fulfil institutional goals and values.
The following principles based on both science and economics will be applied in developing the framework. They are as follows:
vii upstream values in terms of environmental processes. Other benefits may be private or contribute to policies of other government bodies.
• The conservation of mass, function and character is assumed in that economic demand cannot produce goods and services that are unavailable due to physical or institutional restrictions. Irreplaceable aspects of GI need to be identified (within human timelines rather than evolutionary).
• Many ecosystem goods and services produced by GI need to be quantified on a scientific basis to ensure values are adequately represented.
• Monetary values should only be attributed to goods and services that have a market value, have a clear shadow price value or are accepted as standard practice in the area of operation. Further research will be required to develop areas of value that do not meet these criteria.
The conclusions of this green paper will be combined with two other pieces of work: a review of the ecosystem services literature (Symons et al., 2015), the source of the ecosystem services listed in Appendix A and learnings from a set of workshops that explored the decision-making processes surrounding green infrastructure and grey infrastructure in local government (Young et al., 2014a; Young et al., 2014b).
viii
Contents
Executive summary ... ii
The nature of Melbourne ... ii
Summary of green infrastructure benefits... iii
Valuing green infrastructure ... iii
Aggregating goods and services ... iv
Asset valuation... v
Valuing green growth ... v
Conclusion ... vi
1. Introduction ... 1
Background to the project ... 1
Key concepts ... 2
General approach ... 3
2. What is green infrastructure? ... 5
The changing nature of green infrastructure in the Melbourne Region ... 5
Green infrastructure in urban settings ... 9
3. Valuing green infrastructure ... 12
Ecosystem services and total economic value ... 13
Summary of ecosystem goods and services ... 16
Environmental accounts and urban green infrastructure ... 18
Economic evaluation methods – a brief history ... 20
Current status and potential approaches to valuing GI benefits ... 23
4. Economic considerations ... 27
Scientific vs economic models ... 27
Aggregating the collective values of GI ... 28
Valuing assets ... 30
Assessing benefits and social returns ... 33
Valuing green growth ... 35
Social discounting and rates of time preference ... 37
Application of social discount rates ... 40
5. Current methods and tools ... 43
Valuation methods ... 43
Cost and benefit methodologies ... 43
Other costing and evaluation methods ... 45
Valuation tools ... 47
ix
6. Towards a framework ... 50
Conclusion ... 51
Appendix 1 ... 52
1
1.
Introduction
Background to the project
Cities are complex, dynamic systems that depend on the resilience of their people, economies and natural environments to sustain liveable conditions under ongoing change. Such resilience is strongly influenced by the physical and social infrastructure of a city’s location and is a product of its cultural, economic and governance history. Green infrastructure (GI) is increasingly being recognised as a key aspect of the total infrastructure that supports urban liveability, in part by providing resilience to climate extremes (Hamin and Gurran, 2009; Kazmierczak and Carter, 2010; Foster et al., 2011).
Infrastructure is the basic physical and organizational structures and facilities built to service society. Green infrastructure is where nature plays a role in augmenting those services and provides some of its own, such as clean air and water. By absorbing environmental stressors, GI can reduce the impacts of climate extremes such as flooding and heat waves. Communities who successfully maintain these assets are more likely to be resilient and able to adapt more effectively to future shocks and changes (Foster et al., 2011; Lovell and Taylor, 2013). While conventional or grey infrastructure offers
protection from some risks, it may exacerbate others. In many cases, green infrastructure can provide multiple positive benefits, often at lower cost as well as reducing some risks (Tzoulas et al., 2007).
In economic terms, liveability roughly equates how a particular place contributes to the social welfare of people and communities. Measures of liveability extend beyond the conventional economy including social and environmental values (Woolcock, 2009; Namazi-Rad et al., 2012; Ruth and Franklin, 2014). Human welfare extends beyond income, because it takes in the quality of life enjoyed by individuals and communities. This comprises the social economy. Liveability also takes in the environment, including the natural environment. Environmental values at the planetary scale encompass global society and the total global economy. These values are attached to the biophysical processes that maintain the global biosphere in a habitable condition. Environmental values are also important in cities (Newman and Jennings, 2012). These values largely contribute to the welfare of the urban community, although a city’s environmental services will contribute to broader regional and global processes in a small way.
To date, planning for green infrastructure within Melbourne’s local government areas (LGAs) has largely been opportunistic, taking advantage of funding opportunities, rather than being a strategically managed portfolio sustained by ongoing funding (Young et al., 2014b). Green infrastructure is not well integrated with other types of infrastructure, and the tools and methods required to do this are largely undeveloped. Decision makers find it difficult to properly evaluate the type of investment needed, why it is needed and how it is needed. As a result, green infrastructure is viewed as a peripheral aspect of infrastructure planning, so is often underutilised and undervalued. This has meant that opportunities to improve these assets or maximise their benefits have been not been taken up (Young et al., 2014a; Young et al., 2014b).
2 The aims of the project are as follows:
This project will produce an economic framework to value the benefits of green infrastructure in order to develop the business case for adapting now. As much as is feasible, the project will explore the multiple benefits of green infrastructure in order to develop an understanding of potential returns on investment by adapting urban environments at the local government scale. The ultimate goal of the project is to put investment in green infrastructure at the local government level on a more even footing with investment in grey infrastructure.
This green paper aims to provide a platform for discussing how these aims may be achieved. It expands and discusses themes introduced in an earlier concept paper compiled for an introductory workshop (Young et al., 2014a) and expanded upon in the workshop report (Young et al., 2014b). The paper also draws from a review of the ecosystem services literature conducted for the project, where a comprehensive list of ecosystem services and valuation tools provided by green infrastructure has been compiled and reviewed (Symons et al., 2015).
Chapter 2 introduces the concept of green infrastructure and contrasts GI with conventional infrastructure, outlining similarities, differences and interactions. Chapter 3 discusses the concept of Total Economic Value (TEV) associated with environmental goods and services. It also discusses the economic underpinnings of urban green infrastructure, especially ecological economics. Chapter 4 addresses a range of economic concepts, and the methods and tools used to apply these concepts. Chapter 5 addresses the current state of play with respect to urban green infrastructure as developed by the project to date. Chapter 6 outlines a proposed framework to be developed to address the aims of the project.
Issues discussed in this green paper, include:
• The place of green infrastructure in broader infrastructure settings
• Applying Total Economic Value (TEV) to ecosystem services
• The relationship between TEV and asset values
• Progress in environmental accounting, especially in Australia
• Exploring intangible and community values
• Discounting and rates of time preference
• Current methods and tools in use
• Broad description of current systems in use at the LGA level including finance, asset management and project systems
• The structure of a potential economic framework
Key concepts
The central economic question guiding this paper is how can multiple values associated with green infrastructure be assessed within an economic framework that can be applied in practice by local government?
3 decision making in a way that accounts for incommensurability between different values. Two values are incommensurable if they cannot be measured using a single metric (e.g., dollars). Simply put, your grandmother is not for sale and nor should she be, nor is your granddaughter’s future. No single method will address all the needs required to assess the economic, social and environmental benefits that a GI project or program can produce. A heterodox (beyond the mainstream) approach will apply a range of methods, some of which are non-monetary.
The institutional arrangements for local government project planning and management, and asset management, also need to be incorporated into the final economic framework. Integrating into current practices requires a very pragmatic approach to how economics can be applied.
General approach
A criticism of orthodox economic approaches is that they often overlook community-based values and shared assets (the ‘commons’) (Hardin, 1968), limiting their assessment to direct profit and loss. This was the primary motivator for developing the concept of total economic value in the 1970s and 1980s (see Chapter 3). Driven by the view that the full costs of any project should be assessed, direct and indirect losses to the environment were assessed to quantify the negative environmental and social impacts of development and balanced projected gains. Later, attention moved to assessing the potential for sustained social and environmental benefits when restoring or rehabilitating green infrastructure. This contributed to the rise of environmental economics and later, ecological economics.
The largest difference between green and grey infrastructure is its complexity and the number of services it can provide. Grey infrastructure has traditionally been single purpose. Roads are for motor vehicles, pipes are for transporting liquids and tracks are for trains. Green infrastructure is, by its nature, multipurpose. Rather than being built for single-use efficiency, it is complex, networked, full of redundancies and structurally complex. This provides the basis for the many benefits it offers,
consisting of a limited number of core benefits a range of additional co-benefits. Building on this, conventional infrastructure is now being designed according to ecological principles, applying ecomimicry (Korhonen, 2004).
When applying ecological economics to a project or area, the problem is not too little choice of methods but too much. Assessments can apply a wide range of philosophical, normative and analytic alternatives. Context and framing issues are both very important. Selecting methods that are fit for purpose, especially those that accurately reflect the values they are meant to represent, is difficult. As a result, the literature does not achieve a consensus on how the total economic value of green infrastructure can be assessed, only that it should be.
The task of this green paper is to chart a course between the following considerations: 1. What is the current state of preparedness for assessing the business case for general
4 2. Negotiating the assumptions inherent in neoclassical economics and the needs of green
infrastructure, accounting for non-monetary or ‘intangible’ values, social returns and intergenerational equity.
3. Distinguishing between personal, community and institutional values, the latter allocated through regulatory and legal frameworks. This will inform the distribution of benefits. 4. Considering asset valuation from a green infrastructure perspective, especially by accounting
for biological growth.
5
2.
What is green infrastructure?
Green infrastructure has no generally agreed definition, however, most definitions have a common theme relating to green and blue spaces in the urban setting. Naumann et al. (2011) provide the following:
“Green Infrastructure is the network of natural and semi-natural areas, features and green spaces in rural and urban, and terrestrial, freshwater, coastal and marine areas, which together enhance ecosystem health and resilience, contribute to biodiversity conservation and benefit human populations through the maintenance and enhancement of ecosystem services. Green Infrastructure can be strengthened through strategic and co-ordinated initiatives that focus on maintaining, restoring, improving and connecting existing areas and features, as well as creating new areas and features.” (Naumann et al., 2011, p. 1)
Green infrastructure includes parks and reserves, backyards and gardens, waterways and wetlands, greenery on streets and transport corridors, pathways and greenways, squares and plazas, roof gardens and living walls, sports fields and cemeteries. Note that this definition is different to that in the conventional green growth literature, where it is any infrastructure with a purposefully
environmental content (e.g., Hammer et al., 2011).
With reference to the Melbourne region, green infrastructure includes the following:
1. Indigenous flora, fauna and landscape, which may be in various states of health from fairly intact through to almost 100% exotic.
2. Developed open spaces covering parks and gardens including sports fields and golf courses, roadside verges and nature strips.
3. Waste land or unallocated sites where vegetation provides some ecosystem services but is essentially unmanaged.
4. Water-sensitive urban design incorporating natural and artificial components.
5. Vegetation integrated into the built environment, which includes street trees, green roofs and walls.
6. Agricultural and horticultural land, where the primary activity is commercial.
The changing nature of green infrastructure in the Melbourne Region
One important context for any assessment of green infrastructure in the Melbourne Region is to consider its historical context and how that has been influenced by its natural, human and economic history.
Geographically, Melbourne acts as a meeting place for the following five historical aspects. 1. GeologicalGeological – most of the state’s major geological formations find their expression in the GeologicalGeological
Melbourne Region. Axes (longstanding tectonic ridges surviving hundreds of millions of years) to the east and west have provided borders for the Port Phillip Sunklands, which provide the peninsulas and bays (Abele, 1988). This provides the context for the regional geomorphology – the landforms on which the city is situated.
6 occupation, the entire region was very strongly influenced by Aboriginal fire management practices, giving the area a classic ‘park-like’ aspect (Austin, 1974; Presland, 2010). This landscape undoubtedly influenced the early surveyors drawing up plans for the urban landscape.
3. ClimaticClimatic – the Greater Melbourne Region is influenced mainly by westerly weather systems. ClimaticClimatic Its position between the coast and the Great Dividing Range often produces orographic uplift, intensifying weather systems. The boundary between the coast and land, and hills inland can cause rainclouds to rise rapidly, making rainstorms more intense. Its position in the south-east corner of the continent means that blocking highs in the Tasman Sea can produce prolonged heat waves with hot-dry northerly winds coming from inland. South-east lows from eastern Bass Strait can also produce storms and are a major source of Melbourne’s water, feeding the Yarra and Thomson catchments. Finally, the circular shape of Port Phillip Bay and the surrounding hills can contribute to the occasional formation of low pressure systems that can circulate bringing prolonged and heavy rains. These diverse influences, contribute to Melbourne’s changeable weather (Murphy and Timbal, 2008; Pearce et al., 2011). 4. CulturalCultural – histories of the Kulin nations around Melbourne (the Wurundjeri, Bunurong and CulturalCultural
Wathaurong peoples) suggest that gatherings in the Port Phillip region were commonplace and involved groups from across the state (Presland, 2010). The vegetation at the time of European occupation was greatly influenced by human burning patterns, giving the region its park-like, and to the Europeans, pleasing appearance (Austin, 1974). Economically, the site of Melbourne on the lower Yarra was attractive to Europeans because of the presence of a deep-water harbour, grazing lands, freshwater, timber and good soil.
5. EconomicEconomic – Melbourne achieved its initial wealth from the wool trade, but this was EconomicEconomic transformed by the discovery of gold in 1851. This led to a boom in wealth and investment that allowed the city to be magnanimous in its planning. Later wealth came through the wool boom, and despite periodic economic crashes, Melbourne has continued to develop and grow. It continues to be the hub for people and goods’ feed by a radial transport network. The Port of Melbourne ensures that the region is a hub for trade to and from the remainder of the state.
Geology, soils and climate merge to form biogeographic zones that shape much of a region’s natural legacy. The Port Phillip Bay – Westernport and Greater Melbourne Region is a meeting place of some of Victoria’s major biogeographic zones. Vegetation communities from the Great Dividing Range and its foothills, the basalt plains, coastal hills and dunes, saline and fresh wetlands, and even mallee vegetation intersect over the area where the city now stands.
These zones are defined by their dominant geology and soils (Society for Growing Australian Plants Maroondah, 1993):
• SiluroSiluro----Devonian sedimentsSiluroSiluroDevonian sedimentsDevonian sedimentsDevonian sediments – mallee and box-ironbark forest, dry and wet sclerophyll forests through to rainforest in the upper catchment;
• Tertiary SandsTertiary Sands – heathy woodlands to heathlands; Tertiary SandsTertiary Sands
• Basalt PlainsBasalt Plains – grassland and grassy woodlands; Basalt PlainsBasalt Plains
• Coastal FringeCoastal Fringe – coastal heathlands, wetlands and dune vegetation; and Coastal FringeCoastal Fringe
7 catchment). Similar sediments occur in the upper and lower Yarra catchment, but the climate, soils and fire regimes are different, grading from grassy woodlands in the drier western sub-catchments to mountain ash forests with fern gullies in the east. Major water-dependent communities fringe the bay, including salt marshes, estuaries and freshwater wetlands.
A radial system of rivers also drain into Port Phillip Bay – the Yarra and Maribyrnong from the east and north, joining close to Hobson’s Bay (the Yarra originally flowing into the Maribyrnong) and the Werribee River from the west. A series of smaller creeks also conforms to this radial pattern. Later development of railways and roads has accentuated these patterns.
These systems greatly influenced Melbourne’s early settlement patterns. The hills east and west of the Yarra with a pleasing aspect, views of the river and raw materials for housing, became the first settlements and remain the highest value lands within the Melbourne Region. Lower flood-prone lands were turned over to industry and cheap housing, with settlement expanding south and east into the more treed and wetter parts of Melbourne, avoiding the flatter, drier and hotter grassy areas of the west with their inhospitable soils, although areas east of the river were reserved (the botanical gardens and Albert Park) or drained and built on.
A critical part of early Melbourne’s planning was the meticulous survey and planning conducted by Russell and Hoddle, which included wide streets and generous parklands fringing the city. Significant boulevards, especially St Kilda Road and Royal Parade were later laid out and incorporated into the development of Melbourne’s inner suburbs. The influence of the Colony of Victoria’s first governor, Lieutenant-Governor La Trobe cannot be overplayed – he directed the layout of many of Melbourne’s parks, preventing their action in land sales and reserving areas for the botanic and zoological gardens and Melbourne University. Turner (1904) writes that when a few hundred acres of Albert and Fawkner parks were later sold off by a colony treasurer, the public outcry was so great it could not happen again.
The park system and water system are the two greatest legacies of green infrastructure at the city-wide scale. Wong (2006) has written extensively on the legacy of Melbourne as a water-based city, identifying six stages of development (Wong 2006; Mekala et al., 2014).
1. A water supply city during the mid to late 1800s, first by securing Yan Yean Reservoir in the 1850s, then moving to the Upper Yarra catchment. The focus was on securing a stable, clean water supply in a variable climate with a rapidly growing population, influenced and financed by the gold rush.
2. A sewered city prompted by public health concerns (mainly typhoid and diphtheria epidemics), developing separate sewerage schemes between the 1880s and 1920s, and opening up the Western Treatment Plant.
3. A drained city with well-established drainage and flood protection systems in the 1920 – 1930s, prompted by a history of large floods in the Yarra River, culminating in a devastating flood in 1934. This saw many waterways straightened and some turned into concrete drains to hasten the passage of stormwater to the sea.
4. A waterway city with a strong emphasis on stormwater pollution management in the 1970s, seeing the first public campaigns to clean up the Yarra.
5. A water cycle city with active promotion of fit-for-purpose water use in the 1990s, with the development of recycling and re-use systems, especially in new developments.
8 These developments have been prompted by actions from all levels of civil society. Today, these range from the national Water Reform Process to the activities of local friends groups, and include state and local government and water corporations. A considerable part of Melbourne’s legacy as a water-sensitive city is the reservation of Melbourne’s upper catchments for water supply in the late 19th and early 20th century. The provision of high-quality drinking water from forested catchments has meant that A-class water has been used for a wide range of purposes when lower water quality water would do. Integrated urban water management is much more focused on developing a fit-for-purpose water supply, making the urban water cycle a crucial part of green infrastructure.
Less well described are the stages of development influencing green infrastructure in the Greater Melbourne Region. These can be summarised under the following themes:
1. Fire stick farming – the extended human history of the Melbourne Region as managed by the peoples of the Kulin Nation shaped the distribution of plants and animals in the landscape, maintaining grasslands in a floristically rich state providing goods such as tubers and seeds and services such as attractive grazing lands (Gott, 1983, 2005; Presland, 2008, 2010). 2. Grazing and clearing – the introduction of sheep saw an immediate change to the region.
20,000 sheep were landed in the first six months and numbers rapidly grew. By 1841, there was a shortage of feed due to the severe drought of 1837–41 and stocking rates (Jones, 1999). Meanwhile around the city, trees and wattles were being cleared for housing and use in tanning (Billot, 1979).
3. Grand parks and gardens – the Hoddle and La Trobe legacy saw the development of a series of large parks and avenues that became embedded into the heritage of Melbourne (Billot, 1979). In the main, this saw the Europeanisation of Melbourne’s flora except in areas such as Studley and Royal Parks (Brown-May and Swain, 2005). Science was seen as an important civilising influence so botanical and zoological gardens were established at this stage along with observatories and museums (Griffiths, 1996).
4. Harvesting, growth and development – further development of the urban region, collection of raw materials and drainage of swampy areas continued throughout the 19th and into the 20th century (Presland, 2014). Wild food was a key part of Melbourne’s diet (fish, waterfowl, and later, rabbit) and farmland was developed on the better soils in the Melbourne region to feed the growing city. The Heidelberg School of artists encourage a love of the bush, field
naturalist clubs thrived and nature studies became a key part of the school curriculum by the early decades of the 20th century. There was generally, however, a clear divide between the bush and the city.
5. Suburbanisation – the period after World War Two saw a long period of expansion beyond what are now the inner suburbs as the city grew south and east during a prolonged period of economic growth. Different waves of immigrants brought their own cultural notions of green infrastructure from Europe and later, Asia (Broome, 1984). Bush was cleared, and farmlands, vegetable gardens and orchards built over, except in designated green wedges, declared in the early 1970s.
6. First wave of native revegetation – the wave of environmental consciousness following the 1960s saw an Australianisation of the landscape, with many Australian as opposed to exotic species planted. However, species were largely imported from other regions of Australia as was the earlier pattern with exotic plants.
9 programs. The awareness of the role of indigenous people in the landscape has strengthened over the same time period but overall has received less prominence (de Jong, 2004; Pocock and Jones, 2013).
8. Integrated green infrastructure – the current phase, which is underway in its early stages, is developing a range of strategies that aims to bring together the different traditions involved in urban green space and seeks to integrate these with other forms of infrastructure (Newman and Jennings, 2012). For example, these different traditions include formal gardens, scientific and cultural parks such as botanical gardens, recreational areas, vacant land largely populated by invasive plants, areas with remnant ecosystems and high quality ecosystems in reserves. It is also seeking to combine green infrastructure with other forms, such as rain gardens, green roofs and walls and recreation in high conservation areas.
These stages of the water city and the natural city have affected different parts of the urban region in different ways. Therefore, any given local government area will exhibit its own particular patterns of green infrastructure. However, these patterns can also be grouped, giving a guide to the status of green infrastructure today and how it can be developed in future.
The current state of green infrastructure and how it is seen by a community has many histories – natural, cultural, political and economic. These histories need to be understood in order to blend the heritage element of green infrastructure with its future.
Recommendation 1 Recommendation 1Recommendation 1 Recommendation 1
The framework needs to support heritage values, including natural and cultural heritage. It also needs to support long-term time frames and visioning in its use.
Green infrastructure in urban settings
The four city councils involved in the project: Melbourne, Banyule, Kingston and Moonee Valley, occupy the centre, inner north-west, north-east and south-east of Melbourne (Figure 1).
The environments we are dealing with in this project are summarised as follows:
Banyule City Banyule CityBanyule City
Banyule City: Banyule ranges all the way from the inner suburbs north of the Yarra, to areas that were only developed in the 1970s. Most of the region covers the Siluro-Devonian complex of rolling hills with box iron-bark vegetation, riparian vegetation along the rivers and creeks, and a small area of basalt country to the east. Green infrastructure includes the middle Yarra and its parks and wetlands, Darebin Creek to the west, the lower Plenty River and significant urban box-ironbark and grassy woodlands.
10
Figure 1. Local government areas involved in the project (source City of Melbourne).
City of Kingston City of KingstonCity of Kingston
City of Kingston: Kingston takes in the Tertiary Sands Coastal Fringe bioregions of Melbourne,
occupying the green wedge in the Keysborough – Carrum zone and part of the former Carrum Carrum Wetlands in the Edithvale Wetlands, an international Ramsar site. It contains several regional parks managed by Parks Victoria and manages a significant length of coastal cliffs, beaches and source-bordering dunes. Mordialloc and Dandenong Creeks are the two most significant water ways.
The city has some older middle suburbs and was formerly a beach holiday location for Melbourne, but has been infilling progressively since WWII. The amount and scale of development has increased significantly around the six Activity Centres in Kingston. In the less developed areas, after years of sand quarrying and landfilling, large parts of the Kingston Green Wedge are finally transitioning out of the waste industry and are proposed to be green parks and/or electricity generation sites such as solar parks. Its main climate-related risks are storm surge and overland flooding.
City of Melbourne City of MelbourneCity of Melbourne
City of Melbourne: Situated on the Yarra, Melbourne contains all of the biogeographic zones
nominated in the previous section except for the coastal fringe. However, very little remains of those except for the underlying geology, as almost all of the original vegetation has been replaced or built over. Limited fauna persists although a recent Bioblitz collected over 3,000 records of plants, animal and fungi that are still being assessed.
11 and historical values are very high. The recent return of population to inner Melbourne means that the demand and potential use of green infrastructure is rising.
City of City of City of
City of Moonee ValleyMoonee ValleyMoonee ValleyMoonee Valley: Moonee Valley takes in part of the catchments of the Moonee Ponds Creek and Maribyrnong River, and is comprised mostly of the basalt plains and Siluro-Devonian bioregions with some riparian vegetation. There are limited remnant ecosystems in the area dominated by grassland, grassy woodland and riparian vegetation, but these total less than 100 hectares. Where reasonably intact, these have a high conservation value.
The inner urban part of the city contains some traditional 19th century parkland, but most of the city’s green infrastructure has been highly modified including the Moonee Ponds Creek, which is concrete lined in its lower reaches. Major open space includes Essendon Airport, riverside parks and
12
3.
Valuing green infrastructure
Green infrastructure emerged as a concept in the 1990s as planners began to consider the organised provision of ecosystem goods and services in the urban context. They noted that urban forests and rivers and streams provide ecosystem goods and services in a similar way to the way that transport and energy systems offer access and power (Teaford, 1987; Walmsley, 1995). This development drew from emerging research themes such as industrial ecology and the city as an ecosystem, but the main inspiration was the development of ecosystem goods and services (Gill et al., 2007; Tzoulas et al., 2007). The term green infrastructure is often used because of its similarity to conventional
infrastructure, which is generally seen by federal and state governments as good for the economy and not a drain on resources. However, this is not necessarily the case for local government, who face a significant shortfall between revenue and limited revenue raising powers and demand on
infrastructure renewal (Victorian Auditor-General, 2014).
Ecosystem or environmental goods and services are the direct and indirect services provided by any aspect of green infrastructure. These include both use and non-use values (Fromm, 2000). The infrastructure that provides them has been termed natural assets or natural capital. Comprehensive reviews of the history of ecosystem services are provided by Fromm (2000), Fisher et al. (2009), Gómez-Baggethun et al. (2010) and Lele et al. (2013). The valuation of natural assets from the perspective of infrastructure provision is not very well developed, although there is a literature valuing natural assets based on their provision of goods and services (Costanza et al., 1997a; de Groot et al., 2012; Costanza et al., 2014).
The concept of total economic value (TEV) was applied to environmental goods and services during the 1970s and 80s because conventional economic approaches were considered to be partially costing resource projects. The missing values were mostly linked to human welfare from pollution or resource over-utilisation (Mastenbroek and Nijkamp, 1976). Early examples were for pollution (Anderson et al., 1977), fisheries (Randall, 1987) and wildlife (King, 1948), the earliest locatable reference online. TEV became formalised in environmental and ecological economics in the 1990s (Pearce et al., 1989; Tietenberg, 1992), culminating in the Millennium Ecosystem Assessment (Millennium Ecosystem Assessment, 2003) and The Economics of the Environment and Biodiversity (TEEB, 2011, 2012).
Three main approaches to green infrastructure have been identified in the literature review undertaken for the project (Symons et al., 2014):
1) Ecosystem Ecosystem goods and Ecosystem Ecosystem goods and goods and goods and services approachservices approachservices approach. This approach emphasises the services that nature services approach and natural cycles provide to society (Ehrlich and Mooney, 1983; Mooney and Ehrlich, 1997; Millennium Ecosystem Assessment, 2003; Costanza et al., 2014). These natural cycles occur over the entire planet (e.g., the carbon cycle), however, they can be restored and maintained within urban settings to provide benefits in that setting.
2) GGreen spaces GGreen spaces reen spaces reen spaces nnetwork nnetwork etwork etwork approachapproachapproach. This perspective highlights the importance of retaining and approach linking green spaces and nature corridors in cities to improve the functioning of ecosystems. This perspective mimics traditional infrastructure approaches in that it provides a network for the functioning of a city (Benedict and McMahon, 2002).
13 which can provide ecosystem services such as cooling through the installation of green roofs and living walls (Margolis and Robinson, 2007).
We will utilise each of these approaches to some degree. For the ecosystem services approach we identify goods and services and attach economic values if they are known. The green spaces approach is used to identify physical assets within a particular area, looking at networks and connectivity. The green engineering approach is used to match ‘like with like’, where similar functions between different types of infrastructure are contrasted. The latter principle is also applied to asset valuation.
Ecosystem services and total economic value
With respect to TEV, practical and philosophical questions ask whether all ecosystem goods and services can, or should, be given a monetary value. Can all, or only some values be quantified, and can they all be quantified in the same way?
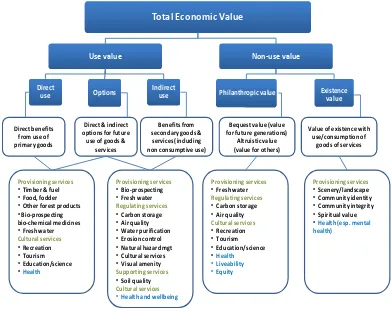
Figure 2 shows the TEV, largely as adopted by TEEB and applied in the European Commission research project Natura (ten Brink et al., 2011) and adapted to increase the importance of health by Young et al. (2014a). It consists of use and non-use values broken down into direct and indirect, options and bequest (quasi-options) and existence values. Their meanings are briefly described in Table 1.
Total Economic Value
Use value Non-use value
Direct use
Indirect use
Options Philanthropic value Existence value
Direct benefits from use of primary goods
Direct & indirect options for future
use of goods & services
Benefits from secondary goods & services (including non consumptive use)
Bequest value (value for future generations) Altruistic value (value for others)
Value of existence with use/consumption of
goods of services
Provisioning services
•Timber & fuel
•Food, fodder
•Other forest products
•Bio-prospecting bio-chemical medicines
•Fresh water
Cultural services •Recreation •Tourism •Education/science •Health Provisioning services •Bio-prospecting
•Fresh water
Regulating services
•Carbon storage
•Air quality
•Water purification
•Erosion control
•Natural hazard mgt
•Cultural services
•Visual amenity
Supporting services
•Soil quality
Cultural services •Health and wellbeing
Provisioning services
•Fresh water
Regulating services
•Carbon storage
•Air quality
Cultural services •Recreation •Tourism •Education/science •Health •Liveability •Equity Provisioning services •Scenery/landscape
•Community identity
•Community integrity
•Spiritual value
•Health (esp. mental health)
Figure 2. Total Economic Value system with health and wellbeing additions – adapted from ten Brink et al. (2011) and Young et al. (2014a).
14 their own sake or own right (Zimmerman, 2010). This has been transferred to the idea of intrinsic values in nature, where nature is valued in its own right independently of the direct benefits it may provide to people (Eckersley, 1992; Callicott, 1995). Note that these definitions differ from the idea of intrinsic value in economics and finance, which is the expected future value of a stock, good or production unit (e.g., Lee et al., 1999). Total economic value is a very useful concept for tallying up all the potential benefits of a project or precinct.
Table 1. Meanings of the word ‘value’ as used in ecological economics. Adapted from Callicott (1984), Gilpin (2000) and Kumar and Kumar (2008).
Type of value Type of valueType of value
Type of value Meaning Meaning Meaning Meaning
Economic value Economic valueEconomic value
Economic value The worth of a good or service, or the measure of benefit provided by that good
or service. Economic value is not just monetary, and there are many definitions across different economic traditions, from financial to philosophical.
Market value Market valueMarket value
Market value The exchange value or price of a commodity or service in the open market.
Sometimes also synonymous with economic valueeconomic valueeconomic valueeconomic value in neoclassical economics.
Use value Use valueUse value
Use value The equivalent value of a good or service that is not paid or partially paid for,
translated into market-equivalent value.
Intrinsic IntrinsicIntrinsic
Intrinsic valuevaluevaluevalue The value attached to the environment and life forms for their own sake
irrespective of any reference to humans.
Existence Existence Existence
Existence valuevaluevaluevalue The value attached to the knowledge that species, natural environments and
other ecosystem services exist, even if the individual does not contemplate ever making active use of them.
Bequest/vicarious values Bequest/vicarious valuesBequest/vicarious values
Bequest/vicarious values A willingness to pay to preserve the environment for the benefit of other people,
intra- and inter-generationally.
Present value Present valuePresent value
Present value The value today of a future asset, discounted to present day values (e.g., today’s
dollar value).
Option value Option valueOption value
Option value A willingness to pay a certain sum today for the future use of an asset.
Quasi QuasiQuasi
Quasi----option valueoption valueoption value option value The value of preserving options for future use assuming an expectation of increasing knowledge about the functioning of the natural environment.
Anthropocentric value Anthropocentric valueAnthropocentric value
Anthropocentric value Confers intrinsic value on humans alone and instrumental values on everything
else.
Non NonNon
Non----anthropocentric anthropocentric anthropocentric anthropocentric value
valuevalue value
Intrinsic value is attributed to human and non-human beings, and perhaps natural systems.
Tangible value Tangible valueTangible value
Tangible value The monetary or market values of a good, service or asset.
Intangible value Intangible valueIntangible value
Intangible value Non-monetary goods, services, assets and intrinsic values.
Community value Community valueCommunity value
Community value A value shared by or benefiting a group of people who constitute a community
through place, activity, or shared aspirations and goals.
Institutional value Institutional valueInstitutional value
15 One aspect where use and non-use values do not map easily onto intrinsic and instrumental values is with the notion of acquired or inherited value, where the ‘goodness’, rarity, desirability or fame of an object provides it with values greater than like objects. For example, a heritage-listed tree is more valuable than a common street tree. Acquired value is a difficult concept to map across the divide between intrinsic and instrumental values, because intrinsic value suggests that all species should be equal, but we spend much more time conserving cute photogenic species and iconic sites of natural beauty. This has given rise to the Ugly Animal Preservation Society, who exercise the intrinsic value of species’ existence through reverse psychology by celebrating ugly animals deemed worthy of
conserving (O'Callaghan, 2013).
In urban environments, acquired values have a historical and cultural context that changes over time, affecting the urban aesthetic (Head and Muir, 2006). Acquired values are present in areas such as the Fitzroy Gardens, the Botanical Gardens and the Domain in Melbourne, Alexandra Park in Moonee Valley, parks along the Middle Yarra and the Heidelberg School landscapes in Banyule. In Kingston, the Carrum Carrum Wetlands were of great value to the Bunurong people (Presland, 2014), but lost favour with the Europeans and then were subsequently modified and drained. They have only recently re-acquired their heritage values in the much diminished Edithvale-Seaford Wetlands which, following their Ramsar listing in 2001, now have international heritage values. Changing attitudes to the intrinsic values of biodiversity, promoted particularly through conservation biology, natural heritage and sense of place also indicates that the intrinsic values of nature – the right to a species or ecosystem’s existence – have changed over time, so are culturally directed (Griffiths, 1996; Head and Muir, 2006).
Key differences between intrinsic and instrumental values include:
• intrinsic values are more likely to be shared community or cultural values,
• they have a different philosophical basis not based on individual utility (see Glossary), requiring a different style of valuation (Sagoff, 1998; Spash, 2008) and
• exhibit different psychological dimensions (Kumar and Kumar, 2008).
However, all societies have rules and regulations that administer intrinsic values, both explicitly and implicitly. These form institutional values that are not traded in markets, although society will invest in them to a greater or lesser degree. With regard to green infrastructure, such values may concern things such as biodiversity, spirituality or community heritage.
ten Brink et al. (2011) discuss intrinsic value with respect to TEV, but their Figure 2 above contains largely instrumental values; intrinsic value is identified but is generally not given a monetary value. We intend to follow that broad model (which has been used by a great many projects) and restrict the monetary part of the framework to instrumental values. This may include some acquired values, for example those that value parts of the urban landscape more than others, and where a ‘price’ can be estimated. Intrinsic values, particularly those held by communities, are very important but require different methods of valuation, as discussed later in the paper.
16 effectiveness include limitations in calculating exchange values for complex and open functions, assessing ‘goods’ and ‘bads’, aggregation of multiple services and site specificity (Hein et al., 2015).
The most straightforward valuation relating to GI is for ecosystem goods and services traded within markets. However, current accounts show that the contribution of biodiversity-related income is tiny, and of green infrastructure generally is small, emphasising the need for a more comprehensive approach (Jones and Webb, 2008). Welfare economics is the other major area of activity (Hein et al., 2015), but valuing intangibles remains problematic. The difficulty with converting intrinsic values into dollars, in distinguishing intrinsic and acquired values from each other, and the potential for double-counting the goods and services that GI provides, suggests that total economic value cannot be calculated meaningfully (Spash, 2008). Given these limitations, calculating comprehensive economic value as suggested by Opschoor (2004), where a number of different measures are used, but the assessment remains comprehensive, is a much more suitable goal.
Total Economic Value (TEV) is a useful concept for accounting for the many goods and services provided by green infrastructure, but its very different component values (from market to spiritual and ethical) mean that adding them using a single metric (e.g., dollars) to find ‘total value’ is not feasible.
Recommendation 2 Recommendation 2 Recommendation 2 Recommendation 2
The economic framework should pursue a concept of comprehensive economic value as the most appropriate term for valuing ecosystem goods and services, using a variety of economic approaches. The total economic value framework in Figure 2 can be used to identify the different benefits provided by GI. These would then be assessed using an economic framework capable of calculating different value types.
Summary of ecosystem goods and services
Ecosystem goods and services can be divided into social, economic and environmental groups in line with the familiar triple bottom line approach.
Social benefits Social benefitsSocial benefits Social benefits
Social benefits are diverse and often hard to measure and many, such as community identity, amenity and equity, are indirect. Health benefits include mental, physical and spiritual health (see Figure 3). The provision of clean air and water and places to walk and exercise provide the basis for improved community health. Green infrastructure can also play a role in connecting communities through social activities in public spaces.
Economic benefits Economic benefitsEconomic benefits Economic benefits
17 Environmental benefits
Environmental benefitsEnvironmental benefits Environmental benefits
Environmental benefits contribute directly to environmental protection or to improvements in environmental health that may contribute to social and or/economic benefits. Direct benefits include healthy ecosystems, healthy populations of flora and fauna, connectivity of different spaces and structure that promotes and protects species diversity. The ecological resilience created in healthy ecosystems also supports the overall resilience of a place to environmental extremes.
Box 1 outlines three levels of green infrastructure, the benefits of which are detailed in Appendix 1. This list is collated from Bolund and Hunhammar (1999), Mainka et al. (2008) and Pataki and Carreiro (2011), and will be added to over time.
Box 1. Major social, economic and environment benefits Box 1. Major social, economic and environment benefits Box 1. Major social, economic and environment benefits
Box 1. Major social, economic and environment benefits of green infrastructureof green infrastructureof green infrastructureof green infrastructure
1) Social
i) Human health and wellbeing (a) Physical
(b) Social and psychological (c) Community
ii) Cultural and spiritual iii) Visual and aesthetic 2) Economic
i) Commercial vitality ii) Increased property values iii) Value of ecosystem services 3) Environmental
i) Climate modification
(a) Temperature modification by reducing extremes and raising or lowering air temperature
(b) Shading
(c) Evapotranspirative cooling (d) Wind speed modification ii) Climate change mitigation
(a) Carbon sequestration and storage (b) Avoided emissions (reduced energy use) iii) Air quality improvement
(a) Pollutant removal (b) Avoided emissions iv) Water cycle modification
(a) Flow control and flood reduction (b) Canopy interception
(c) Soil infiltration and storage (d) Water quality improvement v) Soil improvements
(a) Soil stabilization (b) Increased permeability
(c) Waste decomposition and nutrient cycling vi) Biodiversity
(a) Species diversity and population viability (b) Habitat and corridors
vii) Food production
18 When assessing values, it is important to identify the final benefit in a value network or chain (both are possible). Although all benefits should be recognised, adding up intermediary benefits may lead to double counting. On the other hand, a single service may lead to multiple benefits or satisfy more than one area of value, so is why connections between different benefits need to be kept visible in any assessment.
For example, an urban wetland can provide flood control (risk reduction), cooling, visual amenity, aquatic fauna and flora habitat, urban conservation services, nutrient stripping and recycling and educational services. At the individual scale, people enjoy additional wellbeing, recreation and visual amenity as social services. At the community scale, it may be a place of shared values, act as a meeting place and have a friends’ group, which adds value to the wetland and to the community. A hotel with a view over the wetland will be able to charge higher prices if the view is attractive enough and adjacent dwellings will have a higher value, are examples of potential economic benefits.
Environmental accounts and urban green infrastructure
As per Recommendation 2, TEV is most useful as an accounting system, rather than as an economic system. In that sense, TEV is a tool to ensure that all values are represented, rather than being an economic framework in itself. Accounting is not simply a tool to monitor or audit resource use. Systemic approaches to accounting aim to have a human system learn about itself in order to track its performance in reference to where it wants to go (Boyce, 2000; Milne et al., 2011).
With reference to environmental accounts, the United Nations System of Environmental-Economic Accounting (SEEA) is the first international standard for environmental-economic accounting (United Nations, 2014) and is supported by an associated ecological methodology, which is currently being finalised (United Nations, 2013). This process is also being pursued in Australia (ABS, 2012), with the first national environmental accounts being released recently (ABS, 2014). Further information on these initiatives is published under the National Plan for Environmental Information (Bureau of Meteorology, 2013a, b).
Four main types of accounting in the SEEA framework are added to the existing monetary stock and flow accounts of the System of National Accounting:
1. Physical flow accounts record flows of natural inputs from the environment to the economy, flows of products within the economy, and flows of residuals generated by the economy (including water and energy used in production and waste flows to the environment). 2. Asset accounts in physical and monetary terms measure the natural resources available and
changes in the amount available.
3. Functional accounts for environmental transactions record the many transactions between different economic units (i.e., industries, households, governments) that concern the environment.
19 The first three types account for flows, stocks and transactions, and the fourth takes in ecological accounts, which are at present experimental. They closely follow the TEV structure detailed in the previous section. The European Environment Agency is proposing the Common International
Classification for Ecosystem Services (CICES) for final ecosystem goods and services, through the three major groupings of provisioning, regulation and maintenance, and cultural services (Haines-Young and Potschin, 2012). However, this framework is largely based on the side of supply and does not take the perspective of the beneficiary.
A number of frameworks and projects in Australia and overseas are summarised by the Bureau of Meteorology (2013b), but none are really suited to urban situations. This is because they are focused on broad-scale ecosystem services and resource conservation in rural regions, aiming to increase sustainability at the landscape scale. For example in a recent review of Australia’s ecosystem services applications, the only case study relating to urban areas, was the historical mention of Melbourne’s closed water catchments (Pittock et al., 2012). This is partly a research bias, but also shows the separation between urban and non-urban ecological research. Environmental accounting in urban areas requires a fine-scaled approach relevant to the scale of service delivery and infrastructure providing it. This indicates that building environmental accounting into existing project and service delivery in local government that do work at those scales, is a better approach than developing a separate set of accounts.
Also, because people are the main beneficiaries there is a greater emphasis on social, rather than environmental, values. Consequently, the role of green infrastructure in sustaining human health and wellbeing is under-emphasised in existing applications. Although there are existing wellbeing indices, such as the Hale Index of Australia’s Wellbeing (Lancy and Gruen, 2013; Waksberg and Gruen, 2013) and the genuine progress indicator (GPI), these are too coarse for urban use. For example, in the Hale Index, the environment is given one number, relating to gradual climate change. Jones (2010) describes an accounting framework designed to practice sustainability and report performance, but most existing schemes are aimed towards ensuring ecological sustainability at the landscape scale, which would be relevant to cities but remains theoretical, having not yet widely been put into practice.
Environmental accounting systems are in their early stages of development and are currently not that well suited to application at the local government scale.
Recommen RecommenRecommen
Recommendation 3dation 3dation 3dation 3