THE STUDY OF
POLLUTANT REMOVAL
FROM
URBAN STORMWATER
USING A
CONSTRUCTED WETLAND
HONOURS PROJECT
Department of Environmental Management
Victoria University of Technology
V I C T O R I A U N I V E R S I T Y OF T E C H N O L O G Y 3 0001 00166564 7
Name: Bram Mason
Supervisor: Dr Paul Lam
October 1994
FTS
ACKNOWLEDGEMENTS
There are many individuals I would like to extend my sincere gratitude towards
in helping me accomplish this honours project. I would like to thank Dr Paul Lam
for first accepting to be my supervisor for this project and for continually
guiding and instructing me in various tasks as well as being p^a^fen^and keen to
respond to any queries and difficulties that presented themselves throughout
the acedemic year.
I am also grateful to Vincent Pettigrove from Melbourne Water for letting me
work on the Shankland Wetland.
Cn^ ^
My sincere thanks i ^ l s o extended to Dr Mani Sripada and Patrick Lai for their
TABLE OF CONTENTS
SECTION COMPONENT PAGE
1 . 0 ABSTRACT 1
2 .0 INTRODUCTION 2
3.0 AIMS 10
4.0 METHODS AND MATERIALS 11
5.0 RESULTS 14
6.0 DISCUSSION 22
7.0 CONCLUSION 36
1.0 ABSTRACT:
The purpose of this investigation was to examine the Shankland Valley Wetland
for its ability to treat urban stornnwater pollutants. Monitoring was conducted
during two nnoderate storm events and two non-storm events. Pollutant
concentration was measured at 24 hour intervals over periods of approximately
one week.
Data indicated that the wetland was reducing some pollutants but seemed
to increase the concentration of others. It was also found that Roxburgh Park
seems to be the major contributor of pollutants to Shankland wetland. The
receiving waterway, Yuroke Creek, had higher concentrations of phosphorus than
the stormwater drains (SWD). Since phosphorus is a limiting nutrient for algal
growth, it was found that it may be worth directing the flow of Yuroke creek
through the wetland to reduce the concentration. G e n e r ^ all other pollutants
were lower in Yuroke dxeek than the effluent from the wetland. Therefore/it is
possible to say that during the period tested, the Shankland Wetland is situated
in the correct position to treat pollutants so as they do not increase in Yuroke
€reek and any downstream catchments. A brief macroinvertebrate study was also
2.0 INTRODUCTION
2 . 1 REASONS FOR STUDY
S t o r m w a t e r run-off from roofs, parking lots, roadways, and landscapes i m p a c t s and degrades water quality and habitat values within existing water courses. The Shankland Wetland was primarily designed to reduce the bulk of the pollutants that enter the w a t e r w a y s during the first part of a storm. Shankland drain (from M e a d o w Heights) was considered to need the
t r e a t m e n t , compared to the stormwater drain (SWD) from Roxburgh Park. This w a s because Roxburgh Park stormwater is ment to be treated to a reasonable extent by the wetlands north of Somerton road (appendix A).
A comparison has been made between American and Australian urban data t o help identify monitoring needs in Australian urban catchments (Bufill M.C,
questions concerning wetland treatment system longevity, the effects on wetland biota, and design innovations to enhance pollutant assimilation (Knight.RL, et al., 1993). Additional research is also needed to determine the adequate pollutant loading rates to assure the biological integrity of wetlands (Ethridge B.J, et al.,
1993)
2.2 WATER QUALITY PROBLEMS
Urban stormwater runoff has been found to cause severLdissolved oxygen depletion, poor water clarity, and extensive algal growth, particularly during the summer recreational months in Washington (Bautista M.F.). Accumulative effects such as eutrophication and toxicity resulting from nutrient, heavy metal and organic micropollutant loadings are also associated with stormwater pollution (Ellis J.B., 1990; Jacobsen B.N, 1993; Segarra-Garcia R. and V.G. Loganathan, 1992).
The majority of stormwater pollutants mentioned above are associated with particulat^as a result of adsorption to solids and other surface processes. Therefore effective particulate removal via sedimentation and filtration by vegetative cover should yield efficient pollutant reductions (Ellis, 1990).
Water quality data collected at Lake Lacamas Washington, suggested that phosphorus was the limiting nutrient in controlling the amount of biological activity in the Lake (Bautista M.F, 1993).
Lake where the resulting treated water was being drained into was phosphorus
linnited, it is thought that the nitrate should not adversely affect the lake. The
Shankland wetland which comes under study in this thesis is a fresh water system
as is Lake Lacamas, so any high levels of nitrate resulting from treatment should
not cause any adverse g t f j c t s downstream in Yuroke ^reek.
It is hard to distinguish between a "clean" and "dirty" water catchment. Ellis
1990, reported that variations between these dirty and clean catchments can be
within an order of magnitude, whilst the variation in quality between different
runoff events can be within a factor of three.
Leachate from disused landfill sites can cause major problems if allowed to
enter the natural water course. It is important to minimise the polluting potential
of the leachate before this occurs. Hadden and Murphy 1994, noted the potential
of using a wetland to treat the leachate before entry into the natural water course.
They also noted that if a wetland is used to collect any surface runoff before it has
a chance to soak into the soil of disused landfill sites, leachate will be minimised.
The type and amount of pollutants that can be found in stormwater is highly
variable with pollutant characteristics closely related to land use and rainfall
characteristics (Livingston E.H, 1993). The catchment area serviced by the
Shankland wetland was___farmland\ becoming residential. One area is already
established. Meadow Heights, the other area is a new housing estate, Roxburgh
Park.
Of primary importance to water quality is the first washing action that
of time without rain. This washing action is termed the "FIRST FLUSH". During
this first storm, impervious surfaces are washed creating a shock loading of
pollutants into the water shed (Livingston E.H, 1993). Studies in Florida USA, have
indicated that the first flush caries 90 % of the pollution load from a storm event
(Livingston E.H, 1993). The importance of the first flush is also recognised by
Bautista, 1993.
For treatment of the entire runoff body, a storage space large enough to
hold the runoff is needed. This results in the total pollutant load being trapped and
eventually treated; otherwise an overflow can occur leading to contamination of
the receiving water body (Segarra-Garcia. R, 1992).
Pollutants can also ^ ^ ^ e c ^ t h e macroinvertebrate population. The
semipermanent flooding which contains the pollutants has been reported to
eliminate environmental cues necessary for oviposition, embryonic development
and hatch among dominant taxa (Neckless, H.A, et al, 1990). This leads to the
depletion of density of total invertebrates.
2.3 POLLUTANT TREATMENT MECHANISMS
initial removal mechanisms are physical and chemical followed by biological
processes (Mitsch & Gosselink, 1986; and Kusler & Kentula, 1990). Other more
specific factors are mentioned below.
Treatment of pollutants using a biofiltration system or something similar can
be enhanced if the underlying soil has a relatively high organic content and cation
exchange capacity (Ellis. J.B, 1990).
Sedimentation and filtration are important in the reduction of pollutants. For
these processes to be successful, the designed flow rate must be at a minimum.
Flow rates above 0.5 - 0.8 c ^ _ J r e able to destroy vegetation and inhibit
sedimentation (Ellis. J.B, 1990).
The slope where macrophytes grow can the treatment efficiency.
Generally the minimum slope for biofilters should be 2% and the maximum slope
being 4%. Emergent species can be planted on a flatter slope. The main objective
of the gradient is to maximise vegetation and soil contact of pollutants (Ellis. J.B,
1990).
Once the solids have been filtered through the biofilter and settle to the
bottom of the pond/wetland, it is estimated that the solids will stay there for
approximately one hundred years (East. C, 1994).
Given the influence on growth rate of algae from phosphorus and nitrogen,
2.3.1 PHOSPHORUS REMOVAL:
Phosphorus is required for algae to grow. Algae can grow at phosphate levels as
low as 0.05 mg/L. For growth i n h i b i t i o n j ^ ^ ^ k ^ required well below 0.5 mg/L
(Manahan. S.E, 1991). In nnunicipal wastes, phosphate can be found around the
concentration of 25 mg/L (Manahan. S.E, 1991). This usually differs from
stormwater concentrations by a factor of 10 (Livingston. E.H, 1993). The forms
of phosphate typicallpre; o-phosphates, polyphosphates and insoluble phosphates
/
(Manahan. S.E, 1991).
Phosphorus removal may occur due to primary settling of solids; due to
aeration such as an activated sludge unit, or; after secondary waste treatment
(Manahan. S.E, 1991). Constructed wetlands incorporate primary settling in a
Gross pollutant trap, and secondary settling due to the slow movement of water
through macrophyte beds in the wetland.
Where high levels of dissolved oxygen and pH are found, efficient
phosphorus removal has been attained as high as 60-90% (Manahan. S.E, 1991).
When gas is removed by the degradation of organic material, the levels of C 0 2 are
relatively high, which results in a low pH due to the presence of carbonic acid.
This results in the phosphorus being in the form of H2P04'
With aeration rates in relatively h a ^ water, the C 0 2 is removed, and the pH
rises and the following reaction occurs;
The precipitated phosphate in the form of hydroxyappatite or other form of calcium phosphate is incorporated into the suspended solids that later settle into the sludge (Manahan S.E, 1991). This reaction is hydrogen ion dependent and an increase in concentration drives the equilibrium back to the left. If anaerobic conditions prevail, the sludge becomes more acidic due to the abundance of C02 and calcium returns to solution.
2.3.2 NITROGEN REMOVAL:
In freshwater systems nitrogen is the next important chemical to remove to reduce algal growth. Nitrogen is generally present as organic nitrogen or ammonia. The ammonia is oxidised to nitrate through the presence of nitrifying bacteria.
Nitrogen can also be removed through NHS gas, even more if the pH is substantially higher than the pKa of the NH4'' ion (Manahan. S.E, 1991).
Nitrification coupled with denitrification is an adequate technique for the removal of nitrogen. First the ammonia and organic nitrogen are converted to nitrate under aerobic conditions;
NH^^ + 2O2 (nitrifying bacteria) - > NO3" + + H2O
This nitrate can then be converted to nitrogen gas by bacteria with a sufficient
6NO3' + 5CH3OH + GH"" (denitrifying bacteria) --> SNj (g) +
5CO2 + 13 H2O
Alternate wetting and drying which occurs in biofiltration allows both
aerobic oxidation (nitrification), and anaerobic reduction (denitrification) to occur
(Ellis J . B , 1990).
Plant uptake is also a significant removal stage. As much as 400-500
kg/ha/yr of nitrogen and 30-50 kg/ha/yr of phosphorus can be achieved by
macrophytic uptake with the plants apparently serving as ammonia strippers,
taking up ammonium and then evolving ammonia gas (Ellis .J.B, 1990). The
nutrients that are taken up by plants can be released back into effluent if the
vegetation dies and decays. Harvesting of the plant material has been suggested
by some-papefSvf'Ellis. J.B, 1990, & Nuttal. P.M, 1985) to maintain a good quality
outflow. However there is some discrepancy in the literature, other sources say
that the major role of nutrient removal appears to be filtering and settling out of
3.0 AIMS:
The main aims of this thesis are;
To determine whether the Shankland Valley Wetland is situated in the
correct location to treat urban stormwater pollutants, and whether the wetland is
efficient in reducing the pollutants present in urban stormwater runoff during
periods of rain and no rain.
4.0 METHODS AND MATERIALS
4. 7 STUDY AREA
The Shankland Drain Wetland is a stormwater treatnnent facility situated in
the city of Broadmeadows. It is designed to treat approximately 336 ha of
catchment, 160 ha of which is within the Urban Land Authority's development of
Roxburgh Park. This area is used for residential purposes. This facility also treats
1 7 6 ha of M e a d o w Heights land. This zone is also residential with the Meadow
Heights shopping centre and Somerton Reservoir. T w o main drains feed the
treatment facility, water samples were taken from both of these drains.
4.2 SAMPLING METHODS
Tests were carried out to test the treatment efficiency of the wetland during
times of rain and no rain. The results were then compared to look for trends. The
following parameters were analysed for; coliforms, total suspended solids, nitrate,
nitrite, total oxidised nitrogen, phosphate and total phosphorus. Samples were
stored in polyethylene bottles for periods of no more than forty eight hours at
temperatures of 14°C(American Public Health Association, 1990).
4.3 TEST PROCEDURE
Argent 1991, conducted a comparative study on the enumeration of E.coli
in w a t e r . In this study he compared a new defined substrate method with
membrane technique. The membrane technique involved using one hundred
millilitre aliquots of sample, filtering through a 0.45 micron cellulose nitrate
membrane, and then incubating at 37 °C for 24-28 hours. The results were then
times. The American Public Health Association, 1990, also sugges;r^the membrane
filter technique. The filter paper was placed onto lauryl tryptose agar, inverted and
then incubated. For counting, the Qubec type colony counter was used.
VF^ r|omogenous samples of water were filtered through a weighed glass
fibre filter and then the residue retained on the filter was dried to constant weight
at 103-105°C. The increase in weight of the filter represented the total suspended
solids (American Public Health Association, 1990).
For the determination of nutrients in the sample water, ASTM stated that
the use of flow injection analysis (FIA) was appropriate and efficient. FIA is the
automation or semi-automation of a conventional manual method, and often results
in a decrease in the number and level of interferents. Therefore undesirable side
reactions don't have the opportunity to develop to an extent in such a short
residence time (60 sec) (Valcarrel. M, 1988 ). FIA involves kinetic, physical and
chemical aspects which may lead some people into thinking that the method is not
precise. However the reproducibility levels are high.
Nitrate, nitrite and o-phosphate can all be analysed by FIA without any
previous preparation. Total oxidised nitrogen and total phosphorus both needed to
be oxidised under pressure and temperature. To meet these requirements, the
samples had potassium persulphate added to them and were autoclaved at 120°C
for 30 minutes. Once cooled the samples were immediately injected into the FIA.
For analysing nitrogen samples using FIA, all nitrogen must be reduced to
nitrite, this was accomplished by installing a cadmium reductor on the FIA. The
\K 4
compound. The diazo compound is coupled with lfj-(1-naphtyl)-fthylene Diamine^ihydrochloride (NED) to form a purple azo dye. The azo dye is then measured at 540 nm.
5.0 RESULTS:
1
5.1 MAJOR CONTRIBUTlNGvSTORMWATER DRAIN TO SHANKLAND WETLAND: V
Pollutant concentration in stormwater runoff was measured during periods of rain and no rain.
VARIABLE MEAN RANGE
o-PHOSPHATE 150 ±34.29 ug/L (11.11 - 488.86) TOTAL
PHOSPHORUS
300 ± 197 ug/L (26 - 1370)
NITRITE 20 i 7.38 ug/L (0 - 90.92)
NITRATE 1370 i 185 ug/L (893.62 - 3347.99)
TOTAL OXIDISED N 18 i 0.23 mg/L (16810 - 18520) SUSPENDED SOLIDS 0.5 i 0.14 mg/L (0.045 - 1.65)
COLIFORMS 10200 i 2164
/lOOmL
(5400 - 20200)
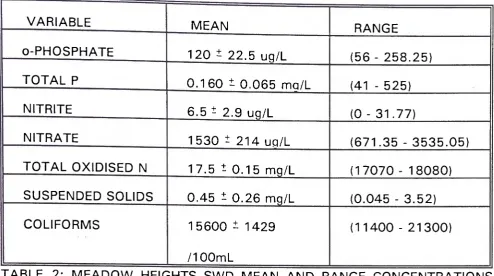
V A R I A B L E M E A N RANGE
o - P H O S P H A T E 120 ± 22.5 uq/L (56 - 258.25)
T O T A L P 0.160 t 0.065 ma/L (41 - 525)
NITRITE 6.5 ± 2.9 uq/L (0 - 31.77)
NITRATE 1530 ± 214 uq/L (671.35 - 3535.05)
T O T A L O X I D I S E D N 17.5 i 0.15 mq/L (17070 - 18080)
S U S P E N D E D S O L I D S 0.45 ± 0.26 mq/L (0.045 - 3.52)
C O L I F O R M S 15600 i 1429
/lOOmL
(11400 - 21300)
T A B L E 2: M E A D O W HEIGHTS S W D M E A N A N D RANGE C O N C E N T R A T I O N S
D U R I N G PERIODS OF NO RAIN.
V A R I A B L E M E A N RANGE
o - P H O S P H A T E 170 ± 23.72 ug/L (37.77 - 319.35)
T O T A L P 0.280 ± 0.101 mg/L (64 - 843)
NITRITE 25 ± 7.01 ug/L (1.09 - 122.81)
NITRATE 1010 ± 80.4 ug/L (561 - 1418.11)
T O T A L O X I D I S E D N 19 ± 0.7 mg/L (16500 - 20930)
S U S P E N D E D S O L I D S 0.6 i 0.28 mg/L (0.08 - 3.8)
C O L I F O R M S 16800 ± 3 6 0 0
/lOOmL
(5300 - 30800)
TABLE 3: C O M B I N A T I O N OF ROXBURGH PARK A N D M E A D O W HEIGHTS SWD(s)
V A R I A B L E M E A N RANGE
o - P H O S P H A T E 3 1 0 i 120.7 uq/L (48.55 - 1681.35)
T O T A L P 3 9 0 i 117.2 uq/L (151.55 - 757.2)
NITRITE 30 i 8.5 ug/L (1.25 - 100.21)
NITRATE 1060 t 57.5 uq/L (784.55 - 1396.08)
T O T A L O X I D I S E D N 1.0 t 0.051 mq/L (820 - 1110)
S U S P E N D E D S O L I D S 0.8 i 1.14 mq/L (0.255 - 3.6)
C O L I F O R M S 19200 t 5500
/lOOmL
(3500 - 60000)
T A B L E 4: R O X B U R G H PARK S W D M E A N A N D RANGE C O N C E N T R A T I O N S FOR
P E R I O D S OF RAIN.
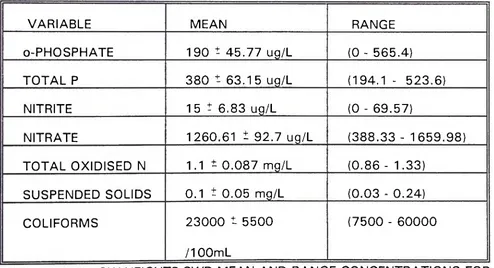
V A R I A B L E M E A N RANGE
o - P H O S P H A T E 190 ^ 45.77 ug/L (0 - 565.4)
T O T A L P 380 t 63.15 ug/L (194.1 - 523.6)
NITRITE 15 i 6.83 ug/L (0 - 69.57)
NITRATE 1260.61 i 92.7 ug/L (388.33 - 1659.98)
T O T A L O X I D I S E D N 1.1 i 0.087 mg/L (0.86 - 1.33)
S U S P E N D E D S O L I D S 0.1 ± 0.05 mg/L (0.03 - 0.24)
C O L I F O R M S 2 3 0 0 0 t 5500
/lOOmL
(7500 - 6 0 0 0 0
TABLE 5: M E A D O W HEIGHTS S W D M E A N A N D R A N G E C O N C E N T R A T I O N S FOR
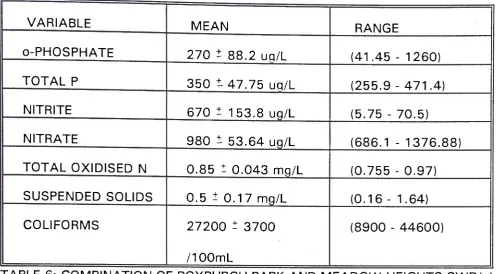
VARIABLE MEAN RANGE
o-PHOSPHATE 270 ± 88.2 uq/L (41.45 - 1260)
TOTAL P 350 t 47.75 uq/L (255.9 - 471.4)
NITRITE 670 ± 153.8 ug/L (5.75 - 70.5)
NITRATE 980 t 53.64 ug/L (686.1 - 1376.88)
TOTAL OXIDISED N 0.85 t 0.043 mq/L (0.755 - 0.97)
SUSPENDED SOLIDS 0.5 ± 0.17 mg/L (0.16 - 1.64)
COLIFORMS 27200 i 3700
/lOOmL
(8900 - 44600)
TABLE 6: COMBINATION OF ROXBURGH PARK AND MEADOW HEIGHTS SWD(s)
DURING PERIODS OF RAIN.
The above tables (one through six) indicate mean and range concentrations
for various parameters in two stormwater drains, from Roxburgh Park and Meadow
Heights. The combination results in table three and six indicates concentrations
after the stormwater from both drains has been mixed.
From these tables it can be seen that the Roxburgh Park SWD during
periods of dry weather supplies the wetland with the highest concentrations of
ortho-Phosphate, total phosphorus (TP), nitrite, total oxidised nitrogen (TON), and
suspended solids. The Meadow Heights drain, during the same conditions supplied
Under wet conditions, the Roxburgh Park SWD seems to be responsible for I
the highest concentrations of ortho-Phosphate, total phosphorus, nitritisuspended solids. The Meadow Heights SWD also seems responsible for the highest concentrations of nitrate, total oxidised nitrogen, and coliforms.
Flow rate data was unattainable from the two stormwater drains, so the measurements given are in terms of grams per litre or coliforms per lOOmL.
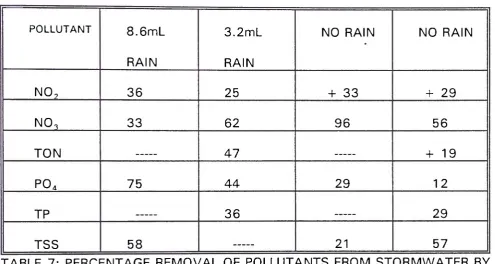
5.2 R E M O V A L EFFICIENCY OF WETLAND:
POLLUTANT 8.6mL 3.2mL NO RAIN NO RAIN
RAIN RAIN
NO, 36 25 + 33 + 29
NO., 33 62 96 56
TON 47 + 19
PO. 75 44 29 12
TP 36 29
TSS 58 21 57
TABLE 7: PERCENTAGE REMOVAL OF POLLUTANTS FROM STORMWATER BY WETLAND PROCESSES.
A T-test was carried out on parameters with complete data, to see if there
w a s a significant difference between pollutant concentrations during periods of
rain and periods of no rain. Nitrite showed a significant difference (t = 8.2,
df = 1/n = 2, p < 0.05). Nitrate showed no significant difference (t = 0.83, n = 2, p >
0.05). ortho-Phosphate also showed no significant difference between periods of
rain and no rain (t = 5.57, n = 2, p > 0.05).
Examples of raw data for the above removal efficiencies can be found in
appendices one through six, along with a sample calculation of the removal
efficiency and mass flow rate in appendix 7.
Rainfall data on dates 16/6/94 2 3 / 6 / 1 9 9 4 (days 2,3,4 & 5) and 3 / 8 / 9 4
-7 / 8 / 1 9 9 4 (days 1,2 & 3). Dates with no rain were 15/4/94 - 1 9 / 4 / 1 9 9 4 and
2 3 / 5 / 9 4 - 2 8 / 5 / 1 9 9 4 .
5.3 EFFECTS ON YUROKE CREEK FROM EFFLUENT RELEASED FROM WETLAND:
Pollutant effects on Yuroke Creek were observed by plotting site 6
(upstream Yuroke Creek) concentrations and site 8 (downstream of wetland)
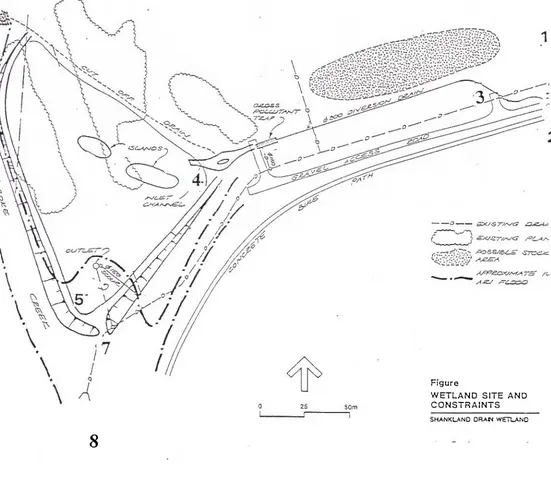
concentrations on a graph of concentration versus time. A map of the Shankland
W e t l a n d can be found in appendix B. The difference in area between the t w o
curves of site 6 and site 8, indicates the amount that the concentration of the
pollutant has increased or decreased. Flow rate in Yuroke&reek was similar at
sample points 6 (Upstream Yuroke creek) and 8 (downstream Yuroke creek), see
appendix 8. Appendices S through 15 are graphical representations of the effects
The data regarding the effects on Yuroke creek can also be used to see if
the wetland is situated in the correct spot to treat storm water.
Generally coliform concentration at site 6 and 8 was similar on each day,
however, the concentration varies through the week. No major trend can be seen
in dry or wet periods.
Suspended solid concentrations were higher at site 8 than site 6, upstream
of the confluence of the Shankland drain. Howeveryduring wet periods, site 6
concentrations are higher than site 8.
Nitrate concentrations at site 6 were consistently higher than those at site
8 during periods of no rain. Howevei^ when it rains site 8 concentrations exceed
site 6 concentrations.
Nitrite levels during periods of no rain fluctuate and are very erratie:u|^uring
periods of raii^ data is more consistent indicating higher levels of nitrite at site 8
than site 6.
Total oxidised nitrogen (TON) concentrations during periods of no rain, are
generally higher at site 8 than site 6. A similar trend is noted during rainy periods.
The ortho-phosphate concentration varied considerably between t-he four
times monitoring was undertaken.
Total phosphorus concentrations in Yuroke creek during dry periods are
erratic, with site 6 being higher than site 8 one day and visa versa the next.
During the period of rain, concentrations at site 6 were generally higher than those
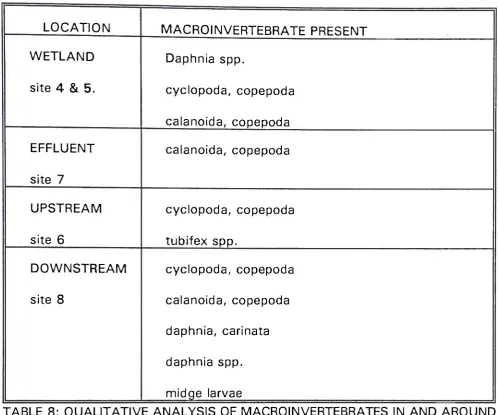
5.4 MACROINVERTEBRATE SURVEY OF YUROKE CREEK AND SHANKLAND WETLAND:
LOCATION MACROINVERTEBRATE PRESENT
WETLAND Daphnia spp.
site 4 & 5. cyclopoda, copepoda
calanoida, copepoda
EFFLUENT calanoida, copepoda
site 7
UPSTREAM cyclopoda, copepoda
site 6 tubifex spp.
DOWNSTREAM cyclopoda, copepoda
site 8 calanoida, copepoda
daphnia, carinata
daphnia spp.
midge larvae
TABLE 8: QUALITATIVE ANALYSIS OF MACROINVERTEBRATES IN AND AROUND
SHANKLAND WETLAND.
Samples were taken by using plankton nets and then placed into plastic
containers for transport to the laboratory. Identification was then accomplished
with the aid of Herbert P.D.N, 1977. From the above table it can be seen that site
6.0 DISCUSSION:
6.1 MAJOR CONTRIBUTING STORMWATER DRAIN TO SHANKLAND WETLAND:
From the results section 5.1, it can be seen that during ^ r y periods Roxburgh Park SWD has higher concentrations of ortho-phosphat^TP,, rlitrites and suspended solids, than Shankland drain (from M e a d o w Heights). Roxburgh Park is a n e w residential estate w i t h building, landscaping etc still being undertaken. Building and landscaping may increase the input of nutrients and suspended solids into the local hydrology (including the stormwater drains). This may result in the larger concentrations of pollutants in Roxburgh Park SWD compared to Shankland drain.
The higher concentrations from Roxburgh Park could also be attributed to the larger flow rate from Roxburgh Park SWD, compared to Meadow Heights SWD concentrations.
During wet periods a similar trend was noted to that during dry periods. The SWD from Roxburgh Park carried highest concentrations of o-phosphate, total phosphorus, nitrite and suspended solids. The Meadow Heights SWD carried highest concentrations of nitrate, total nitrogen and coliforms.
_Cora!^ar4ng results between the combination of both stormwater drains and upstream Yuroke g/eek will enable us to see if the wetland was situated in the correct spot. These results can be found in the form of graphical representation in appendices 16-37.
From these graphs, the following can be assumed. During periods of rain, coliforms, suspended solids, nitrate, nitrite, total oxidised nitrogen and total phosphorus all had higher concentrations in the combination drain than at upstream Yuroke creek. Only ortho-phosphate during this period was higher in Yuroke creek than the combination drain.
During periods of no rain, generally coliforms, suspended solids, nitrate and t o t a l phosphorus were higher in the combination drain than upstream Yuroke creek. Total oxidised nitrogen and ortho-phosphate were generally higher in Yuroke creek compared to the combination drain. Nitrite during this period fluctuated between being higher in Yuroke Creek and the combination drain.
Yuroke Creek. Therefore the wetland is in an appropriate position to intercept
pollutants from the stormwater drain so they do not adversly effect Yuroke creek.
In some cases there is little difference in the concentratior^etween Yuroke
creek and the combined stormwater. Therefore it may be worth diverting Yuroke
creek through the wetland.
6.2 R E M O V A L EFFICIENCY OF WETLAND:
There is a constant cycling of nutrients through the wetland, and
concentrations provide information on the amount of nutrient before and after the
wetland. No information was gathered on the processes undertaken! The only
evidence provided is, the drop or increase in the amount of nutrient. We can only
speculate as to what is happening by looking at previous examples of wetland
treating liquid waste.
A T test was performed on complete data in table 7, and it was found that
nitrate and ortho-phosphate were not significantly different between events of rain
and no rain, however nitrite did show a significant difference between events of
rain and no rain.
During dry periods, nitrite concentration increased in the effluent compared
to the influent. At the sampling points where effluent was collected during the dry
periods, ammonia/ammonium may have been undergoing nitrification, resulting in
a large amount of nitrite at that time.
Nitrite is an unstable form of nitrogen and is easily oxidised to nitrate or
system results in many forms of nitrogen and is cyclic. It operates on the principal of nitrogen reaching the most stable state. For this process to be cyclic however, the most stable species must be converted to a species of higher free energy of formation (less stable). This reaction requires a large amount of energy. The
nitrogen cycle is carried out to a large extent by microorganisms. These microorganisms are able to couple other cyclic processes (such as the carbon cycle) to supply the energy required for the formation of less stable species (O'Neill P, 1985). An example of the nitrogen cycle and phosphorus cycle can be found in appendix 38.
A reduction in nitrites through the wetland during periods of rain, as seen in table seven, could be due to the following processes.
A t-test was preformed upon nitrate removal during wet and dry periods,
section 5.2. The result of this test was that the difference between nitrate
reductions during wet and dry periods was not significant. The amount of water
coming down the drain would then seem not to effect the biological, physical and
chemical processes in the wetland that reduce the amount of nitrate.
Nitrate undergoes denitrification and assimilation by plants (O'Neill. P,
1985). Denitrification is the regeneration of dinitrogen from nitrate, and occurs
under both aerobic and anaerobic conditions in the soil and water. Under anaerobic
conditions microorganisms can use nitrate to replace dioxygen as an electron
acceptor and as their source of respiratory energy.
5CH,0 + 4N0^- + 4H+ — > 2N, + 5C0, + 7H,0
The reduction of nitrate does not always form dinitrogen, gaseous dinitrogen oxide
may also be produced (O'Neill. P, 1985).
Macrophytes can also remove pollutants, such as nitrate, by assimilating
them into their tissue (Breen P.P.A, 1990; H. Brix, 1993; and Pinlayson et at,
1982). This is one component of primary production where the assimilated
nutrients are used to produce organic matter via photosynthesis (Hicks D.B and
Q.J. Stober)
The Macrophytes in the water column, stems, leaves and detritus, also
provide attachment sites for the growth of microbial colonies. The macrophytes
zone in a usually anaerobic substrate. This oxidised zone allows aerobic
microorganisms to conduct desirable modifications of nutrients and other
compounds (Pullin B.P and D.A. Hammer, ).
Total oxidised nitrogen (TON) removal is also reported in table 7, section
4.2. From this table and attached graph, it can be seen that TON removal occurs
only during periods of rain. During period of no rain the amount of TON leaving the
wetland exceeds the amount coming in. Total oxidised nitrogen represents the
total amount of nitrogen present in a water sample expressed as nitrate.
The most probable explanation of the drop in TON would be a dilution effect
caused by the extra amount of rain coming down the drain, and the addition of
TON to a large body of water.
The processes mentioned below would also contribute to the drop in TON.
Generally nitrogen removal can be described as:
(1) Adsorption of ammonium ion by the soil surface.
(2) Nitrification of ammonium to nitrite and then to nitrate.
(3) Transport of nitrate to the anaerobic zone in the saturated soil pores.
(4) Denitrification of nitrate to gaseous forms in the anaerobic zone, and
(5) Plant assimilation.
Nitrate transport is reported to be the limiting step of nitrogen removal (Ellis, J.B,
1990).
T O N increase during periods of no rain could mean that most of the
ammonia present in the wetland is being oxidised to nitrate. Since a measure of
the ammonia is coming from. Ammonification is a possibility. This is where
a m m o n i a is formed from amino acids and proteins by the reactions of
microorganisms. Another possibility, however less iil<ely is nitrogen fixation (O'Neill
.P, 1985).
The Shankland Valley Wetland was not constructed a long time ago,
therefore the emergent vegetation is still new and fairly unestablished. This would
mean t h a t the vegetation would not be able to extract nutrients from the water
column and soil as effectively as older vegetation. The way the wetland has been
designed would mean that water to be treated flows along the surface of the soil
and over the emergent vegetation. However^pollutants would be better treated if
they were in a more constant contact with the rhizosphere.
Soil particles are able to adsorb a certain amount of ammonium. But this is
a finite way of treatment and the soil particles would eventually become saturated.
If the equilibrium changes the ammonium would then be released back into the
water column.
ortho-Phosphate percentage reduction was also recorded in table 7. The
results given for periods with and without rain were tested to see if there was a
significant difference between them. This was done by using the t-test. From this
it w a s found there was not a significant difference between them. Generally
o-phosphate is reduced through the wetland. To a greater extent during rainy periods
than periods w i t h no rain.
Total phosphorus (TP) also showed very little difference in percentage
Phosphorus enters aquatic systems from catchment runoff primarily as particulate forms, adsorbed onto inorganic silt and clay particles (Harper .D, 1992; Richardson C.J and C.B. Craft, 1993; and Brix .H, 1993). This is a strongly seasonal process, with 90% or more running off during winter or spring months
(Harper .D, 1992).
Phosphorus adsorption and retention in freshwater wetland soil is controlled by interaction of redox potential, pH, Fe, Al, and Ca minerals, and the amount of phosphorus in native soils (Lindsay A.L, 1979, and, Faulkner S.P and C.J. Richardson, 1989). Redox potential and pH both control the mobility of phosphorus in the environment. In acidic soils, inorganic phosphorus is adsorbed to hydroxides of iron and aluminium, and may precipitate as insoluble iron-phosphates and aluminium-iron-phosphates. In soils with a pH above 7.0, phosphorus is transformed to insoluble precipitates of calcium phosphate (Richardson C.J. and C.B. Craft, 1993).
Both phytoplankton and macrophytes are able to take up large amounts of phosphorus. Recent studies show that phytoplankton are more efficient at uptaking phosphorus than macrophytes (Howard-Williams C, 1985).
In the majority of freshwater systems, phosphorus is the limiting nutrient for
algal growth (Baker .L.A, 1993). If there is an excess of phosphorus, it can lead
to algal blooms, especially during warm dry conditions. It has been reported that
total phosphorus concentrations paralleled suspended solid concentrations.
However, total phosphorus concentrations were probably associated with
fluctuations in point sources. Where increases occurred in phosphorus, statistical
associations between total phosphorus increases and measures of fertilised
acreage and cattle population were found.
Suspended solidj^removal efficiency can be found in table 7, section 5.2. An
incomplete data set for suspended solids meant that a t-test was unable to be
preformed. A general look at the data available would seem to indicate that the
effect of rain on suspended solid removal is minimal if any.
Suspended solids are generally removed from a water body by gravitational
settling and filtration due to emergent vegetation. Suspended solid concentrations
may be increased jn a pond due to the action of turbulence caused by wind and
wave action on the shore (Hellawell J.M, 1986). Suspended solid concentrations
only pose a threat to freshwater communities when they are present either at
abnormally high levels or for long periods, thereby changing the nature of the
habitat.
Suspended solid concentrations may effect the aquatic environment in the
following ways:
(2) Exerting mechanical effects on organisms by increasing abrasion, clogging
the respiratory surfaces or interfering with feeding through inadvertent collection
of feeding appendages.
(3) Modifying the nature of the habitat by changing the character of the
substratum when they collect by settlement as flows are reduced.
The ultimate effect on the biota of suspended solids is clearly dependent upon the
nature of the material held in suspension, including size, density, nutritive value,
toxicity, and its potential for bacterial decomposition (Hellawell J.M, 1986).
If available storage is provided to hold an entire runoff event, the total
wash-off load (amount of pollutants in one runoff event) will be trapped and
eventually treated or diluted to an acceptable concentration; otherwise an overflow
of the pollutants occurs into the accepting water body. In this case Yuroke ^ e k
(Segarra-Garcia .R and V.G. Loganathan, 1992). This could lead to an increase in
the amount of nutrient leaving the wetland, thereby reducing the removal
efficiency of the wetland.
6.3 EFFECTS ON YUROKE CREEK FROM EFFLUENT RELEASED FROM WETLAND:
Comparing the results for coliform concentration in upstream and downstream
^ g r o k e creek, " A c t i o n 5.3,the one generalisation that can be made is that
upstream concentrations of coliforms are higher than downstream concentrations,
most of the time. Between these two sampling sites is the outlet for the wetland.
It seems that the water from the wetland is diluting the creek water, reducing the
f r o m Yuroke creek, it seems a good idea to transfer the water from the creek
through the wetland.
Land uses further upstream Yuroke creek (at A t t w o o d Creek) will effect the
pollutant load in the creek at the site near the wetland. The area at A t t w o o d Creek
is unsewered and relies on septic tanks to treat domestic sewage. The septic tanks
could be failing resulting in the higher concentrations of coliforms before the
wetland. However^since the difference is very small, this is unlikely. Paddocks
adjoining the Shankland wetland where Yuroke ^ e e k flows through, have horses
and cattle that use the creek for drinking water. These animals defecate in and
around the creek. Horses and cattle are warm blooded and therefore have
coliforms in their guts. These coliforms are released in the faeces, and may end
up in the creek. This seems to be the most probable answer to the high
concentration of colifoms in upstream, site 6, Yuroke Creek.
Suspended solid concentrations during periods of no rain are higher
d o w n s t r e a m Yuroke creek than upstream. However |this value does fluctuate
slightly. Therefore during dry periods the wetland increases the suspended solid
loading of Yuroke creek. However^wind causing waves on the wetland water
surface will increase suspended solids. Wind velocity was not measured during
sampling. If the wind was strong, this could help explain the increase in
concentration downstream.
During w e t periods the wetland dilutes the loading of suspended solids in
Y u r o k e & e e k . See section 5.3. Rain could be beneficial for the treatment of
Nitrate concentration was higher upstream Yuroke creek then after the wetland during periods of no rain. This could mean that the nitrate in the wetland it being treated efficiently so that the effluent leaving the wetland is low in nitrate. The effluent would then dilute the concentration of nitrate in Yuroke creek.
T h e r e f o r e y t would be even more beneficial to divert Yuroke creek through thg/ wetland.
Nitrate concentrations increase downstream Yuroke 6reek during w e t periods. This could mean that the rain has diluted the concentration of nitrate in upstream Yuroke creek. As well as the wetland reaches its treatment limit for nitrate and releases excess nitrate to Yuroke creek. Looking at the graphs for nitrate in section 5.3, the downstream concentration of nitrate during the dry period is around 200 uqlL. Howeverjduring the wet interval the concentration of nitrate downstream was around 3 5 0 t/g/L.
This fairly consistent increase during the wet interval would seem to support t h e idea that the wetland has reached its treatment limit or holding capacity for nitrate. The extra water could also increase aeration of the water leading to physical oxidation of nitrogen compounds to nitrate.
Nitrite concentrations show no consistent data during periods w i t h no rain. This is probably because of the transformations of the nitrogen cycle varying the amount of nitrite.
During periods of rain and no rain the concentration of total oxidised
nitrogen followed a similar trend. That is, the concentrations downstream were
higher than upstream of the wetland. Therefore the wetland is increasing the
concentration of total oxidised nitrogen in Yurokeg,reek.
From the graphs of o-phosphate in section 5.3p generalisation can be made
as to what is happening to o-phosphate. Upstream concentrations seem higher
than downstream of the wetland concentrations. Therefore the wetland probably
does not increase the concentration of o-phosphate in Yuroke ^eek during wet or
dry periods. The wetland possibly dilutes the o-phosphate in the creek.
Generally upstream of the wetland has high concentrations of total
phosphorus compared to downstream of the wetland. |:his is similar to
o-phosphate. Once again the wetland is probably treating the total phosphorus
efficiently and diluting the concentration of total phosphorus in Yuroke creek.
6.4 MACROINVERTEBRATE SURVEY OF YUROKE CREEK AND SHANKLAND
WETLAND:
Examination of table 8 in section 5.4, one can note the prevalent trend in
the increase in macroinvertebrates in the water column downstream of the
wetland. Organisms found in upstream Yuroke 6reek and in the wetland combine
with other organisms to increase the diversity of Yuroke (^eek after the wetland.
The habitat after the wetland does not seem greatly altered from the habitat before
Suspended solids depositing in downstream Yuroke €reek, the addition of
excess nutrients and the possible increase in flow during storms from the wetland
seem the only dangers to the macroinvertebrate population and diversity in Yuroke
6reek. Any increase in deposition of solids and nutrients that may occur from the
wetland will almost certainly be resuspended and washed away during winter
7.0 CONCLUSION:
Seasonal variations, the local hydrology, and the channelisation of Shankland wetland will all effect the concentration of nutrients and the abundance of biota in the wetland and Y u r o k e ^ r e e k .
The major contributing storm water drain (SWD) for phosphorus compounds, nitrite and suspended solids during wet or dry conditions comes from Roxburgh Park. Meadow heights SWD was confirmed as carrying the highest concentrations of nitrate and coliforms.
Looking at results comparing concentrations in the SWD(s) and Yuroke creek, it is possible to say that during the period tested, the Shankland wetland is s i t u a t e d in the correct position to treat pollutants so as they do not increase in Yuroke ^reek and any downstream catchments.
It was s h o w n that rain may increase the removal of nitrite in the wetland before entering Yuroke ^reek. The wetland reduced nitrate efficiently to the same e x t e n t during w e t and dry periods. During periods of rain, the removal of total oxidised nitrogen was sufficient, but during dry periods, TON concentrations increased through the wetland. ortho-Phosphate, total phosphorus and suspended solids were also reduced through the wetland to the same extent during w e t and dry periods.
Suspended solid concentration only increased in Yuroke creek when it did not rain. When it did rain, nitrate and nitrite concentrations increased inYuroke Creek after the addition of effluent from the wetland.
The macroinvertebrate study was only carried out for future reference if .-.succession studies are carried out on Shankland wetland. As a result^the
8.0 REFERENCES
Argent. B A , N . E . B o o t k , T . F W , C . E . Jones, J.Kent, B . N . Man,' an<l R . H . Reed., A pilot U K evaluation of a rapid defined suLstrate metkod for eniimeration of total coliforms and Escherichia coJi in water.
Baker. L . A . , introduction to nonpoint source pollution and wetland mitigation, pp. 7 - 4 1 . In: R . K . Olson (ed.), U . S . E P A , Created and natural wetlands for controlling nonpoint source pollution. C.K. Smoley, 1 9 9 3 .
Bautista. M . F and N . S . Geiger., Wedands for stormwater treatment, Water Environment and Tecknology, 5, (7), 1 9 9 3 .
B r e e n . P . F . A . , A mass balance metkod for assessing tke potential of artificial wetlands for wastewater treatment, Water Res. 2 4 : 6 8 9 , 1 9 9 0 .
Brix. H . , Wastewater treatment in constructed wetlands: system design, removal processes, and treatment performance. In: G.A. Moskiri (ed.), Constructed wetlands for water quality improvement. Lewis Pukliskers, 1993.
BufiU. M . C , M.J. B o v d and W . Leamp recka., Comparison of stormwater quantity and quality data for U S A and Australian urkan catckments In: G.A. Moskiri (ed.). Constructed wetlands or water quality improvement. Lewis Pukliskers, 1993.
E a s t . C.Jr., Natviral system in Louisiana cleans up. Water Environment and Tecknology, Fekruary, 1 9 9 4 .
Elks. J.B., Bioengineering design for water quality improvement of urkan runoff. Paper 1.4, Construction Industry Researck and Information Association, Middlesex Polytecknic, U K , 1 9 9 0 .
Etkridge. B.J, and R . K . O l s o n . , Researck and information needs related to nonpoint source pollution and wetlands in tke water sked: A n E P A perspective. In: R.K. Olson (ed.), U . S . E P A , Created and natural wetlands for controlling nonpoint source pollution. C.K. Smoley, 1 9 9 3 .
F a i i l k n e r . S . P , and C.J. Rickardson., Pkysical and ckemical ckaracteristics of freskwater wetland soils. In: Constructed wetlands for wastewater treatment: Mimicipal, industrial
and agricxdtural, D . A . Hammer (Ed.). Lewis pukkskers, Ckelsea, M I , 4 1 - 7 2 ,
1992-in HeLert^P.D.N., A revision of tke taxonomy oi" tke genus Daphnia (Crustacea : DapknJae) i
South Eastern Australia, Australian Journal of Zoology, 25, (371-98), 1977.
H i c k s . D . B and Q.J. StoLer., Monitoring of constructed wetlands for wastewater. In: D.B. Hicks and Q.J. StoL er. Constructed wetlands for wastewater treatment: Municipal, industrial and Agricultural, Lewis Putliskers Inc., Ckelsea, Mickigan., pp 477-455, 1988.
Howard-Williams. C., C cycling and retention of N and P in wetlands: a tkeoretical and applied perspective. Freskwater Biol. 15:391, 1985.
Jacoksen. B.N., Effects of stormwater disckarges to small lakes. In: G.A. Moskiri (ed.), Constructed wetlands for water quality improvement. Lewis Pukliskers, 1993.
Knigkt. R.L, R.W. Rutle, R.H. Kadlec, and S. Reed., Wetlands for wastewater treatment: performance datakase. In: G.A. Moskiri (ed.), Constructed wetlands for water quality improvement. Lewis Pukkskers, 1993.
Kusler and Kentula., Wetland creation and restoration: Tke status of tke science. Island Press, Waskington D.C., 591, 1990.
Lindsay. A.L., Ckemical equilikria in soils, Wiley and Sons, New York,
1979-Livingston. E.H., Use of wetlands for urkan stormwater management, In: R.K. Olson (ed.), U.S. EPA, Created and natural wetlands for controlling nonpoint souxce pollution. C.K. Smoley, 1993.
M a n a k a n . S.E., Environmental Ckemistry 5 Edition, Lewis Pukliskers, Mickigan, USA, 1991.
Mitsck and Gosselink., Wetlands, Van Nostran Reinkold, New York, 1986.
Neckles. H.A, H.R. Muxkin, and J.A. Cooper., Influences of seasonal flooding on macroinvertekrate akimdances in wetland kakitats., Freskwater Biology, 23, pp 311-3 2 2 , 1 9 9 0 .
Nuttal. P.N., Uptake of pkospkorus and nitrogen \iy Myriophyllum aquaiicum (Velloza) Verd. growing in a wastewater treament system. Aust. J. Mar. Freskw. Res., 36, 493-507, 1985.
O'Neill. P., Environmental Ckemistry, George Allen and Unwin, London, 1985.
Pullin. B.P, and H a m m e r . D.A., Aquatic plants improve wastewater treatment, Water Environment and Tecknology, Marck, 1991.
Rickardson. C.J, and C.B. Craft., Effective pkospkorus retention in wetlands: fact or fiction, In: G.A. Moskiri (ed.). Constructed wetlands for water quality improvement. Lewis Putliskers, 1993.
Seg'arra-Garcia. R, and V.G. Loganatkan., Stormwater detention storage design under random pollutant loading. Journal of water resources planning and management, vol.
118, No. 5 , 1 9 9 2 .
Tckokanoglous. G., Constructed wetlands and aquatic plant systems: Researck, design, operational, and monitoring issues. In: G.A. Moskiri (ed.), Constructed wetlands for water quakty improvement. Lewis Pukliskers, 1993.
ValcarreL M, and M.D. Luque de Castro., Automatic metkods of analysis, volume 9, Elsevier, 1988.
APPENDIX A
APPENDIX B
MAP OF SHANKLAND WETLAND
Figure
WETLAND S I T E AND C O N S T R A I N T S
KEY FOR MAP OF SHANKLAND WETLAND
SITE DESCRIPTION
1 SWD FROM ROXBURGH PARK
2 SWD FROM MEADOW HEIGHTS
3 COMBINATION OF BOTH SWD{s)
4 ENTRANCE OF WETLAND
5 END OF WETLAND
6 UPSTREAM YUROKE CREEK
7 EXIT OF WATER FROM WETLAND
_ Sfiice o( Sulla ; C i t y o f Sroai 7 \ \
I I \ ^^r
1 1
•• \\ i //
^ A N K 3 0 4 9 ;
iJMtM
I ^ ' f ^ Tj A/APPENDIX 1
i s i r r - E S X T S o . :7 3
^ S X T E n 2 O .
o - 3 2 i O . 3 3 i
3 1 S X T S A
O . 5 - 7 i
i S I T S O . ^ <3 i
J S X T E e i s X T E
o . -T-a; O - 3 2 5 ;
o . 5 9 . O . s i
"7 i S X T - E
O . 4 . «
S D o . o i ;
o , s a ^
o . 4. a i o . o 1
0 . 4 . © ;
o . 2 i o . 2 X
O - 2 S
O . o © 7 i I S / A / S l A
O . o 3
0 . 0 0 - 7 1
O - O 3. : O .
O . 4 0 . 2 2 O ^ O i
O . 2 0 s i 0 . 2 3 O . 00-7- i O . O O -T- i o . a o - 7 : G> . S S
o . o <3. o . 2 3 i
o . o s I
m&Bki-i
o - 3 i o . O S i
0 . 3 4.! o . 3 3 i
0 . 3 a. I o . 3 S i
o . 1 -7 i o . 2-7 I so o . o 2 i
O - ^ ^ I O . 3 3 s i o . O X i
o . 3 1 I
0 . 2 1 O . 2 i
O . 3 S O . O 1 i
S E 0 . 0 1 ! O . O O i
0 . 0 1
O . 2 3 j 0 . 2 ; O . 3 3 I 0 . 1 : O . 2 S j
O . 0 2 i
0 . 2 3 O . 0 0 - 7 : 0 , 0 0 - 7 1 0 . 0 2
O . O 3 I O . O 3 O . 0 1 1 o . 0 1 i 0 . 0 2
1 . 3 i 1 . 1 3 I 3 . 5 1 i
O , -T- i 1 . 1 9 !
O . 3 7 i o - 4 -7 i
0 - 2 3 1 - s s i 3 . S 2 i
O . 3 -7 i S D O . 2 1 i
1 . 1 S !
O . 3 S i O . 3 i O . 4.-7
0 . 0 1 !
• O . 3 S i
0 . 2 1 O . 3 -7 S 1
o . 04,;
O . 2 9 O . O 1 i o . O 1 j
0 . 2 2 0 . 0 1 S E 0 . 1 5 1 0 . 0 0 7 • 0 . 0 3 ; 0 1 0 . 0 0 - 7 ) 0 . 0 0 - 7 ' Q _ 0 n 7 i
' i • i ; , .. 1 S / 4 . / 3 4 , ; i i : 1 1— :
n 1 1 1 . 2 S i 0 - 3 1 ! 3 . - 7 1 1 . 9 3 1 0 2 6 i 0 . 1 3 I 0 . 9 1 0 . 4. 1 11 2 1 . 3 i 0 . 2 3 1 3 . 9 1 1 . 9 : 0 2 -7 i 0 . 1 S 0 . 9 i 0 . 4. 3 m e a n 1 , 2 S i 0 . 2 9 S i 3 . S i 1 . 9 4 . : 0 . 2 S 5 ! 0 . 1 - 7 0 . 9 1 0 . 4. 2 S O 0 . 3 ; 0 . 0 2 : 0 . 0 1 ; 0 - O S . 0 0 1 i 0 . 0 1 0 • 0 . 0 1 S E 0 . 0 2 ! 0 - O i l 0 . 0 0 - 7 ' 0 . 0 4. 1 0 . 0 0 "7 i 0 . 0 0 V 0 ; 0 . 0 0 7 is>/-a/s><i ; ! 1 i j i n 1 0 . S 3 i 0 . 1 9 ^ 0 . 1 9 i 0 . 2 4. i 0 2 3 i 0 - 1 S j
0 . 2 2 i 0 . 2 3 n 2 0 - S i ; 0 . 1 3 1 0 . 1 9 i 0 . 2 i 0 2 3 i 0 . 1 7 1 0 . 2 1 i 0 . 3 m e a n 0 . 6 2 ! 0 . 1 S S i 0 . 1 9 i 0 . 2 2 i 0 . 2 3 i 0 . 1 s I 0 . 2 1 S i 0 . 2 9 S D 0 - 0 1 ; 0 . O i l 0 1 0 . 0 3 ; 0 1 1 0 0 ! 0 . 0 1 i 0 . 0 1 S E 0 . 0 0 i 0 . 0 0 - 7 j 0 i 0 . 0 2 ! 0 j 0 . 0 0 7 0 . 0 0 7 ! 0 . 0 0 7
1 ! i ! i i i : 2 0 / 4 . / 3 4 . ! 1 i : 1 i n 1 0 - 2 9 i 0 . 2 1 : 0 . 2 3 : 0 . 2 S i 0 . 3 7 ! 0 . 1 3 i 0 . 1 7 ; 0 . 1 7 n 2 0 . 3 1 0 . 2 2 ; 0 . 2 1 ! 0 . 3 ! 0 3 5 . 0 . 1 4. 0 . 1 3 1 0 . 1 9 m e - a n i 0 . 3 ! 0 . 2 1 5 ! 0 - 2 2 i 0 . 2 3 : 0 - 3 S, ! 0 . 1 3 S i 0 . 1 7 5 i 0 . 1 3 S D ! 0 . 0 1 i 0 . O i l 0 . 0 1 1 0 . 0 3 1 0 . 0 1 i 0 . 0 1 1 0 . 0 1 i 0 . 0 1 S E i 0 . 0 0 -7 ! 0 . 0 0 -7 1 0 . 0 0 - 7 ! 0 . 0 2 ! 0 . 0 0 -7 1 0 . 0 0 7 i 0 . 0 0 7 i 0 . 0 0 7
APPENDIX 2
j n - r i i 3 9 S . 6 6 9 . O 2 : S 5 S , ^ S i • 3 O O O i 3 S 6
2 i X O 9 . 0 7 - i 3 X 3 . X s i 2 2 s A S ITa^eiT-i I 8 9 3 . S 2 1 S 7 X . 3 S i S 6 X O O i 3 ^ O . " 7 x 1 3 S S 0 9 i
X 0 3 0 0 i 3 X S A S ! 2 2 A A 3 S O I S . 3 2 i 3 . 3 ] S . ^ 3 ! X O o i 0 - 3 i x s x o o i 3 2 3 i 2 . 3 S E ! •a. . S 2 i 2 . 3 3 ; • i . S 5 i O . 7 - x ! 0 s A : X . 0 " 7 ! 2 2 3 i X 9 S
x 3 / d . / 9 - 3 . i 1 j i :
n X ! 3 3 4 . S . O . i X 6 5 ^ i • 7 0 S . S i S ' 7 X . - 3 . - 7 ! 3 9 - 7 _ 0 S i X S 0 . 3 7 - i S 5 S
- X ; 2 3 S 0 3 n 2 3 3 S O - s i X S 3 9 . 3 i • 7 X 2 . S i S 3 X . i l ! 3 3 2 0 X i X - 7 X . X 3 1 S A S 2 3 ! 2 3 3 3 X m e ai n 3 3 ^ 3 ; X S S . 9 1 X O . <S S i 5 - 7 S . A ^ i 3 3 9 S A i X s s . -7 S 1 5 S X X V • 2 3 A S - 7 S O , 3 . - 7 3 1 X O . O S i 3 . O A i • 7 . 0 2 ; X 0 S A i •7 . S X ; s 9 3 ; X 9 2 S E 2 - S <1. i . X 3 2 . X 5 ; ^ . 9 S : • 7 S 2 S . 3 3 i A 9 A i X 3 S i ' : i i 1 :
X 9 / ^ / 9 A i • ^ : i i i
n X X 3 " 7 S . - T - i X 1 9 X ; X 4 X 6 . X i 3 3 2 . 3 - a i A O S s A ; 3 S 2 - S 1 3 S S " 7 S i 3 S S A 3 n 2 X 3 - T - O . X ! X s o o i X ^ 2 O . 2 1 3 9 X . X 2 i A X X - 3 2 i 3 A 9 . 9 - 7 1 3 S 0 S 6 ! 3 S 0 • 7 3
a n ! X 3 - 7 3 . i X 9 S . S 1 X i X 3 . X i 3 3 6 . " 7 3 : A O S S 3 i 3 S X . 2 9 1 3 3 3 _ X S i 3 S 3 0 3 s n • a . « . a i S . A - i i 2 . 9 X 1 e . 2 X 1 A - A A i X . 3 S i 3 _ S S ! 3 _ 3 2 S E 1 3 . 2 3 i - i . S 5 i 2 . 0 6 1 ^ . 3 9 ! 3 X A i X . 3 2 1 2 - : 2 _ 3 S ^ i • i i i i 1 1 2 0 / - a . / 9 4 . 1 i ! i i i •
n X ! 9 . s i 2 S 4 . S i X - a . O O . 2 1 3 X S . A S i 3 S S . 9 9 i X 3 A . S 9 i 3 2 A . X V • 2 9 A - S A m 2 1 9 9 O . ^ S . 2 S 3 O . X i X O 3 . 2 1 3 2 0 . 2 X i 3 9 0 . 6 2 i X 3 A . 0 2 j 3 2 S S 3 1 2 9 A . S A
1 9 S - T - . A 3 1 2 S 3 - 7 - . S i X ^ O X - T ' 3 X 3 . 3 A 1 3 3 3 3 X ; X 3 A . 3 S i 3 2 S 3 S i 2 9 A . S A S O j ' I . 2 X i X O . S 2 i 2 . X -a. i 2 . S S i 3 . 2 - 7 i 0 . AT- j X - S - 7 i 0 S E ! 2 . 9 3 i • 7 . A A i X . S X i X . S - 7 i 2 . 3 X I 0 . 3 3 i X - X S i 0
1 9 e - r . 2 I 3 S 9 I
3 S 2 X . i l i 3 9 S >
3 S 3 - X i 3 S O - S 2 !
X -a X . "T" A i : S T' . T- 9 ! X a a . x - 7
T n i a a n x g - 7 - 3 . 3 ! a . s -4. i
3 S 3 S . x i X 3 9 7 . s ! 3 S X . 9 2 i X 9 - " T - S I
X 3 . 9 S i
2 . x r 7 ! X - S 3 i
s - ^ a - x x i X - a . - a - . - T - - T - i 2 S S - S 9 . X 9 2 - 3 2 3 S O - S S i X - a . 3 . 2 6 i 2 8 S - 2 a . i X S - T - . 2 S
APPENDLX 3
n 1 i A 4 - 3- \ 3 3 . -i 2 1 5 3 . X 6 ;
3 9 •3. S . -1 -i . "7 S 1 2 ^ . a -7 ! 3 X . 6 7 1 X 9 . 5 n 2 ; •a. s - s i 3 O . X 2 i s a . 2 X I 3 2 . e 2 1 ^ o . a 2 ! 2 O . 9 i 3 5 . 6 2 1 2 5 . S 2
! •a 6 -3 S 1 3 X - V7- i S S . S 9 i 3 6 . O S i •a- 2 . T' 9 i 2 2 . a 9 i 3 3 . 6 S i 2 2 . S 6 SD i 3 . X e i 2 - 3 3 | 3 . S-7 i _ a s i 2 . a i 2 . a i 2 . 7 9 ! a. . 3 3 SE = -2 5 i X . 65 S i 2 . 3 2 ! 3 _ -i 3 ! X . 9 V X . 9 a i X . 9 7 ! 3 . O 6
i i
n 1 i a s . <s s i a 1 X 2 S 1 7-7 _ •7 3 i 2 a . 9 ^ • •7 . S 3 : 3 O . 7 i X 9 . 9 T -n 2 9 2 . X 9 i o i X 2 O . S 2 1 7 9 3 T' : 2 3 . O S i X O . X X ! 3 3 . x ; 2 S . 6 2 mean 9 O . 9 2 i o i X 2 2 . a X , 7 a S 5 : 3 X ) 3 . a 2 :
3 -i . J. i 2 2 . a SD 1 - a i O : 3 . x ; 1 . s 2 - 9 : X - 3 2 i 5 . 2 3 1
SE X . 2 -7 i O : 2 . X 9 ^ o S 2 2 . O S ; X - 2 9 3 - 7 •: 2 -a 3
I •
i i ; , ! : 1
n X i s . 3 2 i O ^ • 7 . 2 5 ! 2 e ^ S i 2 -7 . 9 s : 9 . 4 1 2 3 . S 4 i X 3 -6 7 n 2 1 o . S 2 i O i a . 3 2 1 3 o . 9 9 i 2 S . 2 X i X 3 . s ; 2 O . a. S i X 6 . ~ 2 mean 9 . > O : •7 . 7 9 i 2 a _ a a 2 S . 5 9 ! X X . 5 ] 2 2 i X 5 . 2 SD 1 . 6 3 1 O i O . 7 cS i 2 9 9 I X . 9 4 i 2 . 9 7 ^ 2 . X a 1 . X 6 SE I 1 . X S ! o i O . S ^ ! 2 . X X ; X . 3 i 2 . X i X . 5 4 ! X . S 3 1 i i i i i i i
i 1 ! i : 1 ! n i X s - i O i X 9 . 2 S i S S . •7 A i s 2 . ^ X ; X O . 3 X ! d. 7 . 9 3 i 2 2 . •tt 6 n 2 1 X 9 . a a i O 1 2 S . <3 X j s o . X 3 • S 9 . 2 X j X 3 . X ; 5 O . 7 X j 2 S . S 2 mean XT- . 3 9 ! O i 2 2 . ^ 3 i S 2 . 9 A i SO . a X1 X X . 7 X i d,9 . 3 2 1 2 3 . 9 9 SO i 2 . 3 9 i o i 4. . S i 3 . 9 "7 1 2 . 2 <S i X . 9-7 • X . 9 7 ; 2 . X 6 SE i 1 X . <3 9 ! o i 3 . X 3 1 2 - a X i X . s : X . 3 9 i X . 3 9 i X . S 3 i i i ; i : i i
! 1 i i i ' i n X i - •7 s i o i X O - 2 S ! a. 3 3 9 ! S 3 , 3 i a . 9 s i 3 6 . 6 X • X -7 . a. 3
APPENDIX 4
1 T O T A L O X X P I S E D ! • m<3r/x.
n x t s ^ O G E N ^ r I s y A / 9 4
i S X T E S X T S i SXI-E S X T S
n x a . Q a i X-7 - X5i x a . 15 4 i : S X T E S I SX-XE i SXT?S x a - V 3
x a . as; x & - 3 x a - ! m^atn. x a - 4 X
x e - s a i 2Q . QSi X-7 . Q V i
x a - -7x1 x a - sal
X 9 _ 2 -T' x a - V«I X 9 - 2.3 i X-7 . i X S .
- 3 X x a _ a3• X 9 - 3 Xi
SD Q - X 2 i o - os-j Q - 0 9 I x a . Q&j
X 9 . X9- . Q - XXi Q - X i
SE Q . 3 3 i o _ Q a 1 Q - 04 I Q . Q S ! Q - Xi O . O&i
n X i x a - 2 S X-7 - 2 2 0 - Q-7 x a 9a! X 9 S 3 i 2 4 S-7 X 9 . 3 9 I X 9 - a a n 2 1 x a - 3 4 X-7 - S X 2Q _ X X x a _ a a 1 X 9 s a i S X X 9 - 4 2 1
mea.n i x a - 3 X-7 - 5 2 2 0 0 & X S _ 9 3 i X 9 s-xi 2 4 5 9 X 9 4 X ! X 9 a s SD ! o . O S O - X 3 O _ 0 3 O O -7 ! O 0 4 i O O 3 O O 2 I O 0 4 SS o . © 4 O • o s> O O 2 o O S 1 O C 3 i O 0 3 i O o X O o 3
i i i 1 : : i
^ ' • - i ! ! 1 1 ! i 1 n 2. i i v . S O x-7 2 9 ! X 9 4 9 i 2 O 2T' I X a 3 a 1 X 9 . s 2 2 o <S n 3 i x-7 . S 3 x-7 QX X-7 _ 3 2 X 9 _ 4-7 i 2 O X4[ X a 4 3 i X 9 s s 2 2 OX raea-n 1 X-7 . S 5 X -7 - a X X -7 3 X X 9 4 a i 2 O 2x1 X a 4 X i 1 X 9 s a 1 2 2 O 4 SD ! O . O 2 i a - o <s 1 o _ 0 2 i o _ OX i O _ o 9 i o O 4 ! ' o O 4 1 O 04 SE ! o . O X ! o _ 04 i 1 o ox 1 O o X ; O O 6 i o O 3 i o O 2 I o O 2 i i ! i !
1 3 / 4 / 9 4 i i ; ^ i ;
n i i x-7 . 9 s ! X a o s ! 2 O - 9 9 ; X 9 7 2 i 2 O 3 3 j X s _ 9-7 i x-7 2 S ! XT' S4 n 3 1 X 3 . O 2 ! X a _ X X i 20 _ a 2 i X 9 _ a X 1 2 O 3 S j XT' 0-7 i XT' 3 2 i X T- 4 9 rao a-rt i & & ! X a - o a i 2 O _ 9 X i X 9 _ -ZT' i 2 0 _ 3 s : X-7 O 2 1 i X T" _ 2 9 1 X-7 S 2 SD i O . o s i o _ O 4 i O _ X 2 O _ O S i O _ o 2 i o O -7 O O S i o O 4 SE i o ^ O 4 O O 3 i o O 3 i O o 4 ; o - o X : o O S i o O 4 1 o O 3
S ! i i ; : i i ! 1 i i 1 1 ! n X X s . S 4 1 x-7 -7 S> X S 4 X j X 9 -7 X i X s - -i 1 X 9 •7 2 X 9 _ XX i 2 O _ a 2 n 2 i X a . 4 S> i X-7 7x1 X<S s a 1 X 9 - s s i X s - 3 a i X 9 s a i X 9 X 9 i 2 O 7 3 X a -5 2 ! X -7 _ 7 5 ! X6 - s ; X 9 . -7 i X s _ 3 9 i t 9 . -7 ! X 9 X s i 20 _ T? a SD i o . O 4 i o O 6 i o X 2 1 o O 2 i o O X 1 O _ O 3 o O s ; o _ O s SE i o . O 3 i o _ O 4 O _ o a i o o x i o O X i o - O 2 i o - O 4 i o O 4 i i 1 i i : 1 i 2 0 / 4 / 9 4 ! : 1
n X i X s . a s 1 X -7 X S i X-7 3 X i X 9 s s ; X 9 - 2 X ! x-7 - O X X 9 - 4 6 i X s - 9 S
n 2 X 6 . •7 -7 X-7 _ O 2 X-7 3 9 X 9 '.Si X 9 - 3 -7 i X -7 X 2 i X9 5 2 i X T- O -7
X s . S X 1 XT' 0 9 i XT' 3 S i X 9 5 3 i X 9 - 2 9 i X 7-- OT' 1 X 9 - 4 9 XT' - OX
SD ! o . o <s ! O _ O 9 ! O o s i o _ 04 i o - X X i O O S i o 0 4 i O o a SE i o . O 4 j o O S i o _ 04 i O - O 3 i o o a j O O S i O - O 3 i O - o s
i i 1 i i i 1 i 2 X / 4 / 9 4 i i i j i i 1 n i i X a . 2 a i x-7 2 S i 20 _ 9 9 ! X 9 X 2 j X S - X 2 i X s 3 2 1 X S - 9T' i XT' - 3 9
r. 2 i X a • 3 3 i x-7 2 4 1 20 a -7 i X 9 X 3 i X s - X-7 i X s - 2 a i X s - O S i XT' - 4 3
inaa,i-i i X a . 3 X 1 X -7 2 S i 20 9 3 i X 9 X 3 i X s X S i X s . . 3 j X s - O X ! X-7 - 4 X
SD i o . 0 4! O _ ox i O o a 1 o O X j o - O 4 i O - O 3 ! O - O S i O - 0 3
APPENDIX 5
n ! . S . S . I 0 . 1 -79 . -Zl
s s - o x i •7 a , a s i 3 - 7 . . o x i _ 2 <5-r » . 2 . i 5 3 X - X 2 a 3 . o s > l S X . _ 2 X - l •7 0 _ x x i 3_-7 2 . a . 3 1 3 9 . 2 S i <S-0 - 5 9
xn«2»-c»r3t. ! 0
- a - x - x s i S 3 _ X X i • 7 4 . -7 i 3 _ - 7 « . . . ^ y i 3 & . X 3 ! 6 - 2 _ 4 . . 3 S D . i 2 — 0 . - " 7 9 i 2 . ..-7 S-i 2 - . . S . 9 i - X . V i S i 2 - , 6 S . E . i 3 S . S . i 0 - 5 S . ! X . . S > 4 i 3 9 ^ 4 . - 3 6 . i 3 .. S 4 i X _ X 2 . i 3 9 a ' ! i i : i i :
i i i i ! n X . i _ a i a s i - o a _ 4. i 3 X 2 _ 4 . i 4 a _ - 7 a i 9 3 - . a 3 ! 4 0 - . 9 ; 6 6 - 9 2 n . 2 . i a s 3 2 X - 2 9 i 3 X S - • 7 9 i 4. = i .. ^ -1 1 9 C L - a 9 i _ »S.S i 6 9 — 0 a m ^ e a - n . j 3 . S - 7 . 9 2 ; a -7 3 S i 3 X 9 . 3 S i 3 X 4 . X i 4 -7 I 9 2 . 3 6 ; 4 2 . 7 S i 6 S
s o 2 _ 4 S ! 2 - -7 S i 2 _ 4 i 2 - s 2 1 2 _ 0 a i 2 _ s s l X - S 3 S E . ; 3 . 3 - 2 ! X _ •7 3 i X - 9 4 i X _ "7 j X - 7 a Q O 1 X _ 4 - 7 i X _ a s ; 3 a a
! i i i i i 1 i
X 9 - a . X s> ! i 1 ! ! i
3 . 1 O - O -7 3 4 3 9 2 _ 3 i 3 "7 _ 4. 2 i a x _ x - 7 1 X 4 a _ a i X 2 9 - S i X 2 - 7 - 3 n . 2 . 1 3 - 3 . - a i -7-7 _ 3 2 j 9 0 - X 2 i 3 a _ s s 1 a < s - 2 3 i X 4 . 4 . _ - 7 < s i X 3 2 - x ; X 3 0 _ 6 • t n - ^ e u r v 3 - 0 . _ 3 . 3 L i •7 s 3 a 1 i 9 X - 2 X i 3 - 7 _ 9 9 i a 3 _ "7 i X 4 < s - -7 a i X 3 0 - a 1 X 2 a - 9 5 S D 1 0 - s a l 2 •7 S 1 i X - S 4 i 0 - a x i 3 - s a i 2 _ a s i X - a A i i 2 - 3 3
S E . i 3 - 3 . 2 1 X 9 S i i X - 0 9 ! 0 - s - 7 : 2 _ 5 3 i 2 - 0 2 ! X - 3 X . 6 S
i 1 1 1 i 1 !
2 . 0 / 4 / 9 4 i 1 i ; ! 1 i 9 2 - X 9 1 4 i S 2 a i 5 X - s a l X 2 . 9 S i X 2 - 7 - S 1 2 x 0 - s 1 « s - 4. 1 x a 4 . - 9
n . 2 1 9 S _ 2 3 . i 4 0 3 X 1 S 3 - < 3 x ; X 0 - 9 2 ; X 3 0 - X 2 j 2 X S - -7 2 i <S& - X X X 9 0 - a X 9 4 _ 2 { 4 3 - 3 S 2 _ S 9 j X X - 9 4 ! X 2 a . a x j 2 X 3 - X X i • s s - 2 9 i X a T - . S S
S D i 2 . 3 4 4 2 2 X - 4 S i X - 4 4 j X - a s i 3 - S 9 i 0 _ 2 S • 4 - x a S E 1 2 , 0 X 2 9 a i X . a 3 ! X - 0 2 i X - 3 x i 2 . S X O . x a i 2 . 9 6
1
! 1 i • 1 ;
i i i i r
!
n . a . 2 X - x a •7 s i 3 - 7 - 3 x ! 9 0 - V 2 i • 7 3 - X 9 i X 2 9 - 9 i 6 4 . 6 a 1 9 9 . -7 a
n . a i 2 2 - X 3 j i ^ s & 2 3 a - 2 3 1 9 6 - 2 9 i - 7 0 - 2 3 1 X 3 3 - 9 - 7 j ! 6 0 - 4 S ! X O 3 - 6 2 2 X . S S j • "7 S 3 X 3 - 7 . •7-7\ 9 3 - S X i •7 X - X ! X 3 X - 9 4 i 6 2 . 5 ' 7 1 X O X - -7
s o I 0 . « V i i 0 4 4 0 . s s l 3 - 9 4 1 2 - 0 9 i 2 - a a 1 1 2 - 9 9 ! 2 - - 7 2
S E ! 0 - 4 - 7 ! i 0 - 3 X 0 . 4 s ! 2 - " 7 9 i X . 4 a 1
APPENDIX 6
:n 2. ! O - i s 4 I o -5 3 2 ! O _ 2 O A i 0 0 a X i 0 - 0 2 ! 0
1 2 5 9 i 0 .
!
XT' X i 0 2 X s ;n S 1 m«a.i-i ! O . 1 o - 5 x a i O - 2 X X i 0 0 a 3 i 0 o x a i 0 2 2 9 i 0 -X a 9 1 0
o . i s 9 i o - S 2 S j o 20 a i 0 0 a 2 i . 0 0 X 9 i 0 2 4 J. i 0 - X a t 0 2 X 9 SD 1 O . O Q v ! o - ox 1 o o o s 1 0 0 0 X ! 0 0 0 X I
0 0 2X ; 0 . 0 3 ) 0 0<D a. s s ; o . o o s i o - ao-7 > Q O O ^ 0 0 0 X ' 0 0 0 X : 0 OXS 1 0 . 0 0 9 i r» 0 n ^
! ! ! ' 1 : i
1 i ; ; ^ i ; ;n i i O . 2 -a i o - O S X i O - 0 0-76 1 0 0 3 ^ i 0 22-i i 0 . X ^ ! 0 X 3 -7 'n 2 i O . 2 i X i o - o a 9 i o a ^ X i 0 0 9 9 i 0 0 s 2 1 0 2 s X : 0 . X 3 S 0 2 0 X
mejari O - 2 2 S i o -O 3 S i o - a A 3 i 0 0 a a : 0 0 4 3 1 0 2 A 3 j 0 . X 3 a 0 X <S 9 SD o . o 2 X : o -o o s : o 0 0 2 ; 0 0 X S i 0 0 x 3 ; 0 0 2 6 , 0 . 0 0 a. 1 0 0 O. 5 SE O - O X s i o O O -i o _ 0 0 X i 0 _ 0 X X 1 c 0091 0 0 X a 1 0 . 0 0 3 ; 0 0 3 2 • i i i : i i i
i i i i 1 j 1 n a. i O . O -a. i o -O 3 i o X 3 i 0 X 5 2 i 0 2 X S i 0 X s a 1 0 . X 2 S i 0 X ^ 3 n 2 i O - X X ! o -O S S ! o -x s a 1 0 _ X 2 3 i 0 _ 2 3 <S 1 0 X -r 3 i 0 . X A 3 i 0 X3 2I m«aLri i O - O s i Q O S X i o X s <s ; 0 X 3 a i 0 _ 2 2 S i 0 X -7 X ; 0 -X 3 S 1 0 X 3 a so ; O - O 4. 9 1 o - o X X; o _ 0 XX ; 0 0 2 X : 0 _ 0 X A i 0 _ 0 0 4 i 0 . 0 X 2 i 0 0 0 a SE O . O 3 S i o a o a i o 0 0 a i 0 0 X 5 • 0 - 0 X ; 0 0031 0 . 0 0 a 1 0 0 0 6
' ' i i i 1 ! I 20/A/9-1 i : ; ; i 1
n 3. ! o . o s 1 o o S 2 ! o Q -7 9 i 0 2 3 X ; 0 2 X ! 0 _ X 0 3 1 0 - X s : 0 a -r n 2 : O - O S 2 i o O -7 X 1 o _ 0 a 3 i 0 2 0 X i 0 2 S X ; 0 XX a : a . 2 0 9 : 0 - X m^ajn. i O . O 5 S i o _ o S 2 ! o _ a a X ; 0 - 2 X S ! 0 -2 S X 1 0 X X X i 0 . X a s i 0 0 a s SD i o . o o s i o OX3 ! o _ 0 0 3 1 0 _ 0 2X i 0 0 X -a. i 0 _ 0 XX 1 0 -0351 0 _ 0 2 X SE i o . o o s i o _ O O 9 i o _ 0 a 2 i 0 O X S i o . o x i 0 -0 o a i 0 -0 25 i o _ O X S i j i i i ! ! 1
t I 1 1 1 ! ! n i ! O - O 2 A i o X O 2 i o 0 s s i 0 - X S i 0 -X X 3 i 0 -x s a i 0 -X S 9 1 0 . 3 n 2 i O - 0 2 V t o X 2 3 i o _ 0-7X i 0 - XS-a ! 0 -X 2 x i 0 - X ^ 2 i 0 -X S 3 i 0 - 2 a X mosLri i O . O 2 <S i o X X 3 i a 0 s ^ i 0 _ X S T- i 0 X X-T' i 0 . x s i 0 . x s x i 0 - 29 X SD 1 O . O O 2 ! o O X 5 1 o 0 XX i 0 _ 0 0 11 0 0 0 S ! 0 -0 X X i 0 . 0 0 3! 0 - 0 X 3