Cancer Management and Research 2018:10 5479–5490
Cancer Management and Research
Dove
press
submit your manuscript | www.dovepress.com 5479
O R i g i n a l R e s e a R C h
open access to scientific and medical research Open Access Full Text Article
miRNA expression profiles in Smad4-positive
and Smad4-negative SW620 human colon cancer
cells detected by next-generation small RNA
sequencing
Wei Yan Zhongcai Liu Wenchao Yang Guoyang Wu
Department of General Surgery, Zhongshan Hospital, Xiamen University, Xiamen, Fujian 361004 People’s Republic of China
Background and aims: SMAD4, as a tumor suppressive gene in human colon cancer, inhibits
the metastasis of colon adenocarcinoma cells. However, the molecular mechanisms are unclear. miRNAs play an important role in the pathogenesis and progression of cancer.
Methods: In this study, a deep sequencing technique was used to screen Smad4-regulated
miR-NAs in human colon cancer SW620 cell line. Using a next-generation small RNA sequencing approach, we compared the miRNA expression profiles of SW620 colon cancer cells transfected with smad4 lentiviral vector with those transfected with control vector. Six samples were selected and sequenced randomly each from control group (smad4-negative cell) and Smad4 group (Smad4-positive cells). Quantitative reverse transcription-PCR (qRT-PCR) and Western blot (WB) was used to validate the results of sequencing.
Results: Smad4 reexpression significantly upregulated 43 known miRNAs and downregulated
10 known miRNAs expression. Gene Ontology and Kyoto Encyclopedia of Genes and Genomes pathway analysis of predicted miRNAs targets showed that these genes were mainly involved in protein-binding transcription factor activity, vascular smooth muscle contraction, pathways in cancer metastasis, and phosphatidylinositol 3-kinase–Akt signal pathway. qRT-PCR and WB validated the partial results of sequencing. Reexpression of Smad4 inhibited colon cancer cell migration and invasion. Smad4 reexpression increased the expression of E-cadherin (E-cad) and decreased the Vimentin (Vim) and Matrix Metalloproteinase-9 expression. Restoration of SMAD4 results in a marked decrease of Vim by inhibiting p-AKT and p-EPHA2, but signifi-cantly increased the E-cad by AKT–EPHA2 pathways.
Conclusion: Smad4 inhibits the migration and invasion ability of colon cancer cells in vitro
and this is the first report of Smad4-mediated miRNA expression profiling in Smad4-positive and Smad4-negative SW620 human colon cancer cells, which may help us better understand the role of Smad4 in inhibiting the metastasis of colon cancer cells and its possible molecular mechanisms.
Keywords: Smad4, miRNA, colon cancer, next-generation sequencing
Introduction
Colon cancer is one of the most common types of tumors in humans.1 Many researchers
have shown that SMAD4 is frequently lost in colon cancers, which is associated with the development of metastases and a poor prognosis.1,2 Smad4 mutations were observed
in 95% invasive and metastatic colon cancers.2 Many studies have demonstrated the
Smad4 pathway has been shown to mediate the antimetastatic role in colon cancer
Correspondence: Guoyang Wu Department of General Surgery, Zhongshan Hospital, Xiamen University, 201-209 Hubin South Road, Xiamen, Fujian 361004, People’s Republic of China Email [email protected]
Journal name: Cancer Management and Research Article Designation: Original Research Year: 2018
Volume: 10
Running head verso: Yan et al
Running head recto: Smad4-mediated miRNA expression profiling in SW620 human colon cancer cells DOI: http://dx.doi.org/10.2147/CMAR.S178261
Cancer Management and Research downloaded from https://www.dovepress.com/ by 118.70.13.36 on 20-Aug-2020
For personal use only.
Dovepress Yan et al
metastasis.1–3,9–15 This study and other researcher’s previous
studies found that Smad4 was associated with poor prognosis in patients with colon cancer and inhibited tumor metastasis through multiple processes, including the inhibition of apop-tosis and inhibition of the epithelial–mesenchymal transition (EMT) process, and phosphatidylinositol 3-kinase–Akt (PI3K–Akt) signaling pathway.1–3,9,15,25 However, the exact
mechanism remains unclear. Therefore, studying the role of Smad4 in tumor metastasis is essential for developing more effective treatments and improving colon cancer patients’ prognosis.
Recently, many miRNAs-related metastasis gene have been identified.4,5 miRNAs are 20–22 nucleotide endogenous
noncoding RNAs, which repress target gene expression at the post-transcriptional level and are now considered to be major regulators of gene expression for at least 30% of human genes.5–7 Functional studies indicate that miRNAs have
important functions in tumor progression, especially recur-rence, drug resistance, and metastasis.4–8 A lot of researchers
have provided strong evidence that miRNAs play an impor-tant role during tumorigenesis and tumor progression.4–8
Given that miRNAs play a significant role in gene regula-tion and tumorigenesis, and Smad4 is the central component of the TGF-β and bone morphogenetic protein signaling pathway which plays an important role in cancer progres-sion, miRNAs might interact with the Smad superfamily in tumors.6,7 Thus, we hypothesized that Smad4 may mediate the
activation or inhibition of miRNAs, which could influence colon cancer metastasis. Until now, there are no reports about the miRNA expression profile following smad4 reexpression in a colon cancer cell model. In this study, we profiled the miRNAs of the SW620 colon cancer cell line transfected with smad4 lentiviral vector, which can get stable reexpres-sion of Smad4. Fifty-three known miRNAs were found to be differentially expressed. Some of the differentially expressed miRNAs might be potential biomarkers for colon cancer. Thus, we provide a new context to study the mechanism by which Smad4 inhibited tumor metastasis.
Materials and methods
Establishment of colon cancer cell lines
with stable overexpression of Smad4
Human colon adenocarcinoma cell line SW620, which was derived from lymph node metastasis and does not express Smad4, was obtained from American Type Culture Collec-tion (Manassas, VA) and was cultured in RPMI 1640 media supplemented with 10% FBS. The full-length coding region of Smad4 gene was amplified with PCR, and the amplified
fragment was cloned into the lentiviral vector GV248. The recombinant lentiviral vector was transfected into 293 T cells for packaging the virus, which was then transfected into colon cancer SW620 cells. The stably transfected cells were selected with G418, and the cellular expressions of Smad4 mRNA and protein were detected using quantitative PCR and Western blotting (WB).
smRNA library construction and
next-generation sequencing
Six samples were selected randomly each from control group (smad4-negative cells) and Smad4 group (Smad4-positive cells), and sequenced by second-generation illumina high-throughput sequencing, screened for differentially expressed miRNA. Briefly, total RNA was collected from three pairs of Smad4-positive cells and matched smad4-negative cells by using TRIzol reagent (Life Technologies, Carlsbad, CA, USA). Qualified RNA with A260/A280 ratio more than 1.8 was subsequently assessed for RNA integrity by conducting the DNA chip assay. smRNA libraries were constructed by using a smRNA sample prep kit (Illumina, San Diego, CA, USA) following the standard protocols. Eventually, the librar-ies which were constructed from three independent Smad4-positive cells and three matched independent smad4-negative cells were sequenced by applying Illumina HiSeq 2500 (Illumina, USA) at GENE DENOVO (Guangzhou, People’s Republic of China) strictly following the standard protocols.
Data analysis
Consensus Assessment of Sequence and Variation (version 1.8.2; all Illumina, Inc.), Illumina HiSeq Control software (version 2.0.12), and Real-Time Analysis software (version 1.12.4.2) were applied to analyze the raw data. Differential expression levels of miRNA were calculated and standardized to reads per million, as follows: Counts/total count of each sample ×1 million. Target genes of differentially expressed miRNAs were predicted using the TargetScan database, miRDB database, and miRanda database, which were downloaded from http://www.targetscan.org/, http://www. mirdb.org/, and http://www.microrna.org/, respectively. The predicted genes underwent Gene Ontology (GO; http://www. geneontology.org/) and Kyoto Encyclopedia of Genes and Genomes (KEGG; http://www.genome.jp/kegg/) pathway analyses using the functional annotation tools of the Database from Annotation, Visualization, and Integrated Discovery (DAVID; http://david.abcc.Ncifcrf.gov/). The enrichment of GO terms and KEGG pathways were selected using a cutoff standard of P<0.01 and false discovery rate<1.
Cancer Management and Research downloaded from https://www.dovepress.com/ by 118.70.13.36 on 20-Aug-2020
Dovepress Smad4-mediated miRNA expression profiling in SW620 human colon cancer cells
Quantitative reverse
transcription-polymerase chain reaction (qRT-PCR)
Smad4-negative cells and Smad4-positive cells were col-lected. Following total RNA isolation, cDNA were synthesized using a miDETECT A TrackTM miRNA qRT-PCR Starter kit
(RIOB IO Biotechnology Co., Ltd., Guangzhou, People’s Republic of China). All the miRNA primers (miDETECT A TrackTM miRNA qPCR Primer Set, including 323b-3p, 323b-3p, 371a-5p, hsa-miR-708-3p, hsa-miR-6852-5p, hsa-miR-767-5p, hsa-miR-382-5p, miR-514a-3p, miR-1289, miR-1537-5p, hsa-miR-23c, hsa-miR-3199, hsa-miR-3619-5p, hsa-miR-3657, hsa-miR-548u, hsa-miR-5699-5p, hsa-miR-874-5p) and control primer (miDETECT A TrackTM U6 qPCR Primer Set) were also purchased from this company. qPCR was performed on an ABI 7500 real-time PCR system (Applied Biosystems, Carlsbad, CA, USA) according to the manufacturer’s protocol by miDETECT A TrackTM miRNA qPCR kit (RIOB IO Bio-technology Co., Ltd.). Dissociation curve analysis was used to verify the generation of single products. U6 was used as a reference gene, and all reactions were repeated three times. Data were analyzed using the ABI 7500 Prism sequence detec-tion software (Applied Biosystems) and the relative expression was calculated using the 2−ΔΔCq method.
WB
Total cell extracts were prepared in a lysis buffer (Solarbio, Peking, People’s Republic of China). After 10 minutes on ice, cell debris was removed by centrifugation at 10,000 g for 10 minutes. Protein concentrations were determined by the BCA method (Sigma, Santa Clara, CA, USA) using BSA as a control. Proteins were separated by SDS-PAGE and then transferred onto polyvinylidene difluoride mem-branes (Minipore, Billerica, MA, USA), which were treated with the appropriate primary antibodies (Abcam, UK). Antibody-bound proteins were detected by a chemilumines-cence method according to the manufacturer’s protocol (CB Company, Murray, UT, USA).
Migration and invasion assays
Human colon cancer cell line SW480, which does not express Smad4, and RKO, HCT116, LOVO, and HCT8 cell lines were obtained from American Type Culture Collection and were cultured in RPMI 1640 media supplemented with 10% FBS. Transwell Cell Migration and Invasion Assay kit (BD Biosciences, Franklin Lakes, NJ, USA) was used to analyze cell migration and invasion ability strictly follow-ing the standard protocols. Generally, a transwell chamber
was placed into a 24-well plate and was coated with 30 µL matrigel and was incubated for 40 minutes at 37°C for the invasion assay. In both transwell assay, stably transfected cells were trypsinized and seeded in chambers and cultured, while 600 µL medium was added to the lower chamber. About 24 hours later, migrated cells were fixed with 100% methanol for 30 minutes. Nonmigrated cells were removed. Then cells on bottom surface of the membrane were stained by crystal violet for 20 minutes. Cell images were obtained under a phase-contrast microscope (Olympus, Tokyo, Japan).
Statistical analysis
Statistical analysis was performed using SPSS statistical software (version 17.0; SPSS, Inc., Chicago, IL, USA). The significant difference between the two groups was analyzed by one-way analysis of variance using paired t-test. Data are expressed as mean ± SD. P<0.05 was considered as significant difference.
Results
Stable overexpression of Smad4 in
SW620 colorectal cancer cell line
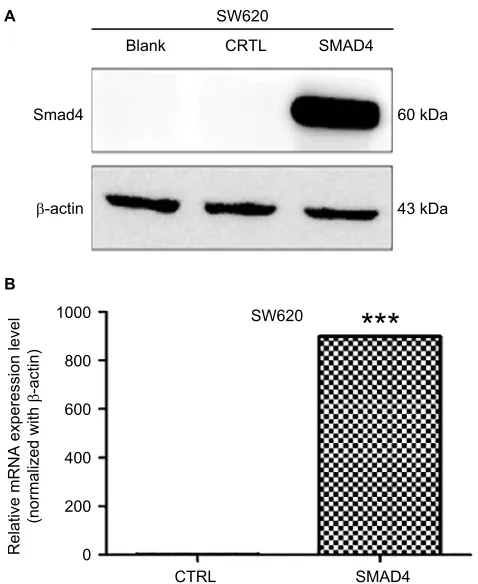
First, we chose the SW620 human colon cancer cell model, which is null in Smad4 expression. To get the stable expres-sion of Smad4 gene, we transfected the lentiviral Smad4 vector into the cells and got the stable cell model, SW620 Smad4, which reexpressed the gene of Smad4. As shown in Figure 1A, B, we performed WB and qRT-PCR and found that transfection of Samd4 activated the reexpression of Smad4.
miRNA expression profiles following
stable Smad4 re-expression
To identify the difference in miRNA expression in control group (smad4-negative cells) and Smad4 group (Smad4-positive cells), we used the second-generation illumina high-throughput sequencing technology and screened differentially expressed miRNAs. We found that 53 differentially expressed miRNAs (including 43 upregulated and 10 downregulated known miRNAs, respectively) in the SW620-Smad4 cells in contrast to the SW620-control cells. Table 1 summarizes the 53 miRNAs that show the significant differences. We also found the novel differentially miRNAs expression profiles of the two cell lines, which is shown in Table 2, especially, m0099-5p, m0100-5p, m0101-5p, novel-m0102-5p, and novel-m0103-5p were reduced by about 63 times and m0188-5p, m0030-5p, novel-m0227-3p, novel-m0228-3p, and novel-m0251-5p were increased by about 8, 16, 23, 23, 10 times, respectively.
Cancer Management and Research downloaded from https://www.dovepress.com/ by 118.70.13.36 on 20-Aug-2020
Dovepress Yan et al
Validation of differentially expressed
miRnas
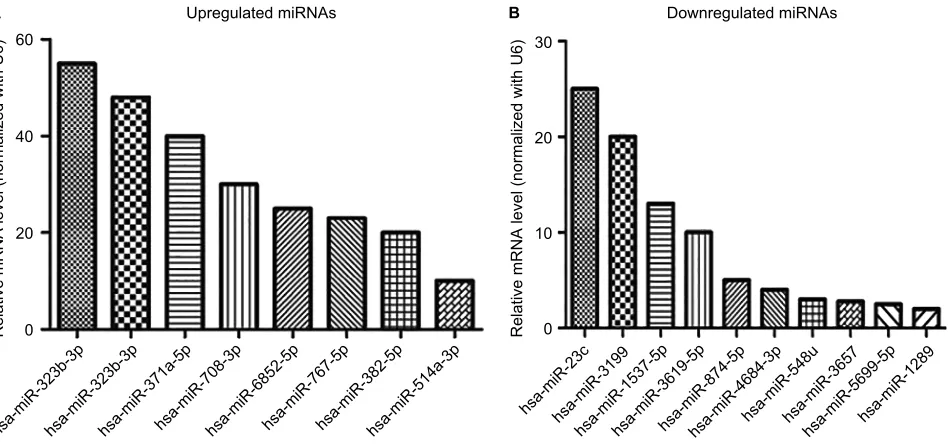
miRNA-specific qRT-PCR was performed to validate the differentially expressed miRNAs. As shown in Figure 2A, the expression levels of hsa-miR-323b-3p, hsa-miR-323b-3p, miR-371a-5p, miR-708-3p, miR-6852-5p, hsa-miR-767-5p, hsa-miR-382-5p, and hsa-miR-514a-3p were significantly upregulated in SW620-Smad4 cells, whereas, as shown in Figure 2B, miR-1289, miR-1537-5p, hsa-miR-23c, hsa-miR-3199, hsa-miR-3619-5p, hsa-miR-3657, hsa-miR-548u, hsa-miR-5699-5p, and hsa-miR-874-5p were downregulated. These findings are consistent with the results of the miRNAs sequencing results.
GO analysis of predicted target genes of
differentially expressed miRNAs
To investigate the potential predicted target gene enrichment in cellular component (Table 3), molecular function (Table 4), Figure 1 Validation of Smad4 reexpression in Smad4-negative SW620 cells by WB and qRT-PCR.
Notes: (A) Expression of Smad4 by WB. Blank: null SW620 cells. CTRL: empty vector-infected SW620 cells. SMAD4: Smad4 vector-infected SW620 cells. β-Actin was used as an internal control. (B) qRT-PCR detection of Smad4 mRNA expression level in SW620 cells following Smad4 reexpression. ***P<0.001.
Abbreviations: qRT-PCR, quantitative reverse transcription-polymerase chain reaction; WB, Western blot.
B A
Smad4
Blank CRTL
SW620
SMAD4
60 kDa
43 kDa -actin
1000 SW620
Relative mRNA experession leve
l
(normalized with
-actin)
800
600
400
200
CTRL SMAD4
0
Table 1 Differentially expressed miRNAs between stable Smad4 overexpression cells and controls (P<0.05, fold change >2)
miRNA Fold change
Type of regulation
P-value
hsa-miR-1-3p 3.0300481 Up 1.68E−05
hsa-miR-105-5p 9.63203851 Up 0.004776827
hsa-miR-1250-5p 2.76590929 Up 0.016764887
hsa-miR-127-3p 3.51000858 Up 0.017063522
hsa-miR-129-1-3p 20.2566667 Up 6.26E−07 hsa-miR-133a-3p 2.82510445 Up 0.000749984
hsa-miR-133a-5p 2.39407718 Up 0.0413216
hsa-miR-136-3p 2.87518716 Up 0.04961782
hsa-miR-139-5p 2.75808538 Up 0.039079472
hsa-miR-203a-3p 2.62724607 Up 8.05e−05
hsa-miR-203b-3p 2.68843604 Up 0.000114467
hsa-miR-3149 2.2304999 Up 0.02335124
hsa-miR-323b-3p 58.3133333 Up 8.64E−05
hsa-miR-338-5p 2.78646827 Up 0.01011844
hsa-miR-3656 3.98101266 Up 0.013411597
hsa-miR-365b-5p 23.7966667 Up 4.75e−05
hsa-miR-369-3p 4.58094845 Up 0.015997829
hsa-miR-371a-5p 41.9733333 Up 0.003763824 hsa-miR-376c-3p 2.58784235 Up 0.047594468
hsa-miR-379-5p 3.24035036 Up 0.014697283
hsa-miR-381-3p 2.17839525 Up 0.040985364
hsa-miR-382-5p 17.7724868 Up 0.013815686
hsa-miR-3909 2.02610176 Up 0.003951009
hsa-miR-409-3p 4.93321119 Up 0.009351995
hsa-miR-431-5p 3.59492282 Up 0.021180118
hsa-miR-449a 2.88279908 Up 0.01816137
hsa-miR-455-3p 2.13778874 Up 0.043774928
hsa-miR-4799-5p 20.2566667 Up 6.26E−07
hsa-miR-483-3p 4.37163969 Up 0.026865568
hsa-miR-483-5p 4.70802709 Up 0.010097822
hsa-miR-487b-3p 10.1258278 Up 0.035457763
hsa-miR-509-3p 9.46230159 Up 0.040214237
hsa-miR-514a-3p 15.8852097 Up 0.02453244
hsa-miR-548am-3p 2.49361435 Up 0.043489873 hsa-miR-550a-5p 2.05070751 Up 0.021124708
hsa-miR-656-3p 46.5566667 Up 1.21e−06
hsa-miR-6852-5p 20.2566667 Up 6.26E−07
hsa-miR-708-3p 38.0533333 Up 0.000659703
hsa-miR-744-5p 29.8433333 Up 2.92e−05
hsa-miR-758-5p 20.2566667 Up 6.26E−07
hsa-miR-875-5p 46.6033333 Up 0.000407778
hsa-miR-889-3p 2.97430749 Up 0.012912535
hsa-miR-767-5p 22.6434519 Up 0.021766387
hsa-miR-1289 2.10708403 Down 0.048014258
hsa-miR-1537-5p 12.0816166 Down 0.032522333
hsa-miR-23c 17.019999 Down 0.000233603
hsa-miR-3199 17.019999 Down 0.000233603
hsa-miR-3619-5p 8.12123642 Down 0.044123068
hsa-miR-3657 2.25696259 Down 0.029294154
hsa-miR-548u 2.16192045 Down 0.035163924
hsa-miR-5699-5p 2.59881075 Down 0.010750283 hsa-miR-874-5p 3.76411255 Down 0.007516669 hsa-miR-4684-3p 2.80937387 Down 0.03699219
Cancer Management and Research downloaded from https://www.dovepress.com/ by 118.70.13.36 on 20-Aug-2020
Dovepress Smad4-mediated miRNA expression profiling in SW620 human colon cancer cells
and biological process (Table 5), GO analysis was performed with the differentially expressed miRNAs following Smad4 reexpression. The results suggested that a lot of functional signaling pathways were enriched, including those involved in the regulation of cellular metabolic process, anatomical struc-ture development, developmental process, and regulation of
Figure 2 Validation of some miRNA sequencing results by qRT-PCR.
Notes: (A) Eight upregulated miRNAs in the stable Smad4 overexpression cells group; (B) Ten downregulated miRNAs in the stable Smad4 overexpression cells group. U6 was used as a normalization control. Data represent the mean ± SD. of three biological replicates.*P<0.05.
Abbreviation: qRT-PCR, quantitative reverse transcription-polymerase chain reaction. 60
A Upregulated miRNAs
hsa-miR-323b-3 p
hsa-miR-323b-3 p
hsa-miR-371a-5 p
hsa-miR-708-3phsa-miR-6852-5 p
hsa-miR-767-5phsa-miR-382-5phsa-miR-514a-3 p
40
20
Relative mRNA level (normalized with U6
)
0
B Downregulated miRNAs
hsa-miR-23 c
hsa-miR-3199 hsa-miR-1537-5
p
hsa-miR-3619-5phsa-miR-874-5phsa-miR-4684-3 p
hsa-miR-365 7
hsa-miR-5699-5 p
hsa-miR-1289 hsa-miR-548
u
Relative mRNA level (normalized with U6
) 30
20
10
0
Table 2 The list of differentially expressed novel miRNAs
between stable Smad4 overexpression cells and controls (P<0.05,
fold change >2)
miRNA Fold change
Type of regulation
P-value
novel-m0012-5p 11.537432 Down 0.018215425
novel-m0080-5p 29.89626 Down 1.43E−05
novel-m0084-5p 3.0550489 Down 0.022574517
novel-m0099-5p 63.828429 Down 0.00013912
novel-m0100-5p 63.828429 Down 0.00013912
novel-m0101-5p 63.828429 Down 0.00013912
novel-m0102-5p 63.828429 Down 0.00013912
novel-m0103-5p 63.828429 Down 0.00013912
novel-m0179-5p 2.8894051 Down 0.027729009 novel-m0333-3p 4.85719837 Down 0.011391107 novel-m0336-3p 4.85719837 Down 0.011391107 novel-m0246-3p 2.13677497 Down 0.020091995 novel-m0190-5p 2.88940513 Down 0.027729009
novel-m0188-5p 8.014228 Up 0.036847661
novel-m0030-5p 16.71333 Up 0.000194285
novel-m0227-3p 23.84 Up 0.001772445
novel-m0228-3p 23.84 Up 0.001772445
novel-m0251-5p 10.19173 Up 0.025869475
molecular-binding processes. In addition, the intracellular part exhibited the most increased enrichment of GO terms in Smad4 reexpression cell (Table 3).
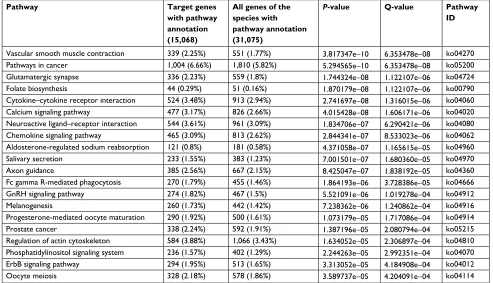
KEGG pathway analysis of predicted
target genes of differentially expressed
miRnas
KEGG pathway analysis was also performed with the differ-entially expressed miRNAs following Smad4 reexpression, which indicated that vascular smooth muscle contraction pathways and pathways in cancer metastasis were changed and corresponded to differentially expressed transcripts (Table 6).
Validation of partial sequencing data
analysis results
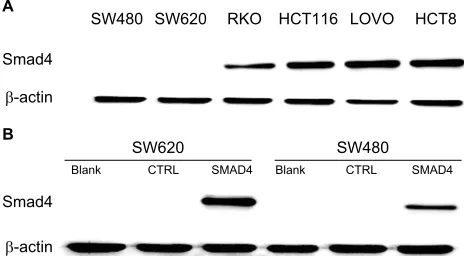
To demonstrate our hypothesis, we first screened the expres-sion of Smad4 in six kinds of colon cancer cells including SW480, SW620, RKO, HCT116, LOVO, and HCT8. As shown in Figure 3A, the expression level of Smad4 was null in SW480 and SW620 cells, whereas RKO, HCT116, LOVO, and HCT8 cells had higher expression levels of Smad4. Then, we also transfected the lentiviral Smad4 vector into the SW480 cells and got the stable cell model, SW480 Smad4 (Figure 3B). Smad4 reexpression inhib-ited cell migration and invasion in SW480 (Figure 4A, B)
Cancer Management and Research downloaded from https://www.dovepress.com/ by 118.70.13.36 on 20-Aug-2020
Dovepress Yan et al
Table 3 The most significantly enriched GO terms for cellular component for the predicted targets of the differentially expressed miRNAs following Smad4 reexpression
GO term Cluster frequency (out of 31,172 genes)
Genome frequency of use (out of 50,073 genes)
P-value Corrected
P-value
intracellular part 20,076 (64.4%) 29,514 (58.9%) 1.17e−222 7.51e−221
organelle 19,075 (61.2%) 27,978 (55.9%) 6.33e−208 4.05e−206
cytoplasm 14,727 (47.2%) 21,188 (42.3%) 6.13e−183 3.92e−181
intracellular organelle 16,265 (52.2%) 23,970 (47.9%) 2.35e−136 1.50e−134
cytoplasmic part 9,278 (29.8%) 13,032 (26.0%) 5.87e−136 3.76e−134
membrane-bounded organelle 14,858 (47.7%) 21,792 (43.5%) 1.26e−128 8.07e−127
intracellular membrane-bounded organelle 14,858 (47.7%) 21,792 (43.5%) 1.26e−128 8.07e−127
intracellular 20,779 (66.7%) 31,419, 62.7%) 4.35e−119 2.78e−117
cell part 23,565 (75.6%) 36,179 (72.3%) 3.80e−101 2.43e−99
cell 23,566((75.6%) 36,183 (72.3%) 6.99e−101 4.47e−99
cytosol 4,639 (14.9%) 6,275 (12.5%) 6.12e−97 3.91e−95
endomembrane system 3,602 (11.6%) 4,941 (9.9%) 3.82e−62 2.44e−60
nucleus 11,000 (35.3%) 16,350 (32.7%) 1.58e−59 1.01e−57
cytoskeleton 2,394 (7.7%) 3,296 (6.6%) 8.56e−39 5.47e−37
organelle part 3,724 (11.9%) 5,298 (10.6%) 1.36e−38 8.75e−37
intracellular organelle part 3,724 (11.9%) 5,298 (10.6%) 1.36e−38 8.75e−37
Note: Terms from the Ontology with P-value as good or better than 1. Abbreviation: GO, Gene Ontology.
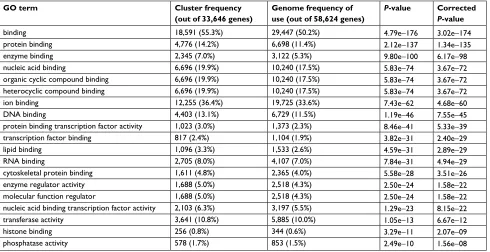
Table 4 The most significantly enriched GO terms for molecular function for the predicted targets of the differentially expressed miRNAs following Smad4 reexpression
GO term Cluster frequency (out of 33,646 genes)
Genome frequency of use (out of 58,624 genes)
P-value Corrected
P-value
binding 18,591 (55.3%) 29,447 (50.2%) 4.79e−176 3.02e−174
protein binding 4,776 (14.2%) 6,698 (11.4%) 2.12e−137 1.34e−135
enzyme binding 2,345 (7.0%) 3,122 (5.3%) 9.80e−100 6.17e−98
nucleic acid binding 6,696 (19.9%) 10,240 (17.5%) 5.83e−74 3.67e−72
organic cyclic compound binding 6,696 (19.9%) 10,240 (17.5%) 5.83e−74 3.67e−72
heterocyclic compound binding 6,696 (19.9%) 10,240 (17.5%) 5.83e−74 3.67e−72
ion binding 12,255 (36.4%) 19,725 (33.6%) 7.43e−62 4.68e−60
DNA binding 4,403 (13.1%) 6,729 (11.5%) 1.19e−46 7.55e−45
protein binding transcription factor activity 1,023 (3.0%) 1,373 (2.3%) 8.46e−41 5.33e−39
transcription factor binding 817 (2.4%) 1,104 (1.9%) 3.82e−31 2.40e−29
lipid binding 1,096 (3.3%) 1,533 (2.6%) 4.59e−31 2.89e−29
RNA binding 2,705 (8.0%) 4,107 (7.0%) 7.84e−31 4.94e−29
cytoskeletal protein binding 1,611 (4.8%) 2,365 (4.0%) 5.58e−28 3.51e−26
enzyme regulator activity 1,688 (5.0%) 2,518 (4.3%) 2.50e−24 1.58e−22
molecular function regulator 1,688 (5.0%) 2,518 (4.3%) 2.50e−24 1.58e−22
nucleic acid binding transcription factor activity 2,103 (6.3%) 3,197 (5.5%) 1.29e−23 8.15e−22
transferase activity 3,641 (10.8%) 5,885 (10.0%) 1.05e−13 6.67e−12
histone binding 256 (0.8%) 344 (0.6%) 3.29e−11 2.07e−09
phosphatase activity 578 (1.7%) 853 (1.5%) 2.49e−10 1.56e−08
Note: Terms from the function ontology with P-value as good or better than 1. Abbreviation: GO, Gene Ontology.
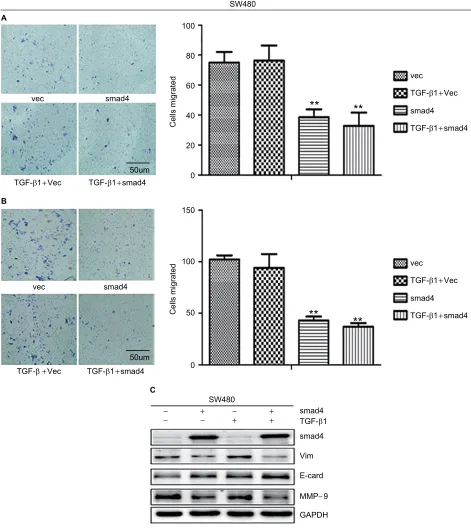
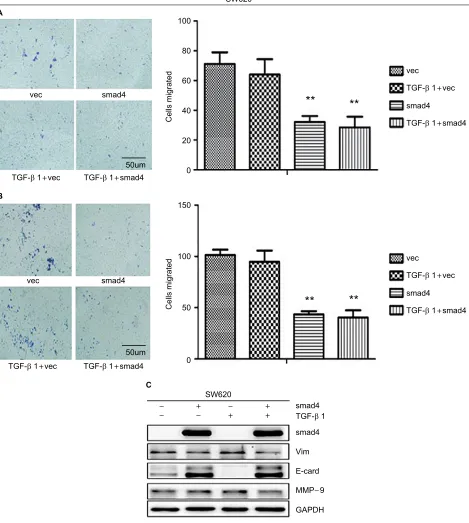
and SW620 (Figure 5A, B) cells, which is independent of TGF-β1. Smad4 reexpression increased the expression of E-cadherin (E-cad), and decreased the Vimentin (Vim) and Matrix Metalloproteinase-9 (MMP-9) expression (Figures 4C and 5C). Restoration of SMAD4 results in a marked
decrease of Vim by inhibiting p-AKT and p-EPHA2, but significantly increased the E-cad by AKT–EPHA2 pathways in colon cancer SW480 cells (Figure 6A). We got the same phenomenon in colon cancer SW620 cells following stable Smad4 reexpression (Figure 6B).
Cancer Management and Research downloaded from https://www.dovepress.com/ by 118.70.13.36 on 20-Aug-2020
Dovepress Smad4-mediated miRNA expression profiling in SW620 human colon cancer cells
Table 5 The most significantly enriched GO terms for molecular biological process for the predicted targets of the differentially expressed miRNAs following Smad4 reexpression
GO term Cluster frequency (out of 30,854 genes)
Genome frequency of use (out of 51,743 genes)
P-value Corrected
P-value
cellular process 21,945 (71.1%) 34,615 (66.9%) 2.03e−135 3.46e−133
single-organism process 16,897 (54.8%) 26,171 (50.6%) 6.57e−119 1.11e−116
developmental process 4,416 (14.3%) 6,062 (11.7%) 2.07e−115 3.52e−113
single-organism cellular process 13,739 (44.5%) 21,184 (40.9%) 2.93e−91 4.98e−89
metabolic process 15,628 (50.7%) 24,384 (47.1%) 2.19e−85 3.72e−83
biosynthetic process 7,285 (23.6%) 10,771 (20.8%) 1.50e−82 2.56e−80
cellular metabolic process 13,537 (43.9%) 20,960 (40.5%) 7.92e−81 1.34e−78
anatomical structure development 3,194 (10.4%) 4,389 (8.5%) 1.82e−80 3.10e−78
cellular component organization 5,065 (16.4%) 7,347 (14.2%) 4.72e−71 8.02e−69
cellular component organization or biogenesis 5,107 (16.6%) 7,419 (14.3%) 2.80e−70 4.76e−68 cellular nitrogen compound metabolic process 8,866 (28.7%) 13,540 (26.2%) 1.38e−59 2.35e−57
nitrogen compound metabolic process 9,067 (29.4%) 13,871 (26.8%) 3.37e−59 5.74e−57
cell differentiation 1,839 (6.0%) 2,476 (4.8%) 2.66e−55 4.53e−53
single-organism developmental process 2,283 (7.4%) 3,161 (6.1%) 1.61e−52 2.75e−50
Localization 7,104 (23.0%) 10,785 )20.8%) 8.54e−51 1.45e−48
organelle organization 1,865 (6.0%) 2,574 (5.0%) 3.28e−44 5.58e−42
cell–cell signaling 1,117 (3.6%) 1,475 (2.9%) 6.47e−40 1.10e−37
cellular developmental process 1,993 (6.5%) 2,803 (5.4%) 1.02e−38 1.73e−36
cell communication 8,167 (26.5%) 12,684 (24.5%) 7.68e−37 1.30e−34
signaling 8,167 (26.5%) 12,684 (24.5%) 7.68e−37 1.30e−34
single organism signaling 8,167 (26.5%) 12,684 (24.5%) 7.68e−37 1.30e−34
biological regulation 8,400 (27.2%) 13,094 (25.3%) 8.48e−35 1.44e−32
Note: Terms from the process ontology with P-value as good or better than 1. Abbreviation: GO, Gene Ontology.
Table 6 KEGG pathway analysis for the predicted targets of the differentially expressed miRNAs
Pathway Target genes with pathway annotation (15,068)
All genes of the species with pathway annotation (31,075)
P-value Q-value Pathway ID
Vascular smooth muscle contraction 339 (2.25%) 551 (1.77%) 3.817347e−10 6.353478e−08 ko04270
Pathways in cancer 1,004 (6.66%) 1,810 (5.82%) 5.294565e−10 6.353478e−08 ko05200
Glutamatergic synapse 336 (2.23%) 559 (1.8%) 1.744324e−08 1.122107e−06 ko04724
Folate biosynthesis 44 (0.29%) 51 (0.16%) 1.870179e−08 1.122107e−06 ko00790
Cytokine–cytokine receptor interaction 524 (3.48%) 913 (2.94%) 2.741697e−08 1.316015e−06 ko04060
Calcium signaling pathway 477 (3.17%) 826 (2.66%) 4.015428e−08 1.606171e−06 ko04020
Neuroactive ligand–receptor interaction 544 (3.61%) 961 (3.09%) 1.834706e−07 6.290421e−06 ko04080 Chemokine signaling pathway 465 (3.09%) 813 (2.62%) 2.844341e−07 8.533023e−06 ko04062 Aldosterone-regulated sodium reabsorption 121 (0.8%) 181 (0.58%) 4.371058e−07 1.165615e−05 ko04960
Salivary secretion 233 (1.55%) 383 (1.23%) 7.001501e−07 1.680360e−05 ko04970
Axon guidance 385 (2.56%) 667 (2.15%) 8.425047e−07 1.838192e−05 ko04360
Fc gamma R-mediated phagocytosis 270 (1.79%) 455 (1.46%) 1.864193e−06 3.728386e−05 ko04666
GnRH signaling pathway 274 (1.82%) 467 (1.5%) 5.521091e−06 1.019278e−04 ko04912
Melanogenesis 260 (1.73%) 442 (1.42%) 7.238362e−06 1.240862e−04 ko04916
Progesterone-mediated oocyte maturation 290 (1.92%) 500 (1.61%) 1.073179e−05 1.717086e−04 ko04914
Prostate cancer 338 (2.24%) 592 (1.91%) 1.387196e−05 2.080794e−04 ko05215
Regulation of actin cytoskeleton 584 (3.88%) 1,066 (3.43%) 1.634052e−05 2.306897e−04 ko04810 Phosphatidylinositol signaling system 236 (1.57%) 402 (1.29%) 2.244263e−05 2.992351e−04 ko04070
ErbB signaling pathway 294 (1.95%) 513 (1.65%) 3.313052e−05 4.184908e−04 ko04012
Oocyte meiosis 328 (2.18%) 578 (1.86%) 3.589737e−05 4.204091e−04 ko04114
Note: The significantly enriched pathways annotation for the predicted targets of the differentially expressed miRNAs following Smad4 reexpression. Abbreviation: GnRH, gonadotropin-releasing hormone; KEGG, Kyoto Encyclopedia of Genes and Genomes.
Cancer Management and Research downloaded from https://www.dovepress.com/ by 118.70.13.36 on 20-Aug-2020
Dovepress Yan et al
Discussion
Colon cancer metastasis is the leading cause of death in colon cancer patients.13 However, the molecular mechanism is not
clear. Previous studies have shown that SMAD4 is strongly associated with the development of colon metastases, which plays the antimetastatic role in colon cancer metastasis.14–16
Smad4, known as deleted in pancreatic carcinoma, locus 4 (DPC4), was first identified on the basis of frequent homozygous deletions and mutations affecting 18q21.1 in the pancreatic tumor, and was found to be involved in the TGF-β1 signaling pathway.17 The Smad4 was deregulated in
many cancers and was demonstrated to mediate tumor pro-cess including pancreatic cancer, hepatocellular carcinoma, and so on.17 Some researchers have shown that Smad4 could
inhibit the activity of wingless/integrated (WNT)/β-catenin signaling pathway in cancer,10 inhibit the EMT process9,10
and changes the immune microenvironment,1,14,16 which are
involved in the tumor development and process.
In this study, we also demonstrate that Smad4 can regulate the migration and invasion abilities of colon can-cer. However, the exact mechanism of Smad4-mediated tumor metastasis remains to be further investigated. Many studies indicate that miRNAs have important functions in tumor progression, especially recurrence, drug resis-tance, and metastasis.4,5,8 Ahn et al reported that Smad3
regulated, at the transcriptional level, miR-200 family members, which themselves regulate ZEB1 and ZEB2, known as transcriptional repressors of E-cad, at the post-transcriptional level in a TGF-β-independent manner, which regulate EMT in gastric cancer cells.18 Davis et al
Figure 3 Generated stable Smad4 reexpression in human colon cancer cells. Notes: (A) Expression of Smad4 in six kinds of colon cancer cells including SW480, SW620, RKO, HCT116, LOVO, and HCT8 by WB. (B) WB detection of Smad4 expression level in SW480 and SW620 cells following Smad4 reexpression. β-Actin was used as an internal control. Blank: null SW620 or SW480 cells. CTRL: empty vector-infected SW620 or SW480 cells. SMAD4: Smad4 vector-infected SW620 or SW480 cells.
Abbreviation: WB, Western blot.
SW480
SW480 Smad4
A
B
SW620
SW620
Blank CTRL SMAD4 Blank CTRL SMAD4
HCT116 LOVO HCT8 RKO
-actin
Smad4
-actin
think that Smad proteins bind a conserved RNA sequence to promote miRNA maturation by Drosha. They think that Smads are multifunctional proteins that modulate gene expression transcriptionally through DNA binding and post-transcriptionally through pri-miRNA binding and regulation of miRNA processing.19 Blahna and Hata
reported that Smads modulated miRNA expression through both transcriptional and post-transcriptional mechanisms: 1) transcriptional regulation of miRNAs by Smads largely resembles the canonical TGF-β signaling pathway; 2) post-transcriptional regulation of miRNA biogenesis acts on pri-miRNA in the nucleus.20,21 Therefore, we hypothesize
that Smad4 could regulate the expression of miRNA and Smad4-mediated activation or inhibition of miRNAs might influence colon cancer metastasis.
As far as we know, there are no reports about the miRNA expression profile following smad4 reexpression in a colon cancer cell model. In our previous study, we identify differentially expressed miRNAs in two colon carcinoma cell lines: SW480, derived from primary colon carcinoma, and SW620, derived from lymph node metas-tasis, which were obtained from the same patient. And it is the first systematic analysis of the differences of miRNAs between SW480 and SW620 cells, which demonstrated the potential miRNAs biomarkers for predicting colon cancer metastasis.22 In this study, we further study the role of
miRNAs in colon cancer metastasis. First, we established the colon cancer cell lines with stable overexpression of Smad4. Then, we used the next-generation sequencing technology to identify the differentially expressed miR-NAs in the SW620 colon cancer cell line transfected with smad4 lentiviral vector. We found Smad4 reexpression significantly upregulated 43 known miRNAs and down-regulated 10 known miRNAs expression. Furthermore, pathway analysis of predicted miRNA targets showed that these genes were mainly involved in protein-binding transcription factor activity, vascular smooth muscle con-traction, pathways in cancer metastasis, and PI3K–Akt signal pathway. We also performed qRT-PCR and WB to validate the partial results of sequencing. We demonstrated that restoration of Smad4 resulted in a marked decrease of Vim by inhibiting p-AKT and p-EPHA2, but significantly increased the E-cad by AKT–EPHA2 pathways in colon cancer SW480 cells. Many studies indicate that target-ing key signaltarget-ing components of PI3K–AKT pathway by restoring or inhibiting miRNA function holds promise as a potential therapeutic approach to suppress EMT in
Cancer Management and Research downloaded from https://www.dovepress.com/ by 118.70.13.36 on 20-Aug-2020
Dovepress Smad4-mediated miRNA expression profiling in SW620 human colon cancer cells
cancer23 and miRNAs could promote cell migration via
the AKT signaling pathway.24
Therefore, we speculate that Smad4 could regulate the colon cancer metastasis via a new mechanism, that is, through Figure 4 Migration and invasion assay in SW480 cells following stable Smad4 reexpression.
Notes: (A) Transwell cell migration and (B) invasion assay in Smad4-negative and Smad4-positive SW480 cells in the case of adding and without adding TGF-β1. (C) Protein expression level of Smad4, E-cad, Vim, and MMP-9 by WB with or without TGF-β1 cytokine. GAPDH was used as an internal control. **P<0.01.
Abbreviations: E-cad, E-cadherin; GAPDH, glyceraldehyde-3-phosphate dehydrogenase; MMP-9, Matrix Metalloproteinase-9; Vim, Vimentin; WB, Western blot. C
+
+ ++
−
− −
−
TGF-1 smad4
smad4
Vim
E-card
MMP−9
GAPDH SW480
100
A
B
SW480
vec
TGF-1+Vec TGF-1+smad4
80
60
Cells migrated 40
20 smad4
vec
TGF-+Vec TGF-1+smad4
50um smad4
0
150
100
Cells migrated 50
0
vec
TGF-1+smad4 TGF-1+Vec
smad4
vec
TGF-1+smad4 TGF-1+Vec
smad4 50um
Smad4-miRNAs-downstream genes (such as AKT, EPHA2, E-cad, and Vim) axis. However, we should do further study to demonstrate how Smad4 regulated the expression of miRNA. We guess that Smad4 could directly mediate the miRNA
Cancer Management and Research downloaded from https://www.dovepress.com/ by 118.70.13.36 on 20-Aug-2020
Dovepress Yan et al
expression through Smad-binding element by binding to the gene promoter zone or indirectly regulate the miRNAs expression. Of course it remains a deeply further study.
Conclusion
This is the first systematic report of Smad4-mediated miRNA expression profiling in Smad4-positive and Smad4-negative
SW620 human colon cancer cells, which may help us bet-ter understand the role of Smad4-mediating metastasis of colon cancer.
Acknowledgments
This work was supported by National Nature Science Foun-dation of China (Grant No. 81172285) and Natural Science Figure 5 Migration and invasion assay in SW620 cells following stable Smad4 reexpression.
Notes: (A) Transwell cell migration and (B) invasion assay in Smad4 negative and positive SW620 cells with or without adding TGF-β1. (C) WB detection of protein expression level of Smad4, E-cad, Vim, MMP-9 with or without TGF-β1 cytokine. GAPDH was used as an internal control. **P<0.01.
Abbreviations: E-cad, E-cadherin; MMP-9, Matrix Metalloproteinase-9; Vim, Vimentin; WB, Western blot. C
+
+ ++
−
− −
−
TGF- 1 smad4
smad4
Vim
E-card
MMP−9
GAPDH SW620
100
A
B
SW620
vec
TGF- 1+vec TGF- 1+smad4
80
60
Cells migrated 40
20 smad4
vec
TGF- 1+vec TGF- 1+smad4
50um smad4
0
150
100
Cells migrated 50
0
vec
TGF- 1+smad4 TGF- 1+vec
smad4
vec
TGF- 1+smad4 TGF- 1+vec
smad4 50um
Cancer Management and Research downloaded from https://www.dovepress.com/ by 118.70.13.36 on 20-Aug-2020
Dovepress Smad4-mediated miRNA expression profiling in SW620 human colon cancer cells
Foundation of Fujian Province, People’s Republic of China (Grant No. 2018J01392 and 2018J01390).
Disclosure
The authors report no conflicts of interest in this work.
References
1. Wasserman I, Lee LH, Shia J, et al. SMAD4 loss in colorectal cancer: correlation with recurrence, chemoresistance, and immune infiltrate. J Clin Oncol. 2017;35(4_suppl):587–587.
2. Salovaara R, Roth S, Loukola A, et al. Frequent loss of SMAD4/DPC4 protein in colorectal cancers. Gut. 2002;51(1):56–59.
3. Ahmed M, Siraj AK, Masoodi T, Bu R, Al-Dayel F, Al-Kuraya KS. Abstract 2255: SMAD4 loss is associated with poor progno-sis in Middle Eastern colorectal cancer. Cancer Res. 2017;77(13 Supplement):2255–2255.
4. Lopez-Camarillo C, Marchat LA, Arechaga-Ocampo E, et al. Metasta-miRs: non-coding MicroRNAs driving cancer invasion and metastasis. Int J Mol Sci. 2012;13(2):1347–1379.
5. Pencheva N, Tavazoie SF. Control of metastatic progression by microRNA regulatory networks. Nat Cell Biol. 2013;15(6):546–554. 6. Davoodian P, Ravanshad M, Hosseini SY, et al. Effect of TGF-β/smad
signaling pathway blocking on expression profiles of 335, miR-150, miR-194, miR-27a, and miR-199a of hepatic stellate cells (HSCs). Gastroenterol Hepatol Bed Bench. 2017;10(2):112–117.
7. Wu CW, Storey KB. Regulation of Smad mediated microRNA tran-scriptional response in ground squirrels during hibernation. Mol Cell Biochem. 2018;439(1–2):151–161.
8. Zhou J, Hu M, Wang F, Song M, Huang Q, Ge B. miR-224 Controls human colorectal cancer cell line HCT116 proliferation by targeting Smad4. Int J Med Sci. 2017;14(10):937–942.
9. Zhang B, Halder SK, Kashikar ND, et al. Antimetastatic role of Smad4 signaling in colorectal cancer. Gastroenterology. 2010;138(3):969–980. 10. Shiou SR, Singh AB, Moorthy K, et al. Smad4 regulates claudin-1
expression in a transforming growth factor-beta-independent manner in colon cancer cells. Cancer Res. 2007;67(4):1571–1579.
11. Papageorgis P, Cheng K, Ozturk S, et al. Smad4 inactivation pro-motes malignancy and drug resistance of colon cancer. Cancer Res. 2011;71(3):998–1008.
12. Yamamoto T, Kawada K, Itatani Y, et al. Loss of SMAD4 promotes lung metastasis of colorectal cancer by accumulation of CCR1+ tumor-associated neutrophils through CCL15-CCR1 axis. Clin Cancer Res. 2017;23(3):833–844.
13. Voorneveld PW, Kodach LL, Jacobs RJ, et al. Loss of SMAD4 alters BMP signaling to promote colorectal cancer cell metastasis via activa-tion of Rho and ROCK. Gastroenterology. 2014;147(1):196–208. 14. Itatani Y, Kawada K, Fujishita T, et al. Loss of SMAD4 from
colorec-tal cancer cells promotes CCL15 expression to recruit CCR1+ myeloid cells and facilitate liver metastasis. Gastroenterology. 2013;145(5):1064–1075.
15. Isaksson-Mettävainio M, Palmqvist R, Forssell J, Stenling R, Oberg A. SMAD4/DPC4 expression and prognosis in human colorectal cancer. Anticancer Res. 2006;26(1B):507–510.
16. Kitamura T, Kometani K, Hashida H, et al. SMAD4-deficient intestinal tumors recruit CCR1+ myeloid cells that promote invasion. Nat Genet. 2007;39(4):467–475.
17. Chen YW, Hsiao PJ, Weng CC, et al. SMAD4 loss triggers the pheno-typic changes of pancreatic ductal adenocarcinoma cells. BMC Cancer. 2014;14:181.
Figure 6 SMAD4 reexpression modulates E-cad and Vim expression by AKT–EPHA2 signal pathways.
Notes: (A) Restoration of SMAD4 results in a marked decrease of Vim by inhibiting p-AKT and p-EPHA2, but significantly increased the E-cad by AKT–EPHA2 pathways in colon cancer SW480 cells. (B) Restoration of SMAD4 results in the same phenomenon in colon cancer SW620 cells. Total protein extracted from indicated cells were lysed for WB analysis. WBs were then performed with the indicated antibodies. β-Actin served as an internal control.
Abbreviations: E-cad, E-cadherin; Vim, Vimentin; WB, Western blot.
TGF–1
– + – + – + – +
– – – – + + + +
– – + + – + + +
– + – + – + – +
– – – – + + + +
– – + + – + + +
Smad4
SW480 B SW620
A
Smad4
E-cad
Vim
p-AKT
T-AKT
p-EPHA2
T-EPHA2
-actin LY294002
Cancer Management and Research downloaded from https://www.dovepress.com/ by 118.70.13.36 on 20-Aug-2020
Dovepress
Cancer Management and Research
Publish your work in this journal
Submit your manuscript here: https://www.dovepress.com/cancer-management-and-research-journal Cancer Management and Research is an international, peer-reviewed open access journal focusing on cancer research and the optimal use of preventative and integrated treatment interventions to achieve improved outcomes, enhanced survival and quality of life for the cancer patient. The manuscript management system is completely online and includes
a very quick and fair peer-review system, which is all easy to use. Visit http://www.dovepress.com/testimonials.php to read real quotes from published authors.
Dove
press
Yan et al
18. Ahn SM, Cha JY, Kim J, et al. Smad3 regulates E-cadherin via miRNA-200 pathway. Oncogene. 2012;31(25):3051–3059.
19. Davis BN, Hilyard AC, Nguyen PH, Lagna G, Hata A. Smad proteins bind a conserved RNA sequence to promote microRNA maturation by Drosha. Mol Cell. 2010;39(3):373–384.
20. Blahna MT, Hata A. Smad-mediated regulation of microRNA biosyn-thesis. FEBS Lett. 2012;586(14):1906–1912.
21. Davis-Dusenbery BN, Hata A. Smad-mediated miRNA processing: a critical role for a conserved RNA sequence. RNA Biol. 2011;8(1):71–76. 22. Yan W, Yang W, Liu Z, Wu G. Characterization of microRNA expres-sion in primary human colon adenocarcinoma cells (SW480) and their lymph node metastatic derivatives (SW620). Onco Targets Ther. 2018;11:4701–4709.
23. Dong P, Konno Y, Watari H, Hosaka M, Noguchi M, Sakuragi N. The impact of microRNA-mediated PI3K/AKT signaling on epithelial-mesenchymal transition and cancer stemness in endometrial cancer. J Transl Med. 2014;12:231.
24. Guo J, Xu L, Teng X, Sun M. MicroRNA-7-5p regulates the proliferation and migration of intestinal epithelial cells by targeting trefoil factor 3 via inhibiting the phosphoinositide 3-kinase/Akt signalling pathway. Int J Mol Med. 2017;40(5):1435–1443.
25. Zhongcai L, Wei Y, Fusheng L. Over-expression of Smad4 could prevent migration and invasion in colon cancer SW480 and SW620 cells and mechanism. Chin J Exp Surg. 2018;35(2):238–241.
Cancer Management and Research downloaded from https://www.dovepress.com/ by 118.70.13.36 on 20-Aug-2020