Cancer Management and Research 2018:10 6379–6389
Cancer Management and Research
Dove
press
submit your manuscript | www.dovepress.com 6379
O R i g i n a l R e s e a R C h
open access to scientific and medical research
Open Access Full Text Article
Identification of mTOR inhibitor-resistant genes
in cutaneous squamous cell carcinoma
Seong-Lan Yu1
Dong Chul lee2
seung Woo Baek3
Do Yeun Cho3
Jong gwon Choi3
JaeKu Kang1
1Myunggok Medical Research
Institute, College of Medicine, Konyang University, Daejeon, Republic of Korea; 2Biotherapeutics
Translational Research Center, Korea Research Institute of Bioscience and Biotechnology, Daejeon, Republic of Korea; 3Department of
Oncology-hematology, Konyang University Hospital, Daejeon, Republic of Korea
Purpose: The PI3K/AKT/mTOR pathway is frequently activated in various squamous cell carcinomas (SCCs). Although mTOR inhibitors are suggested as effective treatments in immu-nosuppressed patients with metastatic SCC, they are still not proven to be favorable in treating skin SCC patients not undergoing immunosuppressive therapy. Moreover, the exact mechanism of the mTOR signaling pathway in SCC has not yet been identified. In this study, we aimed to determine the genes associated with mTOR inhibitors in skin SCC.
Materials and methods: The identification of cell viability according to concentration of everolimus and Western blot was done. To analyze the global gene expression profiles, A431 and HSC-1 cells were treated with dimethyl sulfoxide (DMSO) or 100 nM of everolimus for 72 hours. Furthermore, differentially expressed genes (DEGs) were identified using Affyme-trix analysis. To identify the gene network associated with everolimus resistance in SCC cells, pathway analysis was performed using the Ingenuity Pathway Analysis (IPA) tool.
Results: The effects of cell death with respect to the mTOR inhibitor concentration were observed in the HSC-1 cell line; however, the mTOR inhibitor did not show effective cytotoxic activity in the A431 cell line. p-mTOR concentration also diminished with respect to everolimus concentrations in the HSC-1 cell line. Moreover, the microarray results showed that the MYC/ CCND1/TP73/NUPR1/SBD/ERBB2/CDKN2B genes were related to mTOR inhibitor resistance. However, CCND1 gene overexpression was most closely related to mTOR inhibitor resistance. Conclusion: We identified mTOR inhibitor resistance genes, and our findings may help select therapeutic targets in skin SCC.
Keywords: mTOR inhibitor, squamous cell carcinoma, gene profiling, CCND1 gene
Introduction
Squamous cell carcinoma (SCC) is the second-most common type of skin cancer after basal cell carcinoma. Some risk factors for cutaneous SCC include sunlight,
HPV infection, burn wounds, and immunosuppression.1 Cutaneous SCC is the most
common type of malignancy in transplant recipients,2 where the occurrence rate is
approximately 65-folds higher than the general population.3 In cutaneous SCC, the
risk of metastasis tends to increase several years after diagnosis. SCC of the lip and ears has a high rate of local recurrence and distant metastasis (20%–50%). It mainly spreads to local nerves or the lymph nodes. Several systemic chemotherapy agents, such as cisplatin, fluoropyrimidines, bleomycin, doxorubicin, 13-cis-retinoic acid, and interferon alpha-2a, have been used to treat SCC of the skin. Unfortunately, the efficacy of systemic chemotherapy is unsatisfactory, and prospective large clinical
Correspondence: Jong gwon Choi Department of Oncology-Hematology, Konyang University hospital, 158 Gwanjeodong-ro, Seo-gu, Daejeon 35365, Republic of Korea
Tel +82 42 600 9434 Fax +82 42 600 9783 Email jabuss@naver.com
JaeKu Kang
Myunggok Medical Research institute, College of Medicine, Konyang University, 158 Gwanjeodong-ro, Seo-gu, Daejeon, 35365, Republic of Korea
Tel +82 42 600 6415 Fax +82 42 600-8629 E-mail jaeku@konyang.ac.kr
Journal name: Cancer Management and Research Article Designation: Original Research Year: 2018
Volume: 10
Running head verso: Yu et al
Running head recto: Identification of mTOR inhibitor-resistant genes SCC DOI: http://dx.doi.org/10.2147/CMAR.S174966
Cancer Management and Research downloaded from https://www.dovepress.com/ by 118.70.13.36 on 20-Aug-2020
For personal use only.
Dovepress Yu et al
studies are unavailable. Only small studies have shown a response to systemic chemotherapy in patients with
meta-static SCC of the skin.4–8 One particular study demonstrated
that EGFR inhibitor-combined cytotoxic therapy reduced tumor load in locoregional disease. However, efficacy of this combination therapy has not yet been proven in distant
metastatic disease.9,10 Nowadays, immune checkpoint
inhibi-tors are being tested in several clinical trials. Although the US Food and Drug Administration (FDA) recently approved nivolumab and pembrolizumab to treat patients with recur-rent or metastatic head and neck squamous cell cancer, no
phase III trials in cutaneous SCC have yet been approved.11,12
Interestingly, many clinical trials showed that mTOR inhibi-tors significantly reduced tumor size in transplant recipients with cutaneous SCC. Therefore, mTOR inhibitors can be considered to be new therapeutic strategies in posttransplant
skin cancer.13–15
However, the use of mTOR inhibitors is still not proven to be a favorable mode of treatment for SCC patients not undergo-ing immunosuppressive therapy, and the exact mechanism of the mTOR signaling pathway in SCC has not yet been identi-fied. In this study, we tried to identify the genes associated with the therapeutic effects of mTOR inhibitors in cutaneous SCC.
Materials and methods
Cell culture
Skin SCC cell lines, A431 and HSC-1, were obtained from the American Type Culture Collection (ATCC) and Japanese Collection of Research Bioresources (JCRB) Cell Bank (Osaka, Japan), respectively. Both cell lines were cultured in DMEM (HyClone Laboratories, Logan, UT, USA) supple-mented with 10% or 20% FBS (HyClone Laboratories) and 1% penicillin/streptomycin (HyClone Laboratories). The cell lines were maintained at 37°C in a humidified atmosphere
containing 5% CO2.
Cell viability assay
To determine cell viability with respect to everolimus (Sigma-Aldrich Co., St Louis, MO, USA) concentrations, A431 and
HSC-1 cells (0.5×10⁴) were seeded in 96-well tissue culture
plates. The following day, the cells were treated with dif-ferent concentrations of everolimus (0.001–2,000 nM) for 72 hours. Cell viability was measured using MTT reagent (Sigma-Aldrich Co.). Briefly, the surviving cells were treated with 500 µg/mL of MTT solution for 2 hours, after which the absorbance was measured at 540 nm. The survival rate was calculated as the ratio of the absorbance of the treated wells to that of the control wells.
apoptosis analysis
The cells were treated with control and 100 nM everolimus for 72 hours and were harvested after washing by ice-cold PBS. Apoptosis was investigated using Annexin V and prop-idium iodide (PI; Molecular Probes, Eugene, OR, USA). Flow cytometry analyses (Supplementary material) were performed using BD FACSVerse System (BD Biosciences, San Jose, CA, USA).
Western blot analysis
Cells were lysed using RIPA buffer containing 50 mM Tris-HCl (pH 7.4), 1% NP-40, 0.25% sodium deoxycholate, 150
mM NaCl, 1 mM EDTA, 1 mM Na3VO4, 1 mM NaF, and
proteinase inhibitors. Proteins in the cell lysates were sepa-rated using 8% SDS–polyacrylamide gels and transferred to polyvinylidene difluoride membranes (EMD Millipore, Billerica, MA, USA). The blots were incubated in 5% skim milk (Difco, Franklin Lakes, NJ, USA) for 1 hour and then probed overnight with primary antibodies against p-mTOR (Cell Signaling, Danvers, MA, USA), mTOR (Cell Signal-ing), p-p70S6K (Cell signalSignal-ing), p70S6K (Cell SignalSignal-ing), cyclin D1 (Santa Cruz Biotechnology Inc., Dallas, TX, USA), and GAPDH (Santa Cruz Biotechnology Inc.). Next day, the blots were incubated with horseradish peroxidase-conjugated anti-rabbit secondary antibodies (Supplementary mate-rial). The immunoreactive proteins were detected using an enhanced chemiluminescence kit (Thermo Fisher Scientific, Waltham, MA, USA) and visualized using ImageQuant ver. 5.2 (Molecular Dynamics, Sunnyvale, CA, USA).
Phos-phorylation proteins were quantified using Image J (https://
imagej.nih.gov/ij/).
Microarray analysis and gene expression
profiling
To analyze the global gene expression profiles, A431 and HSC-1 cells were treated with dimethyl sulfoxide (DMSO) or 100 nM of everolimus for 72 hours. Total RNA from the
cells was extracted using TRI reagent® (Ambion, Waltham,
MA, USA). RNA purity and integrity were evaluated using the ND-1000 Spectrophotometer (NanoDrop, Wilmington, NC, USA) and Agilent 2100 Bioanalyzer (Agilent Technolo-gies, Santa Clara, CA, USA), respectively. The Affymetrix whole transcript expression array process was executed according to the manufacturer’s protocol (GeneChip Whole Transcript PLUS Reagent Kit; Thermo Fisher Scientific). Briefly, cDNA was synthesized using the GeneChip WT (Whole Transcript) Amplification kit (Thermo Fisher Scientific) as described by the manufacturer. The sense
Cancer Management and Research downloaded from https://www.dovepress.com/ by 118.70.13.36 on 20-Aug-2020
Dovepress Identification of mTOR inhibitor-resistant genes SCC
cDNA was then fragmented and biotin labeled with TdT using the GeneChip WT Terminal Labeling Kit (Thermo Fisher Scientific). Approximately 5.5 µg of the labeled DNA target was hybridized to the Affymetrix GeneChip Human 2.0 ST Array at 45°C for 16 hours. Hybridized arrays were washed and stained on the GeneChip Fluidics Station 450 and scanned on a GCS3000 Scanner (Affymetrix).
The signal values were computed using the Affymetrix®
GeneChip™ Command Console software. Furthermore,
the data were summarized and normalized via the robust multi-array average (RMA) method implemented using
the Affymetrix® Expression Console™ (EC) software. We
exported the gene-level RMA analysis results and analyzed the differentially expressed genes (DEGs). The results of the gene expression data have been deposited under the GEO reference GSE112079.
Statistical significance of the expression data was deter-mined using the Local Pooled Error test and fold change
≥1.5 in which the null hypothesis was set as no difference
existed among the groups. The false discovery rate (FDR)
was controlled by adjusting the P-value using the
Ben-jamini–Hochberg algorithm. For a DEG set, hierarchical cluster analysis was performed using complete linkage and Euclidean distance as a measure of similarity.
Gene-enrichment and functional annotation analyses for the significant probe list were performed using the Database for Annotation, Visualization, and Integrated Discovery
(DAVID) tool (http://david.abcc.ncifcrf.gov). All data
analy-sis and DEG visualization were conducted using R 3.0.2 (http://www.r-project.org).
ingenuity Pathway analysis (iPa)
To identify the gene network associated with everolimus resistance in SCC cells, pathway analysis was performed
using the IPA tool (Ingenuity® Systems, Red Wood city, CA,
USA; http://www.ingenuity.com).
Quantitative real-time PCR (qRT-PCR)
analysis
Total RNA was extracted using TRI reagent® (Ambion), and
cDNAs were synthesized using M-MLV Reverse Transcrip-tase (Promega Corporation, Fitchburg, WI, USA) accord-ing to the manufacturer’s instructions. qRT-PCR reactions
were carried out in triplicates using the iQ™ SYBR Green
Supermix and CFX96 qPCR instrument (Bio-Rad Labora-tories Inc., Hercules, CA, USA). The primers used are as
follows: forward, 5′-tgaggagacaccgcccac-3′ and reverse,
5′-caacatcgatttcttcctcatcttc-3′ for MYC proto-oncogene;
forward, 5′-gccgagaagctgtgcatctac-3′ and reverse, 5′
-tccactt-gagcttgttcaccag-3′ for cyclin D1 (CCND1); forward,
5′-ttgagcacctctggagctct-3′ and reverse, 5′
-atctggtccatggt-gctgc-3′ for TP73; forward, 5′-aagctgctgccaacaccaac-3′ and
reverse, 5′-ccctcgcttcttcctctctgaa-3′ for NUPR1; forward,
5′-atcgcctgctacaaaaacaag-3′ and reverse, 5′
-ttggcaacctgacctt-tagaa-3′ for ribosome maturation factor (SBDS); forward,
5′-agccttgccccatcaactg-3′ and reverse, 5′
-aatgccaaccaccg-caga-3′ for ERBB2; forward, 5′-tgattagcacttgggtgacg-3′ and
reverse, 5′-cctcctccactttgtcctca-3′ for CDKN2B; and forward,
5′-acagtcagccgcatcttctt-3′ and reverse, 5′
-acgaccaaatccgtt-gactc-3’ for GAPDH. The amplification conditions included
a predenaturation step at 95°C for 3 minutes, followed by 40 cycles of denaturation at 95°C for 15 seconds, annealing at 60°C or 58°C for 15 seconds, and extension at 72°C for 15
seconds. The comparative threshold cycle (Ct) method, 2-DDCt,
was used to calculate fold amplification.
CCnD1 gene overexpression
To investigate the effects of everolimus on cell viability via cyclin D1 (CCND1) gene overexpression in HSC-1 cells, the cells were transfected with pcDNA cyclin D1 HA (Addgene
plasmid #11181)16 using Lipofectamine 3000 (Thermo Fisher
Scientific) according to the manufacturer’s recommended protocol. pcDNA cyclin D1 HA was a gift from Dr Bruce Zetter. CCND1 gene overexpression was confirmed using qRT-PCR.
statistical analyses
All graphed data are presented as mean±SD. The results were
analyzed using Student’s t-test. P<0.05 was considered to be
statistically significant.
Results
Everolimus reduces cell viability of skin
sCC
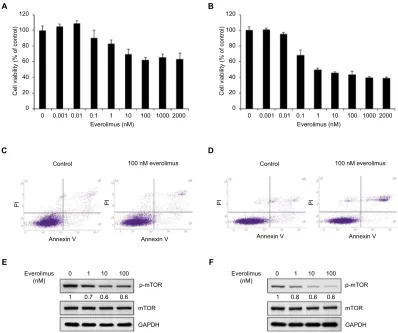
To understand the basis for everolimus sensitivity in skin SCC, we examined the effect of everolimus on cell viability in HSC-1 and A431 cells. First, both cell lines were treated with various doses of everolimus ranging from 0.001 to 2,000 nM for 72 hours. Interestingly, the skin SCC cells showed different patterns of cell viability after everolimus treatment (Figure 1A and B). Everolimus reduced cell viability in a dose-dependent manner in HSC-1 cell lines when compared to the control non-treated cells. However, A431 cell viability was not dependent on everolimus concentrations. Moreover, Annexin V/PI binding assay was performed to investigate the influence of treatment with everolimus. The data showed
Cancer Management and Research downloaded from https://www.dovepress.com/ by 118.70.13.36 on 20-Aug-2020
Dovepress Yu et al
that the percentage of late apoptotic cells increased in HSC-1 cells when compared to control cells. However, the percent-age of late apoptotic cells in A431 cells was unchanged (Figure 1C and D). Since everolimus is reported to be a drug that targets mTORC1, we also confirmed mTOR activity in both cell lines treated with everolimus. As expected, mTOR phosphorylation levels clearly decreased in HSC-1 cells after everolimus treatment in a dose-dependent manner, suggesting that everolimus-mediated cell viability was strongly associ-ated with mTOR activity. On the other hand, phosphorylassoci-ated mTOR proteins only slightly decreased in A431 cells when compared to HSC-1 cells (Figure 1E and F). These results suggest that the A431 cell line exhibits a different type of sensitivity to the everolimus treatment when compared to the HSC-1 cell line. Therefore, these differences between the HSC-1 and A431 cell lines might be connected with the therapeutic efficacy of everolimus in skin SCC. p70S6K pro-tein is direct target of mTOR downstream. We also confirmed everolimus-mediated inhibition of mTOR pathway by simply
checking reduction of p70S6K activity in both HSC-1 and A431 cells treated with everolimus (Figure S1).
Identification of everolimus-resistant
genes in skin sCC
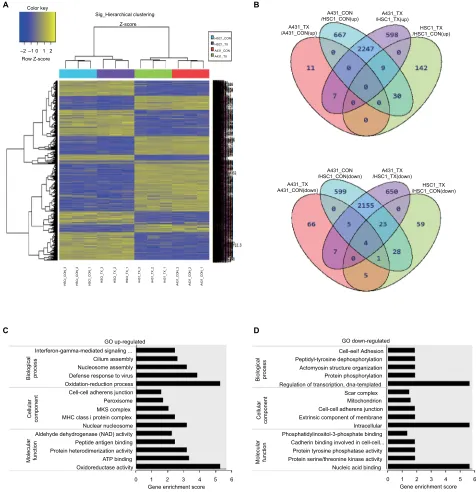
To investigate the molecular mechanisms underlying the different cellular responses to everolimus treatment, we analyzed the global gene expression profiles in everolimus-resistant A431 and everolimus-sensitive HSC-1 cells. Micro-array analysis was performed on both cell lines treated with or without 100 nM of everolimus. Hierarchical clustering analysis from the microarray data showed DEGs in A431 and HSC-1 cells. The variation between the control and everolimus-treated cells in the same cell line was smaller than that between the two cell lines, suggesting that the differential gene expression profiles may be related to different everoli-mus sensitivity mechanisms (Figure 2A). To further define the difference in cellular response between everolimus-resistant A431 and everolimus-sensitive HSC-1 cells, we identified
Figure 1 Inhibition of mTOR activity via everolimus treatment reduces the proliferation of skin SCC cells.
Notes: Cell viability of A431 (A) and HSC-1 (B) cells after 72-hour everolimus treatment at different dosages. Apoptosis analysis of A431 (C) and HSC-1 (D) by Annexin V/PI double staining after treatment with 100 nM everolimus for 72 hours. Everolimus-induced changes in mTOR activity in A431 (E) and HSC-1 (F) cells were analyzed by performing immunoblotting assays.
Abbreviations: SCC, squamous cell carcinoma; PI, propidium iodide.
120
A B
C D
E F
100
80
60
Cell viability (% of control)
40
20
0
0 0.001 0.01 0.1 1
Everolimus (nM)
Control
Annexin V
0
1
1 10 100
p-mTOR
mTOR
GAPDH
0.7 0.6 0.6
Everolimus
(nM) 0
1 0.8 0.6 0.6
1 10 100
p-mTOR
mTOR
GAPDH Everolimus
(nM)
Annexin V Annexin V Annexin V
PI PI PI PI
100 nM everolimus Control 100 nM everolimus
10 100 1000 2000
120
100
80
60
Cell viability (% of control)
40
20
0
0 0.001 0.01 0.1 1
Everolimus (nM)
10 100 1000 2000
Cancer Management and Research downloaded from https://www.dovepress.com/ by 118.70.13.36 on 20-Aug-2020
Dovepress Identification of mTOR inhibitor-resistant genes SCC
7,313 DEGs that changed >1.5-fold and had P-values <0.05
in at least one of four comparisons (A431_CON vs A431_TX, A431_CON vs HSC-1_CON, A431_TX vs HSC-1_TX, and HSC-1_CON vs HSC-1_TX; Figure 2B). Based on these results, we isolated the everolimus-resistant genes, 2,247 of which were upregulated and 2,155 of which were downregu-lated. Next, to investigate the functional annotation of the everolimus resistance-related genes, we performed a gene-enrichment analysis using the bioinformatics tool DAVID
(http://david.abcc.ncifcrf.gov/). The top five gene ontology (GO) terms are listed in Figure 2C and D. We found that the highest enriched GOs targeted by the upregulated genes and related to everolimus resistance were oxidation–reduction process (GO: biological processes), nuclear nucleosome (GO: cellular components), and oxidoreductase activity (GO: molecular functions) (Figure 2C), whereas the downregulated transcripts were regulation of transcription, DNA-templated (GO: biological processes), intracellular (GO: cellular
com-Figure 2 Identification of genes related to everolimus resistance in skin SCC cells using microarray analysis.
Notes: (A) Hierarchical clustering of the significant differences in gene expression for control and everolimus treatments in A431 and HSC-1 cells. (B) Venn diagram of the upregulated and downregulated genes after everolimus treatments. (C) GO enrichment analysis of the upregulated genes associated with everolimus resistance. (D) gO
enrichment analysis of the downregulated genes associated with everolimus resistance.
Abbreviations: SCC, squamous cell carcinoma; GO, gene ontology.
A Color key
–2 –1 0 Row Z-score
Z-score
HSC1_CON HSC1_TX A431_CON A431_TX Sig_Hierarchical clustering
1 2
B
C
Interferon-gamma-mediated signaling ... Cell-eel! Adhesion Peptidyl-tyrosine dephosphorylation Actomyosin structure organization Protein phosphorylation Regulation of transcription, dna-templated Scar complex
Mitochondrion Cell-cell adherens junction Extrinsic component of membrane Intracellular Phosphatidylinositol-3-phosphate binding Cadherin binding involved in cell-cell...
Protein tyrosine phosphatase activity Protein serine/threonine kinase activity Nucleic acid binding
GO up-regulated GO down-regulated
Biological proces
s
Cellular
component
Molecular function
Biological proces
s
Cellular
component
Molecular function
Cilium assembly Nucleosome assembly Defense response to virus Oxidation-reduction process Cell-cell adherens junction Peroxisome MKS complex MHC class i protein complex
Nuclear nucleosome Aldehyde dehydrogenase (NAD) activity Peptide antigen binding Protein heterodimerization activity ATP binding Oxidoreductase activity
0 1 2
Gene enrichment score3 4 5 6 0 Gene enrichment score1 2 3 4 5 6 D
HSCI_CON_3 HSCI_CON_2 HSCI_CON_1 HSCI_TX_
3
HSCI_TX_
2
HSCI_TX_
1
A431_TX_3 A431_TX_2 A431_TX_1
A431_CON_3 A431_CON_2 A431_CON_1
A431_TX /A431_CON(up)
A431_CON
/HSC1_CON(up) /HSC1_TX(up)A431_TX
HSC1_TX /HSC1_CON(up)
A431_TX A431_CON(down)
A431_CON
/HSC1_CON(down) /HSC1_TX(down)A431_TX HSC1_TX /HSC1_CON(down)
Cancer Management and Research downloaded from https://www.dovepress.com/ by 118.70.13.36 on 20-Aug-2020
Dovepress Yu et al
ponents), and nucleic acid binding (GO: molecular functions;
Figure 2D). DEG ontology had enrichment P-values <0.05.
Most of the tumors compared to normal exhibited higher ROS levels. ROS promotes tumor progression and develop-ment, and alteration of reactions with respect to ROS induces
drug resistance.17 Therefore, these results indicate that the
“oxidation–reduction process” under “biological processes” and “oxidoreductase activity” under “molecular functions” are associated with drug resistance.
Identification of the network associated
with everolimus resistance
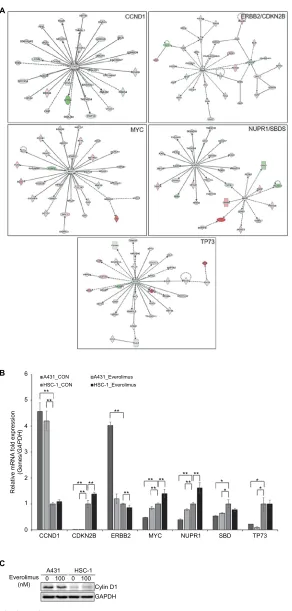
Next, we performed IPA to identify the key regulator(s) within the DEGs that were related to everolimus resistance. Bioinformatics analyses predicted five signaling networks in the gene content associated with everolimus resistance from the differential gene expression profiles. MYC proto-oncogene, bHLH transcription factor (MYC); cyclin D1 (CCND1); TP73; NUPR1/SBDS, ribosome maturation
factor (SBDS); and ERBB2/CDKN2B were observed to
be the core proteins in each IPA network (Figure 3A). To further confirm the IPA data, we performed qRT-PCR and Western blot analysis (Figure 3B and C). Expression levels of CCND1 or ERBB2 were highly upregulated in evero-limus-resistant A431 cells when compared to everolimus-sensitive HSC-1 cells, suggesting that both genes played a significant role in acquired resistance to everolimus in A431 cells. Moreover, chemotherapeutic drugs are also
known to induce ROS overexpression.18 Excessive ROS
regulates the cell cycle via proteasomal degradation of
CCND1.19 Therefore, we investigated cell cycle in both
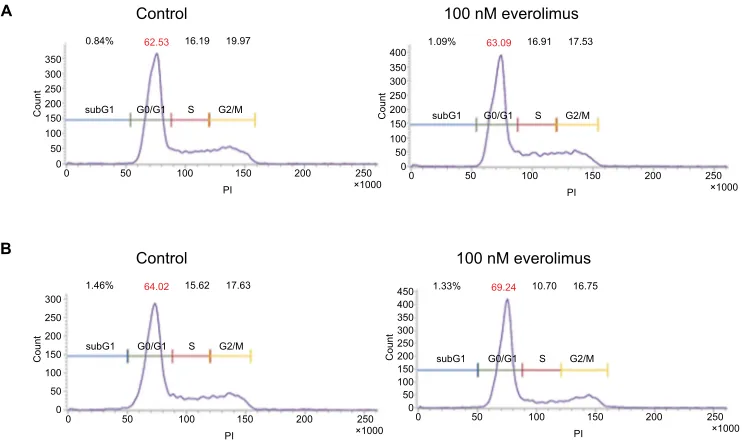
A431 and HSC-1 cells. The result showed that treatment of everolimus in HSC-1 leads to accumulation of the cells at the G0/G1 phase (Figure S2). However, ERBB2 levels were clearly downregulated by the everolimus treatment. These results suggest CCND1 to be a molecular marker of everolimus resistance in skin SCC.
CCnD1 induces everolimus resistance
To further understand the roles of CCND1 in cellular responses associated with everolimus resistance, we inves-tigated the effect of CCND1 on everolimus-sensitive HSC-1 cells. CCND1 was recently suggested as a diagnostic marker
in skin tumors by Shen et al.20 Moreover, Noel et al21 reported
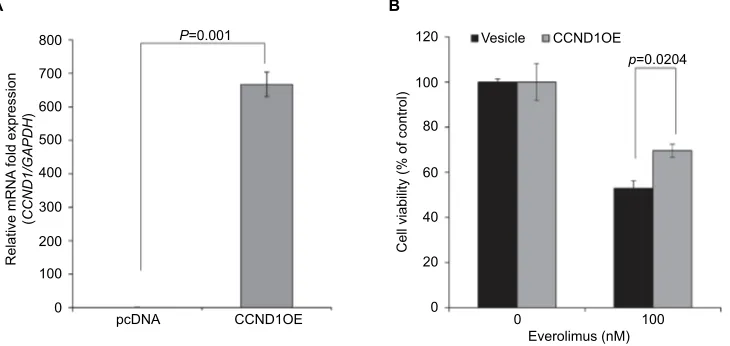
that CCND1 overexpression was related to cisplatin resistance in several cancers. Therefore, we exogenously overexpressed CCND1 in everolimus-sensitive HSC-1 cells. As expected, CCND1-overexpressing HSC-1 cells demonstrated elevated cell viability after everolimus treatment when compared to
control cells (Figure 4). Therefore, upregulated CCND1 leads to everolimus resistance in skin SCC.
Discussion
The mTOR signaling system plays key roles in several
transduction pathways necessary for cellular regulation.22,23
mTOR has two protein kinase complexes: mTOR complex 1 and mTOR complex 2. Among them, the mTOR complex 1
pathway activates several oncogenic signaling pathways.24,25
New insights into the mTOR signaling system are helping to develop new anticancer agents that induce apoptosis and prevent angiogenesis. Thus, drugs known as mTOR inhibi-tors have been passed for use in certain cancers and included
in ongoing cancer trials.26,27 Everolimus, temsirolimus, and
zotarolimus have already been approved for therapeutic use and have been commercialized. These drugs are used to treat kidney, skin, breast, and neuroendocrine cancers. Many other mTOR inhibitors are being developed for clinical and
preclinical studies.28 Recently, an Australian skin cancer
trial showed that cutaneous SCC occurred at a significantly lower rate in the sirolimus group of transplant patients over
a 2-year observation period.13 In the TUMORAPA-1 and
TUMORAPA-N trials, in which a total of 120 patients were enrolled, the rate of SCC-free survival was significantly lon-ger in the sirolimus group than in the calcineurin inhibitor
group.14 Some case reports and small single-center series
suggest that mTOR inhibitors show excellent therapeutic
effects in posttransplant malignancies.29 However, there are
no studies that clarify why mTOR inhibitors are more effec-tive in posttransplantation patients with cutaneous SCC.
In the current study, we demonstrated that the cytotoxic effects of an mTOR inhibitor induced apoptosis in human cutaneous SCC cell lines. MTT and apoptosis assays showed that the mTOR inhibitor exhibited antiproliferative effects in the HSC-1 cell line after 72 hours of incubation. Furthermore, the HSC-1 cell line showed decreased phosphorylated mTOR levels in relation to the mTOR inhibitor concentration using Western blot analysis. Gene profiling was also conducted using microarray analysis. MYC/CCND1/TP73/NUPR1/ SBD/ERBB/CDKN2B genes were associated with the cyto-toxic effects of the mTOR inhibitor. Among them, CCND1 was most closely associated with resistance to mTOR inhibi-tor efficacy with the help of the IPA network.
Unfortunately, this study is limited as it does not include more cutaneous SCC cell lines. However, the response of the mTOR inhibitor was shown to be completely different in both cell lines. Therefore, the obvious difference in gene expres-sion between the two cell lines may be helpful in predicting mTOR inhibitor efficacy. To the best of our knowledge, this
Cancer Management and Research downloaded from https://www.dovepress.com/ by 118.70.13.36 on 20-Aug-2020
Dovepress Identification of mTOR inhibitor-resistant genes SCC
Figure 3 IPA of the genes associated with everolimus resistance.
Notes: (A) The functional pathway analysis network using IPA. (B) Validation of the DEG expression levels significantly involved in the pathway network using qRT-PCR
analysis (*P<0.05 and **P<0.01). (C) Validation of the cyclin D1 using Western blot analysis.
Abbreviations: IPA, Ingenuity Pathway Analysis; DEG, differentially expressed gene; qRT-PCR, quantitative real-time PCR.
A
B
C
6 A431_CON A431_Everolimus
HSC-1_Everolimus HSC-1_CON
5 ****
** ** **
**
** ** **
** **
* *
* *
** **
4
Relative mRNA
fold expression
(Genes
/
GAPD
H
)
3
2
1
0 CCND1
A431 0 100 0 100
Cylin D1 GAPDH HSC-1 Everolimus
(nM)
CDKN2B ERBB2 MYC NUPR1 SBD TP73
Cancer Management and Research downloaded from https://www.dovepress.com/ by 118.70.13.36 on 20-Aug-2020
Dovepress Yu et al
study is the first study to determine the genes associated with the therapeutic resistance of mTOR inhibitors.
Conclusion
The results of our study show that the CCND1 gene is a pre-dictive marker of mTOR inhibitor efficacy. In the future, we aim to determine the gene expressions that are more related to therapeutic effects.
Acknowledgments
This research was funded by grants from the Konyang University Myunggok Research Fund of 2016 and the National Research Foundation of Korea (grant number: NRF-2017R1A2B4003684).
Disclosure
The authors declare no conflicts of interest.
References
1. Alam M, Ratner D. Cutaneous squamous-cell carcinoma. N Engl J Med. 2001;344(13):975–983.
2. Euvrard S, Kanitakis J, Claudy A. Skin cancers after organ transplanta-tion. N Engl J Med. 2003;348(17):1681–1691.
3. Lindelöf B, Sigurgeirsson B, Gäbel H, Stern RS. Incidence of skin cancer in 5356 patients following organ transplantation. Br J Dermatol. 2000;143(3):513–519.
4. Ikegawa S, Saida T, Obayashi H, et al. Cisplatin combination chemo-therapy in squamous cell carcinoma and adenoid cystic carcinoma of the skin. J Dermatol. 1989;16(3):227–230.
5. Khansur T, Kennedy A. Cisplatin and 5-fluorouracil for advanced locoregional and metastatic squamous cell carcinoma of the skin.
Cancer. 1991;67(8):2030–2032.
6. Guthrie TH, Porubsky ES, Luxenberg MN, Shah KJ, Wurtz KL, Watson PR. Cisplatin-based chemotherapy in advanced basal and squamous cell carcinomas of the skin: results in 28 patients including 13 patients receiving multimodality therapy. J Clin Oncol. 1990;8(2):342–346. 7. Sadek H, Azli N, Wendling JL, et al. Treatment of advanced squamous
cell carcinoma of the skin with cisplatin, 5-fluorouracil, and bleomycin.
Cancer. 1990;66(8):1692–1696.
8. Shin DM, Glisson BS, Khuri FR, et al. Phase II and biologic study of interferon alfa, retinoic acid, and cisplatin in advanced squamous skin cancer. J Clin Oncol. 2002;20(2):364–370.
9. Reigneau M, Robert C, Routier E, et al. Efficacy of neoadjuvant cetuximab alone or with platinum salt for the treatment of unresectable advanced nonmetastatic cutaneous squamous cell carcinomas. Br J Dermatol. 2015;173(2):527–534.
10. Lu SM, Lien WW. Concurrent Radiotherapy With Cetuximab or Platinum-based Chemotherapy for Locally Advanced Cutaneous Squamous Cell Carcinoma of the Head and Neck. Am J Clin Oncol. 2018;41(1):95–99 11. Ferris RL, Blumenschein G, Fayette J, et al. Nivolumab for Recurrent
Squamous-Cell Carcinoma of the Head and Neck. N Engl J Med. 2016;375(19):1856–1867.
12. Chow LQM, Haddad R, Gupta S, et al. Antitumor Activity of Pem-brolizumab in Biomarker-Unselected Patients With Recurrent and/ or Metastatic Head and Neck Squamous Cell Carcinoma: Results From the Phase Ib KEYNOTE-012 Expansion Cohort. J Clin Oncol. 2016;34(32):3838–3845.
13. Campbell SB, Walker R, Tai SS, Jiang Q, Russ GR. Randomized con-trolled trial of sirolimus for renal transplant recipients at high risk for nonmelanoma skin cancer. Am J Transplant. 2012;12(5):1146–1156. 14. Euvrard S, Morelon E, Rostaing L, et al; TUMORAPA Study Group.
Sirolimus and secondary skin-cancer prevention in kidney transplanta-tion. N Engl J Med. 2012;367(4):329–339.
15. Hoogendijk-van den Akker JM, Harden PN, Hoitsma AJ, et al. Two-year randomized controlled prospective trial converting treatment of stable renal transplant recipients with cutaneous invasive squamous cell carcinomas to sirolimus. J Clin Oncol. 2013;31(10):1317–1323. 16. Newman RM, Mobascher A, Mangold U, et al. Antizyme targets cyclin
D1 for degradation. A novel mechanism for cell growth repression.
J Biol Chem. 2004;279(40):41504–41511.
17. Liu Y, Li Q, Zhou L, et al. Cancer drug resistance: redox resetting renders a way. Oncotarget. 2016;7(27):42740–42761.
Figure 4 CCND1 overexpression induces everolimus resistance in HSC-1 cells.
Notes: (A) qRT-PCR analysis of exogenous CCND1 expression. (B) Cell viability in control and CCND1-overexpressing cells following treatment with 100 nM of
everolimus.
Abbreviation: qRT-PCR, quantitative real-time PCR.
800
A B
P=0.001
700
600
500
Relative mRNA
fold expression
(
CCND1/GAPD
H
)
Cell viability (% of control)
400
300
200
100
0 0
0
Everolimus (nM) 100
20 40 60 80 100
120 Vesicle CCND1OE
p=0.0204
pcDNA CCND1OE
Cancer Management and Research downloaded from https://www.dovepress.com/ by 118.70.13.36 on 20-Aug-2020
Dovepress Identification of mTOR inhibitor-resistant genes SCC
18. Lau AT, Wang Y, Chiu JF. Reactive oxygen species: current knowledge and applications in cancer research and therapeutic. J Cell Biochem. 2008;104(2):657–667.
19. Pyo CW, Choi JH, Oh SM, Choi SY. Oxidative stress-induced cyclin D1 depletion and its role in cell cycle processing. Biochim Biophys Acta. 2013;1830(11):5316–5325.
20. Shen Y, Xu J, Jin J, Tang H, Liang J. Cyclin D1 expression in Bowen’s dis-ease and cutaneous squamous cell carcinoma. Mol Clin Oncol. 2014;2(4): 545–548.
21. Noel EE, Yeste-Velasco M, Mao X, et al. The association of CCND1 overexpression and cisplatin resistance in testicular germ cell tumors and other cancers. Am J Pathol. 2010;176(6):2607–2615.
22. Kennedy BK, Lamming DW. The Mechanistic Target of Rapamycin: The Grand ConducTOR of Metabolism and Aging. Cell Metab. 2016;23(6):990–1003.
23. Shimobayashi M, Hall MN. Making new contacts: the mTOR net-work in metabolism and signalling crosstalk. Nat Rev Mol Cell Biol. 2014;15(3):155–162.
24. Jewell JL, Russell RC, Guan KL. Amino acid signalling upstream of mTOR. Nat Rev Mol Cell Biol. 2013;14(3):133–139.
25. Zoncu R, Efeyan A, Sabatini DM. mTOR: from growth signal integration to cancer, diabetes and ageing. Nat Rev Mol Cell Biol. 2011;12(1):21–35.
26. Schuler W, Sedrani R, Cottens S, et al. SDZ RAD, a new rapamycin derivative: pharmacological properties in vitro and in vivo. Transplanta-tion. 1997;64(1):36–42.
27. Yu P, Laird AD, du X, et al. Characterization of the activity of the PI3K/ mTOR inhibitor XL765 (SAR245409) in tumor models with diverse genetic alterations affecting the PI3K pathway. Mol Cancer Ther. 2014;13(5):1078–1091.
28. Xie J, Wang X, Proud CG. mTOR inhibitors in cancer therapy.
F1000Res. 2016;5:2078.
29. Holdaas H, De Simone P, Zuckermann A. Everolimus and Malignancy after Solid Organ Transplantation: A Clinical Update. J Transplant. 2016;2016:1–11.
Cancer Management and Research downloaded from https://www.dovepress.com/ by 118.70.13.36 on 20-Aug-2020
Dovepress Yu et al
Supplementary Material
Western blot analysis of p-p70S6K
The cells were treated control and 100 nM everolimus for 48 h and were harvested after washing by ice cold phosphate-buffered saline (PBS). Cells were lysed using RIPA buffer. Proteins in the cell lysates were separated using 8% SDS-polyacrylamide gels and transferred to polyvinylidene difluo-ride membranes (Millipore, Billerica, MA, USA). The blots were incubated in 5% skim milk (Difco, Franklin Lakes, NJ, USA) for 1 h and then probed overnight with primary antibod-ies against p-p70S6K (Cell signaling), p70S6K (Cell Signal-ing) and GAPDH (Santa Cruz Biotechnology). Next day, the blots were incubated with horseradish peroxidase-conjugated
anti-rabbit secondary antibodies. The immunoreactive pro-teins were detected using an enhanced chemiluminescence kit (Thermo Fisher Scientific, Waltham, MA, USA) and visualized using ImageQuant ver. 5.2 (Molecular Dynamics, Sunnyvale, CA, USA). Phosphorylation proteins were
quanti-fied using Image J (https://imagej.nih.gov/ij/).
Cell cycle analysis
The cells were treated control and 100 nM everolimus for 72 h and were harvested after washing by ice cold phosphate-buffered saline (PBS). Change of cell cycle were investigated using PI (Molecular Probes). Flow cytometry analyses were performed using BD FACSVerse System (BD Biosciences, Franklin Lakes, NJ, USA).
Everolimus (nm)
A B
Everolimus (nm) 0 1 10 100
p-P70S6K
P70S6K GAPDH 1 0.9 0.6 0.5
0 1 10 100
p-P70S6K
P70S6K GAPDH 1 0.5 0.4 0.5
Figure S1 Inhibition of p70S6K activity via everolimus treatment in skin SCC cells.
Notes: Everolimus-induced changes in p70S6K activity in A431 (A) and HSC-1 (B) cells were analyzed by performing immunoblotting assays.
0
0 50 100 150
PI
200 250
×1000 0 50 100 150
PI
200 250
×1000
0 50 100 150
PI
200 250
×1000
0 50 100 150
PI
200 250
×1000 50
100 150 200 250 300 350
A
B
0.84%
Control
Control
100 nM everolimus
100 nM everolimus
subG1 G0/G1 S G2/M
subG1 G0/G1 S G2/M
subG1 G0/G1 S G2/M
subG1 G0/G1 S G2/M
16.19 19.97
62.53
1.46% 64.02 15.62 17.63
1.09% 63.09 16.91 17.53
1.33% 69.24 10.70 16.75
Count
0 50 100 150 200 250 300
Count
0 50 100 150 200 250 300 350 400
Count
0 50 100 150 200 250 300 350 400 450
Count
Figure S2 Cell cycle analysis using propididum iodide (Pi) staining.
Notes: a431 (A) and HSC-1 (B) cells were treated with 100nM everolimus for 72h and were stained with PI. DNA content was measured with fluorescence activated cell
sorting (FaCs).
Cancer Management and Research downloaded from https://www.dovepress.com/ by 118.70.13.36 on 20-Aug-2020
Dovepress
Cancer Management and Research
Publish your work in this journal
Submit your manuscript here: https://www.dovepress.com/cancer-management-and-research-journal
Cancer Management and Research is an international, peer-reviewed open access journal focusing on cancer research and the optimal use of preventative and integrated treatment interventions to achieve improved outcomes, enhanced survival and quality of life for the cancer patient. The manuscript management system is completely online and includes
a very quick and fair peer-review system, which is all easy to use. Visit http://www.dovepress.com/testimonials.php to read real quotes from published authors.
Dove
press
Identification of mTOR inhibitor-resistant genes SCC
Cancer Management and Research downloaded from https://www.dovepress.com/ by 118.70.13.36 on 20-Aug-2020