Time-Frequency Based Wavelet Transform
Function for Detection of Power quality
Disturbances by using Simulation
Tausif A. Mohammad1, Mukund R. Salodkar2
PG Student [EPS], Dept. of EE, GHRCE&M, Amravati, Maharashtra, India1 Assistant Professor, Dept. of EE, GHRCE&M, Amravati, Maharashtra, India2
ABSTRACT: With the increase of non linear load such as a range of electronic and microprocessor base equipment power quality becomes the prominent issue now a day. In order to improve the power quality problem, detection of power quality problem must be done first. This paper presents a literature review of the application of wavelet transforms in the detection and analysis of power quality disturbances. The PQ disturbances include wide range of PQ phenomena namely transient (impulsive and oscillatory), short duration variations (interruption, sag and swell), power frequency variations, long duration variations (sustained under voltages and sustained over voltages) and steady state variations (harmonics, notch, flicker etc.) with time scale ranges from tens of nanoseconds to steady sate in this condition extraction become difficult task. This paper presents a comprehensive review of different techniques based on wavelet transform to detect and classify power quality problems and advantages of wavelet transform over other signal processing tools.
KEYWORDS: Power quality, wavelet transform, discrete wavelet transform, multi-resolution analysis
I.INTRODUCTION
POWER QUALITY (PQ) is becoming prevalent and of critical importance for power industry recently. The fast expansion in use of power electronics devices led to a wide diffusion of nonlinear, time-variant loads in the power distribution network, which cause massive serious power quality problems. At the same time, the wide use of accurate electronic devices require extremely high quality power supplies. According to the data provided by Electrical Power Research Institute (EPRI), the US economy is losing between $104 billion and $164 billion a year to outages, and another $15 billion to $24 billion to PQ phenomena [1] Therefore, the research of power quality issues has captured exponentially increasing attention in the power engineering community in the past decade.
Therefore, these days, customers demand higher levels of PQ to ensure the proper and continued operation of such sensitive equipments. According to IEEE standard 1159-1995 , the PQ disturbances include wide range of PQ phenomena namely transient (impulsive and oscillatory), short duration variations (interruption, sag and swell), power frequency variations, long duration variations (sustained under voltages and sustained over voltages) and steady state variations (harmonics, notch, flicker etc.) with time scale ranges from tens of nanoseconds to steady sate. A number of causes of transients can be identified: lightning strokes, planned switching actions in the distribution or transmission system, self-clearing faults or faults cleared by current limiting fuses, and the switching of end-user equipment. Transient phenomena are extremely critical since they can cause over voltages leading to insulation breakdown or flashover. These failures might trip any protection device initiating a short interruption to the supplied power. Excess current produced by transients may lead to complete damage to system equipment during the transient period. Moreover, if such disturbances are not mitigated, they can lead to failures or malfunctions of various [2-3] .
in both time and frequency domain [5]. It provides the unique framework for monitoring the power quality problem. Recent advances in the wavelet transforms provide a powerful tool for power quality analysis [4][5][6].
There are various types of events that can degrade power quality, which makes the identification problems often elusive and difficult. In this paper detection algorithm was developed based on disturbance events from six major categories, which are as follow:
1. Sag / Under voltage 2. Swell / Over voltage 3. Waveform distortion
(a) Harmonic
(b) Harmonic with sag (c) Harmonic with swell (d) Notching
4. Transients
(a) Oscillatory Transient (b) Impulsive Transient or Spike 5. Interruptions
6. Voltage fluctuations/Flicker
II. WAVELET TRANSFORM TECHNIQUE
The wavelet transform represents signal as a sum of wavelets at different locations (positions) and scales (duration). The wavelet coefficients work as weights of the wavelets to represent the signal at these locations and scales. The wavelet transform can be accomplished three differ rent ways. The Continuous Wavelet Transform (CWT) where one obtains the surface of the wavelet coefficients, for different values of scaling and translation factors. It maps a function of a continuous variable into a function of two continuous variables.
The second transform is know as the Wavelet Series (WS) which maps a function of continuous variables into a sequence of coefficients. The third type of wavelet transform is the Discrete Wavelet (DWT), which is used to decompose a discretized signal into different resolution levels. It maps a sequence of numbers into a different sequence of numbers [1-2,4-12].
The continuous wavelet transform was developed as an alternative approach to the short time Fourier transforms to overcome the resolution problem. The important point to note here is the fact that the computation is not a true continuous wavelet. From the computation at finite number of location, it is only a discretized version of the continuous wavelet. Note, however, that this is not discrete wavelet transform (DWT). These days, computers are used to do almost all computations. It is evident that neither the FT, nor STFT, nor the CWT can be practically computed by using analytical equations, integrals, etc. It is therefore necessary to discretize the transforms. As the discretize CWT enables the computation of the continuous wavelet transform by computers, it is not a true discrete transform. As a matter of fact, the wavelet series is simply a sampled version of the CWT, and the information it provides is highly redundant as for as the reconstruction of the signal is concerned. This redundancy, on the other hand, requires a significant amount of computation time and resources. The discrete wavelet transform DWT provides sufficient information both for analysis and the synthesis of the original signal, with a significant reduction in the computation time. The DWT is considerably easier to implement when compared to the CWT.
Wavelet analysis deals with expansion of functions in term of a set of basis functions like Fourier analysis. However, wavelet analysis expands functions not in terms of trigonometric polynomials but in terms of wavelets, which are generated in the form of translations and dilations of a fixed function called mother wavelet. Comparing with FT, wavelet can obtain both time and frequency information of signal, while only frequency information can be obtained by Fourier transform [3, 4]. The signal can be represented in terms of both the scaling and wavelet functions as follows:
F(t) =∑ j (n) ( − ) + ∑ ∑ j (n)2j /2 (2jt-n) (1)
Where Cjis the J level scaling coefficient,
is the scaling function,
( )is wavelet function,
J is the highest level of wavelet transform,
t is time.
Each level is created by scaling and translation operations in a special function called mother wavelet. A mother wavelet is a function that oscillates, has finite energy and zero mean value
.
Wavelet theory is expressed by continuous wavelet transformation as
CWT x(a,b) = W (a,b) = ∫ x(t)ψ (t)a, bdt (2)
where
ψ
a, b(t) =
| |
1/2ψ
((
−
)¦ )
,
a (scale) and b (translation) are real numbers.Equation (2) has great theoretical interest for the development and comprehension of its mathematical properties. However, its discretization is necessary for practical applications. For discrete-time systems, the discretization process leads the time discrete wavelet series as
DWTΨ x(m, n) = ∫ x(t)Ψa, b(t)dt
Ψm, n (b) = a0 –m/2 Ψ((t − nb0a0m)/a0m)
Where a = a0m , b = nb0a0m (3)
DWT provides a time and frequency representation of the recorded power quality signals. This is a very attractive feature in analyzing time series because time localization of spectral components can be obtained. Classical methods of signal processing depend on an underlying notion of stationary, for which methods such as Fourier analysis are very well adapted. In power quality researches, however, more properties other than stationary are required, and thus make the DWT application more appropriate than Fourier transform. The goal of MRA is to develop representations of a signal at various levels of resolution. MRA is composed of two filters in each level which are low pass and high pass filter. MRA can detect and diagnose defects, and provide early warning of power quality problems. Power quality problems are characterized by their maximum amplitudes, crest voltages, RMS, frequency, statistics of wavelet coefficients, instantaneous voltage drops, number of notches, duration of transients, etc. These characteristics are unique identifying features or different power quality problems and introduced signal processing tools in power quality analysis [4-12].
III. DISCRETE WAVELET TRANSFORM ALGORITHM
In Multiresolution analysis (MRA), wavelet functions and scaling of functions are used as building blocks to decompose and reconstruct the signal at different resolution levels. The wavelet functions will generate the detail version of the decomposed signal and the scaling function will generate the approximated version of the decomposed signal. MRA refers to the procedures to obtain low-pass approximations and high-pass details from the original signal. An approximation contains the general trend of the original signal while a detail embodies the high-frequency contents of the original signal. Approximations and details are obtained through a succession of convolution processes. The original signal is divided into different scales of resolution, rather than different frequencies, as in the case of Fourier analysis. The maximum number of wavelet decomposition levels are determined by the length of the original signal and the level of detail required. Details and approximations of the original signal are obtained by passing it through a filter bank, which consists of low and high-pass filters. A low pass filter removes the high frequency components, while the high pass filter picks out the high-frequency contents in the signal being analyzed.
disturbances interval is one of the suitability of WT in the field of electrical PQ. To apply wavelet to identify time intervals of disturbances following steps are taken:
(i) Generate a signal with actual data or developed in any software with known initial and final times. (ii) Apply different wavelet transform with suitable mother wavelet.
(iii) Identify the disturbances intervals with the help of wavelet coefficients.
Choice of analysing mother wavelets plays a significant role in detecting various types of power quality disturbances. Especially when considering small scale signal decompositions. For fast and short transient disturbances, Daub4 (called as Daubechies 4) and Daub6 wavelets are better, while for slow and long transient disturbances, Daub8 and Daub10 are particularly suitable. Selection of an appropriate mother wavelet for all types of PQ disturbances is very important, instead of creating algorithms to select different appropriate wavelets for different problems [3].
At the lowest scale like scale 1, the mother wavelet is most localized in time and oscillates most rapidly within a very short period of time. As the wavelet goes to higher scales, the analysing wavelets become less localized in time and oscillate less due to the dilation nature of the wavelet transform analysis. As a result of higher scale signal decomposition, fast and short transient disturbances will be detected at lower scales, whereas slow and long transient disturbances will be detected at higher scales.
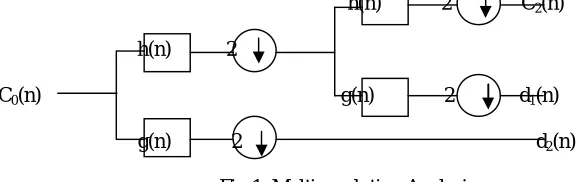
IV. MULTIRESOLUTION ANALYSIS
Multi-resolution analysis technique of wavelet is used in analysis of waveforms and images [9]. Wavelet functions and scaling functions are used as building blocks to decompose and reconstruct the signal at different resolutions in Multi Resolution Analysis (MRA). In MRA two filters scheme is utilized in each level, in which one is low pass filter and another is high pass filter shown in figure below,
h(n) 2 C2(n)
h(n) 2
C0(n) g(n) 2 d1(n)
g(n) 2 d2(n)
Fig 1. Multi resolution Analysis
Let the signal
(C
0n )
is discrete time signal scattered in two levels. This signal is filtered into low frequency componentlevel 1(C1(n)) by using low pass filter (
h
(
n
)
) and into high frequency component level 1(d1(n)) by using high passfilter (
g
(
n
)
). This signal is then passed through down sampling this can be shown by the relation given in eq.(4)-(5). C1(n) = ∑ ℎ( −2 ) 0(k) (4)d1(n) = ∑ ( −2 ) 0(k) (5)
g(n) and h(n) are high pass and low pass filters respectively.
The component obtained after level MRA analysis level 1 will be initial signal for MRA level 2. This signal is then passed through low pass filter and high pass filter. The filter‘s output are the high frequency component in level 2 as relation in eq.(6)-(7).
C2(n) = ∑ ℎ( −2 ) 1(k) (6)
d2(n) = ∑ ( −2 ) 1(k) (7)
V. PROPOSED METHOD ON SIMULATED WAVEFORMS
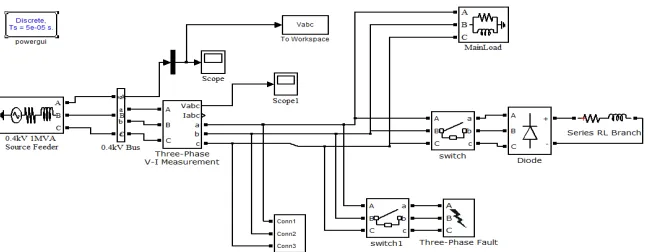
Power quality disturbance signals are generated in matlab Simulink using diagram shown in fig:2. A 0.4KV, 1MVA , 50Hz . Distribution network consist of three phase loads and Various nonlinear load and switches for generation of various power quality disturbances like voltage sag, swell, harmonic, sag with harmonic, swell with harmonic, transients, have been simulated.
Simulation particulars: Total simulation time=1sec, Number of cycles observed=50.
Power Quality Disturbances That Are Analysed Using DWT-MRA are listed as follows[3-12]: 1) Voltage sag / under voltage /
sustained Under Voltage 2) Voltage swell/ over voltage / sustained Over Voltage 3) D.C.Offset
4) Power frequency variation 5) Interruption
6) Hormonics of order seven.
Fig 2. Distribution network considered for analysis
A.PROPOSED METHOD ON SIMULATED WAVEFORM i) Sinusoidal Waveform Generation:-
For comparison purpose sinusoidal waveform also generated. This waveform have generated by using Matlab Simulation the simulation model for sinusoidal wave also shown in fis.2. and sinusoidal waveform as shown in fig.3. A 0.4 KV 1MVA 50Hz source is connected to three phase parallel R-L load through the distributed network which have active power 10e3 W and inductive power 100 var.
Fig 3. Ideal Sine Waveform ii) Voltage Sag:-
Fig 4. Voltage Sag Waveform
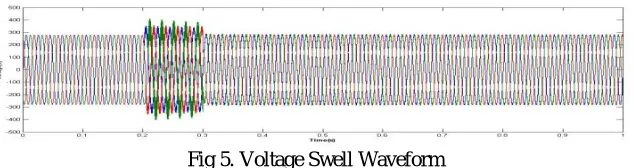
iii) Voltage Swell:-
Voltage swell is defined as the increase in RMS voltage or current to about 10% to 80% at normal supply voltage & its duration of 0.5 cycles to 60 seconds. The causes of voltage swell or is in disconnection of heavy loads capacitor switching and start up lightning. Fig 2. shows the simulation diagram for showing the voltage sag. For the voltage sag load is switch off during time interval 0.2 to 0.3sec through the switch the voltage swell shown in fig.5.
Fig 5. Voltage Swell Waveform iv) Harmonics:-
Harmonics can be defined as sinusoidal waveforms with fundamental frequencies that are multiples of the frequency at which the supply voltage is designed to be delivered. It is generally produced due to non linear loads & electric equipments. THD (Total harmonic distortion) parameter is used for compute the harmonics. Fig. 2 shows the simulation model for harmonic, and harmonic waveform shown in fig.6.
Fig 6. Harmonic in Sine Waveform
v) Transients:-
A transient is a signal with disturbances that suddenly increase from zero to finite time. Transient can classify as Impulsive transient & Oscillatory transient. Impulsive transient are a sudden non power frequency change in the steady state condition of power signal. Oscillatory transients are sudden frequency change in the steady state condition of the power signal. Impulsive transient has only unidirectional polarity but oscillatory transient includes both positive and negative polarity. Fig. 2 shows the simulation model for transient and transient waveform shown in fig.7.
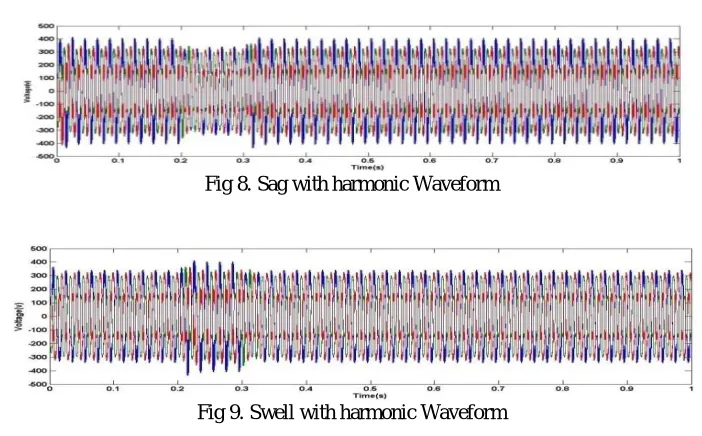
vi) Sag with harmonic & Swell with harmonic :-
The simulation model for generation of both the waveform as shown in fig.2 , and waveform shown in fig 8 & fig 9 respectively.
Fig 8. Sag with harmonic Waveform
Fig 9. Swell with harmonic Waveform
B. DETECTION OF POWER QUALITY DISTURBANCES
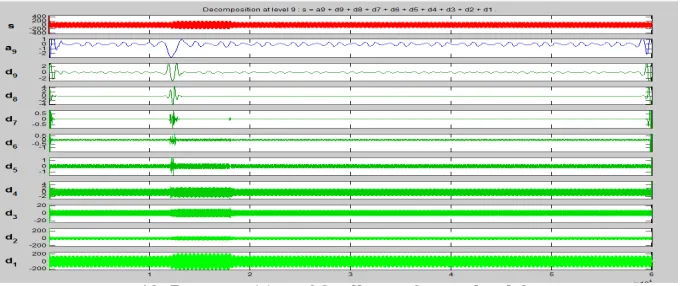
i) Daubechies 5 was used as mother wavelet. Nine level decomposition of Db5 wavelet was used for analysis The following results were observed in the wavelet 1-D analysis. Fig.10 shows the decomposition of sine wave at level 9 of Db5. As it was a pure sine wave, no disturbance was detected .
Fig 10: Decomposition of Sine wave at level 9
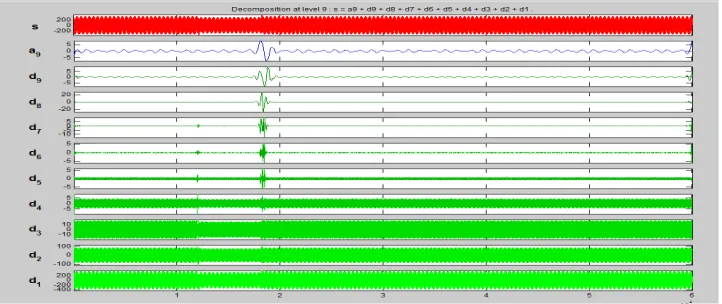
Fig 11: Decomposition of Sag waveform at level 9
ii) Fig.12 shows the decomposition of swell waveform at level 9 of Db5. The swell was detected at second level of decomposition.
12: Decomposition of Swell waveform at level 9
iii) Fig.13 shows the decomposition of sag with harmonic waveform at level 9 of Db5. The sag was detected at second level of decomposition and harmonic was detected at third level of decomposition.
Fig 13: Decomposition of Sag with Harmonic wave at level 9
Fig 14: Decomposition of Swell with Harmonic waveform at level 9
v) Fig.15 shows the decomposition of sag with transient waveform at level 9 of Db5. The sag was detected at second level of decomposition and transient was detected at six level of decomposition.
Fig 15: Decomposition of Sag with Transient waveform at level 9
C. CLASSIFICATION OF PROGRAMMED POWER QUALITY EVENTS
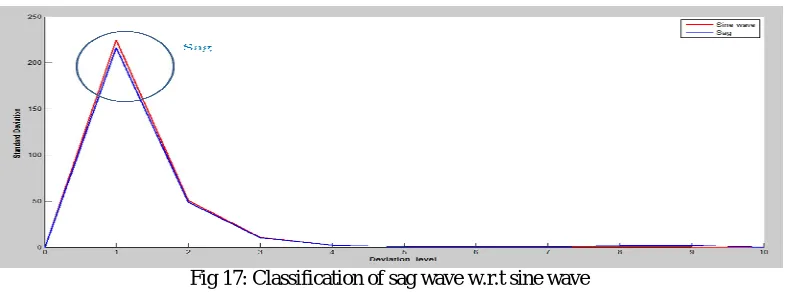
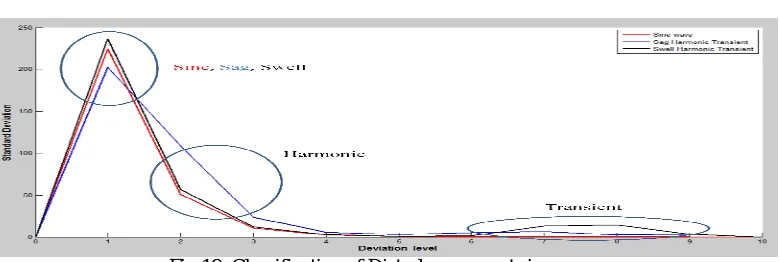
The energy of the power quality disturbance at various levels varies depending on the type of the disturbance. For a normal sinusoidal waveform, the standard deviation value is equal to the energy of the signal (as the mean is zero). Hence, the standard deviation value of the various levels of multi-resolution analysis can give us a comparative indication of any disturbance present within power signal. So the Standard MRA curve is used for classification of various disturbances. The X axis of the Standard MRA curve represents various decomposition levels and Y axis represents Standard deviation values.
Fig 16: STD_MRA Curve for pure Sine wave
ii) The maximum value of the STD-MRA curve is decreases with an amount related to the sag magnitude and duration as shown in Fig.17
Fig 17: Classification of sag wave w.r.t sine wave
iii) The maximum value of the STD-MRA curve is increases with an amount related to the swell magnitude and duration as shown in Fig.18.
Fig 18: Classification of swell wave w.r.t sine wave
Fig 19: Classification of Disturbances w.r.t sine wave
VI.CONCLUSION
In this project new automated power quality detection, classification and measuring, technique are proposed. These techniques are based on wavelet theory and multi-resolution analysis. The localization property of the wavelet transform is used to detect and classify different disturbances. Any distorted event can be decomposed into different resolution levels, The energy of each resolution level can generate a translation invariant feature vector with small dimensionality that cm be used to classify different disturbances according to IEEE std. 1159. Different monitoring devices are available that can measure the duration of a disturbances. The sensitivity of these devices depends on selected threshold levels that may result in missing desired disturbances or capturing large numbers of waveforms. The existence of noise can further mislead the monitoring devices to capture and measure certain disturbances. In the proposed monitoring system, the duration of a distortion event can be measured using the information extracted from the first resolution level, which has the ability to detect any changes in the pattern of the signal and can be utilized to purify the signal from any noise content.
REFERENCES
[1] HAIBO HE,JANUSZ A.STARZYK,“A SELF ORGANISING LEARNING ARRAY SYSTEM FOR POWER QUALITY CLASSIFICATION BASED ON
WAVELET TRANSFORM,”IEEETRANSACTIONS ON POWER DELIVERY,VOL.21,NO.1, PP.286-295,JANUARY 2006.
[2] Devendra Mittal et al “ Classification of Power Quality Disturbances in Electric Power System: A Review,’’IOSR Journal of Electrical and Electronics Engineering (IOSR-JEEE) ISSN: 2278-1676 Vol 3, Issue 5 , PP 06-14.Q, Nov. - Dec. 2012.
[3] IEEE Standards Board, IEEE Std. 1159-1995, IEEE Recommended Practice for Monitoring Electric Power Quality (New York: IEEE, Inc. June, 1995).
[4] P.K.Dash, B.K.Panigrahi and G.Panda, “Power Quality Analysis using S Transform,” IEEE Transaction on Power Delivery, Vol.18, No.2, pp 406-411, April 2003.
[5] D. P. Mishra“Sag, Swell and Interruption Detection Using Wavelet in LabVIEW” International Journal of Computer and ElectricaEngineering, No. 4,Vol. 5, August 2013.
[6] Olivier Poisson et al, “Detection and Measurment of Power Quality Disturbances using Wavelet Transform”, IEEE Transactionon On Power Delivery, Vol.15, No.3, pp 1039-1044, July 2000.
[7] Haili Ma and Adly Girgis, “Identification and Tracking of Harmonics Sources in a Power System Using Kalman Filter”, IEEE Transactions on Power Delivery, Vol. 11,No.3, July 1996.
[8] P. Ribeiro, “Wavelet Transform: An Advanced Tool for Analyzing Non StationaryHarmonic Distortion in Power Systems”, Proceeding of IEEE International Conference On Harmonics in Power Systems, 1994.
[9] A.M.Gauda et al, “Power Quality Detection and Classification using Wavelet Multiresolution Signal Decomposition,” IEEE Transactions On Power Delivery, Vol.14, No. 4, pp. 1469-1476, October 1999.
[10] P. Ribeiro, “Wavelet Transform: An Advanced Tool for Analyzing Non Stationary Harmonic Distortion in Power Systems”, Proceeding of IEEE International Conference On Harmonics in Power Systems, 1994.
[11] Irene Gu, Math Bollen, “Time Frequency and Timescale Domain Analysis of Voltage Disturbances”, IEEE Transactions on PowerDelivery, Vol. 15, No.4 October 2000.