Analysis of Classification Method “VFI” from WEKA by Using
Different Test Mode
Sushilkumar Rameshpant Kalmegh
Associate Professor, Department of Computer Science, Sant Gadge Baba Amravati University, Amravati, Maharashtra, 444606, India.
Abstract
The amount of data in the world and in our lives seems ever-increasing and there’s no end to it. We are overwhelmed with data. The WWW overwhelms us with information. The Weka workbench is an organized collection of state-of-the-art machine learning algorithms and data pre processing tools. The basic way of interacting with these methods is by invoking them from the command line. However, convenient interactive graphical user interfaces are provided for data exploration, for setting up large-scale experiments on distributed computing platforms, and for designing configurations for streamed data processing. These interfaces constitute an advanced environment for experimental data mining. Classification may refer to categorization, the process in which ideas and objects are recognized, differentiated, and understood. Classification is an important data mining technique with broad applications. It classifies data of various kinds. This paper has been carried out to make a performance evaluation of VFI classification algorithm by using different Test Mode. The paper sets out to make comparative evaluation of classifiers VFI in test mode (i) evaluate on training data (ii) 5-fold cross-validation and (iii)10-5-fold cross-validation in the context of dataset of Indian news to maximize true positive rate and minimize false positive rate.
Keywords: Data Mining, Hyperpipe, Naive Bayes, VFI,
WEKA
1. Introduction
Each of the past three centuries has been dominated by a single technology. The eighteenth century was the time of the great mechanical systems accompanying the Industrial Revolution. The nineteenth century was the age of the stream engine. During the twentieth century, the key technology has been information gathering, processing and distribution. Among other developments, we have seen the birth and unprecedented growth of the computer industry. Now as we have entered in the twenty-first century all the most of all manual services are replaced by machine operation i.e. complete computerization and hence released human intelligence is utilized in further developments.
INTERNET has become a major channel of the resources and information. The World Wide Web (WWW) overwhelms us with information; meanwhile, every choice
we make is recorded. The amount of data in the world and in our lives seems ever-increasing and there’s no end to it. We are overwhelmed with data. Today Computers make it too easy to save things. Inexpensive disks and online storage make it too easy to postpone decisions about what to do with all this stuff, we simply get more memory and keep it all. As the volume of data increases, inexorably, the proportion of it that people understand decreases alarmingly. Lying hidden in all this data is information.
In data mining, the data is stored electronically and the search is automated or at least augmented by computer. Even this is not particularly new. Economists, statisticians, and communication engineers have long worked with the idea that patterns in data can be sought automatically, identified, validated, and used for prediction. What is new is the staggering increase in opportunities for finding patterns in data. Data mining is a topic that involves learning in a practical, non theoretical sense. We are interested in techniques for finding and describing structural patterns in data, as a tool for helping to explain that data and make predictions from it. Experience shows that in many applications of machine learning to data mining, the explicit knowledge structures that are acquired, and the structural descriptions, are at least as important as the ability to perform well on new examples. People frequently use data mining to gain knowledge, not just predictions.
2. LITERATURE SURVEY
2.1 WEKA
Weka was developed at the University of Waikato in New Zealand; the name stands for Waikato Environment for Knowledge Analysis The system is written in Java and distributed under the terms of the GNU General Public License. It runs on almost any platform and has been tested under Linux, Windows, and Macintosh operating systems and even on a personal digital assistant. It provides a uniform interface to many different learning algorithms, along with methods for pre and post processing and for evaluating the result of learning
schemes on any given dataset. Weka provides implementations of learning algorithms that can be easily apply to dataset. It also includes a variety of tools for transforming datasets, such as the algorithms.
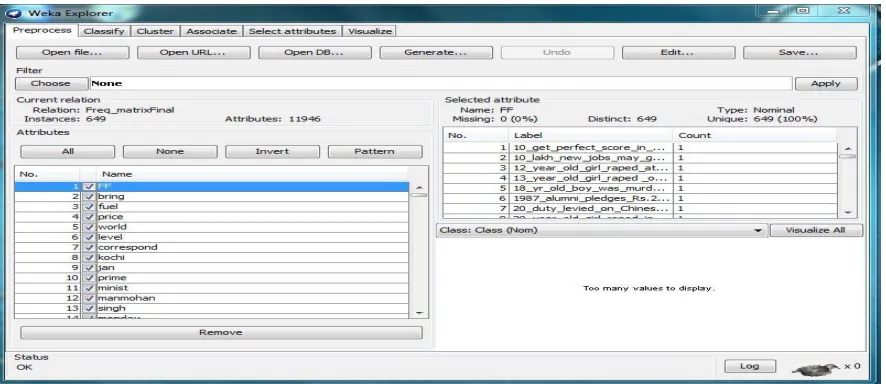
The Weka workbench is a collection of state-of-the-art machine learning algorithms and data pre processing tools. It is designed so that we can quickly try out existing methods on new datasets in flexible ways. It provides extensive support for the whole process of experimental data mining, including preparing the input data, evaluating learning schemes statistically, and visualizing the input data and the result of learning. As well as a variety of learning algorithms, it includes a wide range of pre processing tools. This diverse and comprehensive toolkit is accessed through a common interface so that its users can compare different methods and identify those that are most appropriate for the problem at hand. All algorithms take their input in the form of a single relational table in the ARFF format. The easiest way to use Weka is through a graphical user interface called Explorer as shown in Figure 1. This gives access to all of its facilities using menu selection and form filling.
Fig. 1 : Weka GUI Explorer
The Weka contains a collection of visualization tools and algorithms for data analysis and predictive modeling, together with graphical user interfaces for easy access to this functionality. Advantages of Weka include:
• Free availability under the GNU General Public License
• Portability, since it is fully implemented in the Java programming language and thus runs on almost any modern computing platform.
• A comprehensive collection of data preprocessing and modeling techniques.
• Ease of use due to its graphical user interfaces.
Weka supports several standard data mining tasks, more specifically, data preprocessing, clustering, classification, regression, visualization, and feature selection. All of Weka's techniques are predicated on the assumption that the data is available as a single flat file or relation, where each data point is described by a fixed number of attributes (normally, numeric or nominal attributes, but some other attribute types are also supported). Weka provides access to SQL databases using Java Database Connectivity and can process the result returned by a database query. Weka's main user interface is the Explorer, but essentially the same functionality can be accessed through the component-based Knowledge Flow interface and from the command line. There is also the Experimenter, which allows the systematic comparison of the predictive performance of Weka's machine learning algorithms on a collection of datasets. The Explorer interface features several panels providing access to the main components of the workbench. Figure 2 shows Opening of file *.arff by Weka Explorer and Figure 3 shows processing of arff file for VFI Classifier. [1], [6], [7]
2.2 Classification
Classification may refer to categorization, the process in which ideas and objects are recognized, differentiated, and understood. An algorithm that implements classification, especially in a concrete implementation, is known as a classifier. The term "classifier" sometimes also refers to the mathematical function, implemented by a classification algorithm that maps input data to a category.
In the terminology of machine learning, classification is considered an instance of supervised learning, i.e. learning where a training set of correctly identified observations is available. The corresponding unsupervised procedure is known as clustering or cluster analysis, and involves grouping data into categories based on some measure of inherent similarity.
Classification is a data mining algorithm that creates a step-by-step guide for how to determine the output of a new data instance. The tree it creates is exactly that: a tree whereby each node in the tree represents a spot where a decision must be made based on the input, and to move to the next node and the next until one reach a leaf that tells
the predicted output. Sounds confusing, but it's really quite straightforward.
There is also some argument over whether classification methods that do not involve a statistical model can be considered “statistical". Other fields may use different terminology: e.g. in community ecology, the term "classification" normally refers to cluster analysis, i.e. a type of unsupervised learning, rather than the supervised learning. [2], [6], [7]
2.2.1 VFI (Voting Frequency Intervals)
VFI (voting feature intervals) constructs intervals around each class by discretizing numeric attributes and using point intervals for nominal ones, records class counts for each interval on each attribute, and classifies test instances by voting. A simple attribute weighting scheme assigns higher weight to more confident intervals, where confidence is a function of entropy. VFI is faster than Naïve Bayes but slower than HyperPipes. This
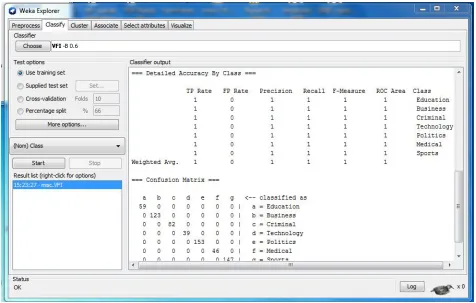
Fig. 3: Processing Of arff File By VFI Classifier, Test Mode: evaluate on training data
classification algorithm has been proposed by G.Demiroz and A. Guvenir [3]. Classification by voting feature intervals. Intervals are constructed around each class for each attribute (basically discretization). Class counts are recorded for each interval on each attribute. Classification is by voting.
Voting feature interval classifier is a simple heuristic attribute weighting scheme. Intervals are constructed for numeric attributes. For each feature per interval, class counts are recorded and classification is done by voting. Higher weight is assigned to more confident intervals. The strength of the bias towards more confident features is set to 0.
The VFI algorithm is a classification algorithm which is based on the concept of voting frequency intervals (therefore the name given VFI). In this algorithm, every training instance is represented as a vector of features. This also has a label which represents the class of that instance. Then for each feature, feature intervals are constructed. A set of values for a given feature where the same subset of class values is observed, is represented by an interval. Therefore, two adjacent intervals represent different classes. Two phases are there, training phase and the classification phase. In the training phase, the feature intervals are to be found. These are calculated by calculating the lowest and highest feature value for each linear feature for each class. The observed feature values are taken into consideration for nominal features. For every linear feature with k classes, 2k values are found. These are then sorted and every pair of consecutive points forms a feature interval and point intervals are formed for nominal values. Every interval is represented in the form of a vector as (lower, count1, count2....countk), where lower denotes the lowest feature value and count i denotes the number of training instances of class i which fall into that interval. Next, in the classification phase, the interval i of a new instance e is found out. Then, for every class a feature vote is calculated. These votes are normalized and the class that has the highest feature vote is the class predicted for the new instance.
The VFI algorithm is a classification algorithm based on the voting frequency intervals. In VFI, each training instance is represented as a vector of features along with a label that represents the instance class. Feature intervals are then constructed for each feature. An interval represents a set of values for a given feature where the same subset of class values is observed. Thus, two adjacent intervals represent different classes [1] [4] [5].
3. SYSTEM DESIGN
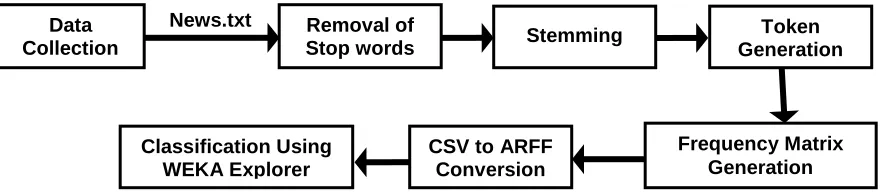
In order to co-relate News with the categories, a model has been designed. Flow diagram of the model for news resources is shown below in Figure 4. As a input to the model, various news resources are considered which are available online like the news in Google news repository or online paper like Times of India, Hindustan Times etc. Around 649 news were collected on above repository. In order to extract context from the news and co-relate it, the News was process with Stop words removal, stemming and tokenization on the news contents. The news then was converted into the term frequency matrix for further analysis purpose. The frequency matrix is having extension .csv, so it has to be converted in arff format for processing by WEKA. Based on this data, features (i.e. metadata) were extracted so that contextual assignment of the news to the appropriate content can be done. Title of the news also contains useful information in the abstract form, the title also can be considered as Metadata. The title of the news is processed using NLP libraries (Standford NLP Library) to extract various constituents of it
As shown in the figure, a news resource is processed to correlate with the Contents available. On the similar way, other text resources can be added directly in the repository, Image or Video resource can be processed for meta-data available.
Data Collection
Removal of
Stop words Stemming
Token Generation
Frequency Matrix Generation CSV to ARFF
Conversion Classification Using
WEKA Explorer News.txt
Fig. 4: Flow diagram of the model
4. DATA COLLECTION
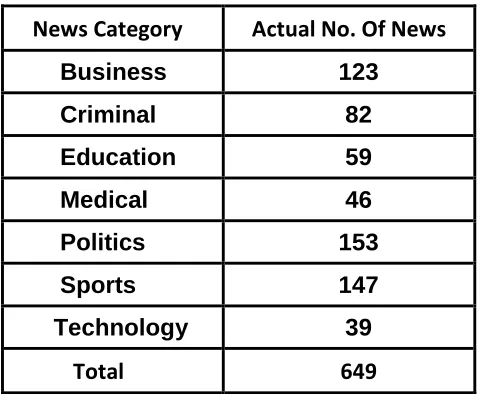
Hence it was proposed to generate indigenous data. Consequently the national resources were used for the research purpose. Data for the purpose of research has been collected from the various news which are available in various national and regional newspapers available on internet. They are downloaded and after reading the news they are manually classified into 7 (seven) categories. There were 649 news in total. The details are as shown in Table 1.
Table 1: Categorization of News
News Category
Actual No. Of News
Business
123
Criminal
82
Education
59
Medical
46
Politics
153
Sports
147
Technology
39
Total
649
The attributes consider for this classification is the topic to which news are related; the statements made by different persons; the invention in Business, Education, Medical, Technology; the various trends in Business; various criminal acts e.g. IPC and Sports analysis. During classification some news cannot be classified easily e.g. (1) Political leader arrested under some IPC code,
(2) Some invention made in medicine and launched in the market & business done per annum.
Hence, there will be drastic enhancement in the Contents when we refer to the latest material available in this regards. For example, if some news refers to the political situation of India, then the references needs to be dynamic as the situation may change depending on the result of election. [6] [7]
5. Performance Analysis
The News so collected needed a processing. Hence as given in the design phase, all the news were processed for stop word removal, stemming, tokenization and ultimately generated the frequency matrix. Stemming is
used as many times when news is printed, for a same there can be many variants depending on the tense used or whether it is singular or plural. Such words when processed for stemming, generates a unique word. Stop words needs to be removed as they do not contribute much in the decision making process. Frequency matrix thus generated can be processed for generating a model and the model so generated was used in further decision process.
With the model discussed above, classifier VFI from misc. was used on the data set of 649 news. For processing Weka GUI interface were used. The result after processing is given in the form of confusion matrix for test mode i) evaluate on training data ii) 5-fold cross-validationand iii) 10-fold cross-validation which is shown in Table 2, 4 and Table 6. True Positive and False Positive Rate matrix for test mode i) evaluate on training data data ii) 5-fold cross-validationand ii) 10-fold cross-validation which is shown in Table 3, 5 and Table 7.
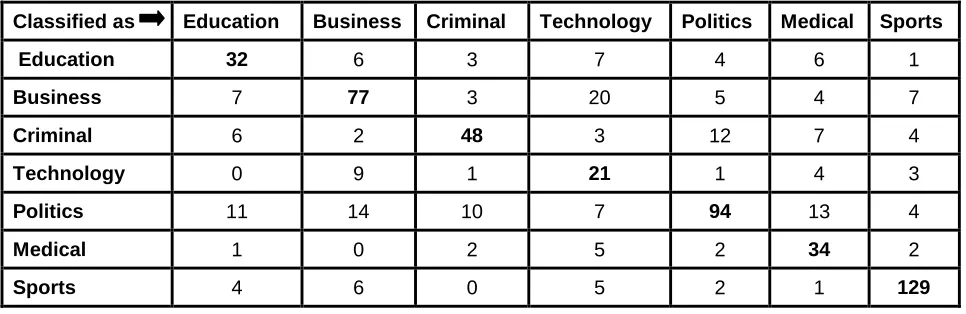
Overall Performance of VFI algorithm is excellent for test mode i) evaluate on training data, it can been Table 2 for Test mode: evaluate on training data. However from the Table 4 and 6 some of news from all category are classified into other catgory for Test mode: 5- fold cross-validation and 10-fold cross-cross-validation. This is because every category has some or other references of the other category. Hence as it can be seen in the Table II and Table III it has given 100% accuracy for Test mode: evaluate on training data. But this 100% accuracy is not achieved for Test mode: 5-fold validation and 10-fold cross-validation, the another reason for this is that, In n-fold cross-validation, the original sample is randomly partitioned into n subsamples. Of the n subsamples, a single subsample is retained as the validation data for testing the model, and the remaining n – 1 subsamples are used as training data. The cross-validation process is then repeated n times (the folds), with each of the n subsamples used exactly once as the validation data. The n results from the folds then can be averaged (or otherwise combined) to produce a single estimation.
Table 2. Confusion Matrix for VFI -B 0.6 for Test mode: evaluate on training data
Classified as Education Business Criminal Technology Politics Medical Sports
Education 59 0 0 0 0 0 0
Business 0 123 0 0 0 0 0
Criminal 0 0 82 0 0 0 0
Technology 0 0 0 39 0 0 0
Politics 0 0 0 0 153 0 0
Medical 0 0 0 0 0 46 0
Sports 0 0 0 0 0 0 147
Table 3: Table showing True Positive and False Positive Rate of VFI -B 0.6 for Test mode: evaluate on training data
Class TP Rate FP Rate Precision Recall F-Measure ROC Area
Education 100% 0% 100% 100% 100% 100%
Business 100% 0% 100% 100% 100% 100%
Criminal 100% 0% 100% 100% 100% 100%
Technology 100% 0% 100% 100% 100% 100%
Politics 100% 0% 100% 100% 100% 100%
Medical 100% 0% 100% 100% 100% 100%
Sports 100% 0% 100% 100% 100% 100%
Weighted Avg. 100% 0% 100% 100% 100% 100%
Table 4. Confusion Matrix for VFI -B 0.6 for Test mode: 5-fold cross-validation
Classified as Education Business Criminal Technology Politics Medical Sports
Education 32 6 3 7 4 6 1
Business 7 77 3 20 5 4 7
Criminal 6 2 48 3 12 7 4
Technology 0 9 1 21 1 4 3
Politics 11 14 10 7 94 13 4
Medical 1 0 2 5 2 34 2
Sports 4 6 0 5 2 1 129
Table 5: Table showing True Positive and False Positive Rate of VFI -B 0.6 for Test mode: 5-fold cross-validation
Class TP Rate FP Rate Precision Recall F-Measure ROC Area
Education 54.2% 4.9% 52.5% 54.2% 53.3% 84.4%
Business 62.6% 7% 67.5% 62.6% 65% 83.1%
Criminal 58.5% 3.4% 71.6% 58.5% 64.4% 84%
Technology 53.8% 7.7% 30.9% 53.8% 39.3% 83.1%
Politics 61.4% 5.2% 78.3% 61.4% 68.9% 85.8%
Medical 73.9% 5.8% 49.3% 73.9% 59.1% 90.5%
Sports 87.8% 4.2% 86% 87.8% 86.9% 93.4%
Weighted Avg. 67% 5.3% 69.9% 67% 67.8% 86.8%
Table 6. Confusion Matrix for VFI -B 0.6 for Test mode: 10-fold cross-validation
Classified as Education Business Criminal Technology Politics Medical Sports
Education 33 6 4 7 4 4 1
Business 7 79 3 18 3 6 7
Criminal 7 1 51 2 11 5 5
Technology 1 9 0 22 1 5 1
Politics 12 14 8 7 96 12 4
Medical 1 0 1 5 2 36 1
Sports 5 5 0 4 2 1 130
Table 7: Table showing True Positive and False Positive Rate of VFI -B 0.6 for Test mode: 10-fold cross-validation
Class TP Rate FP Rate Precision Recall F-Measure ROC Area
Education 55.9% 5.6% 50% 55.9% 52.8% 83.7%
Business 64.2% 6.7% 69.3% 64.2% 66.7% 82.6%
Criminal 62.2% 2.8% 76.1% 62.2% 68.5% 83.5%
Technology 56.4% 7% 33.8% 56.4% 42.3% 83.2%
Politics 62.7% 4.6% 80.7% 62.7% 70.6% 84.9%
Medical 78.3% 5.5% 52.2% 78.3% 62.6% 93.7%
Sports 88.4% 3.8% 87.2% 88.4% 87.8% 94.3%
Weighted Avg. 68.9% 4.9% 71.8% 68.9% 69.6% 86.8%
6. Conclusions
This paper has designed a model which will help to categorize the VFI classifier from WEKA in different test mode (i) evaluate on training data (ii) 5-fold cross-validation and (iii)10-fold cross-cross-validation in the context of dataset of Indian news
As per the previous discussion identification of news from dynamic resources can be done with the propose model. As a result it is found that VFI algorithm performs well in categorizing all the News for Test mode: evaluate on training data. This is due to VFI (voting feature intervals) constructs intervals around each class by discretizing numeric attributes and using point intervals for nominal ones, records class counts for each interval on each attribute, and classifies test instances by voting. Overall Performance of VFI algorithm is acceptable for the test mode: 5-fold cross-validation and 10-fold cross-validation, except some of News from every category are classified into other category. For overall data set detection rate (True Positive rate) for VFI clasiifier is 100% for the test mode : evaluate on training data and whereas it is 67% for the Test mode: 5-fold cross-validation and surprisingly 68.9% for the Test mode: 10-fold cross-validation.
References
[1] Ian H. Witten, Eibe Frank & Mark A. Hall., “Data Mining Practical Machine Learning Tools and Techniques, Third Edition.” Morgan Kaufmann Publishers is an imprint of Elsevier.
[2] http://en.wikipedia.org/wiki/Classification
[3] G. Demiroz, A. Guvenir, “Classification by voting feature intervals”. 9th European Conference on Machine Learning, 1997, PP. 85-92,
[4] Rupali Malviya, Brajesh K. Umrao, “ Comparison of NBTree and VFI Machine Learning Algorithms for Network Intrusion Detection using Feature Selection”, International Journal of Computer Applications (0975 – 8887) Volume 108, No. 2, December 2014, pp. 35-38
[5] Hany M. Harb, Malaka A. Moustafa, “SelectingOptimal Subset of Features for StudentPerformance Model”, IJCSI International Journal of Computer Science Issues, Vol. 9, Issue 5, No 1, September 2012, pp. 253-262
[6] Sushilkumar Rameshpant Kalmgh, “Comparative Analysis of WEKA Data Mining Algorithm RandomForest, RandomTree and LADTree for Classification of Indigenous News Data”, International Journal of Emerging Technology and Advanced Engineering, Volume 5, Issue 1, January 2015, pp. 507-517 [7] Sushilkumar Kalmegh “Analysis of WEKA Data Mining
Algorithm REPTree, Simple Cart and RandomTree for Classification of Indian News”, IJISET - International Journal of Innovative Science, Engineering & Technology, Vol. 2 Issue 2, February 2015, pp. 438-446
Sushilkumar R. Kalmegh received M.Sc.
Computer Science (1994), Ph.D. (2014) from Sant Gadge Baba Amravati University, Amravati. Working as Associate Professor in Computer Science in the faculty of Engg. & Tech. in the Department of Computer Science at SGBAU. Amravati. Published 10 Research paper in international Journal. Member of Indian Science, CSI and ISTE. Area of interest is Data Mining.