116 | P a g e
MODELLING OF FUNCTIONAL PARAMETER OF
EARTHEN DAM BREACH BY ARTIFICIAL NEURAL
NETWORK AND RANDOM FOREST
Sanjeev Kumar¹, Dr. Baldev Setia²
¹M.Tech Student, Department of Civil Engineering, NIT Kurukshetra, Haryana, (India)
²Professor, Department of Civil Engineering, NIT Kurukshetra, Haryana, (India)
ABSTRACT
The paper investigates the modelling of functional parameter of earthen dam breach. The output values of
breach depth of embankment dam were calculated by with the help of artificial neural network (ANN) and
Random Forest (RF) modelling techniques. Two standard statistical potential evaluation calculated, such as the
correlation coefficient (CC) and root mean square error coefficient (RMSE) have been utilized to judge the
performance of modeling techniques. . Data set consists of 60 observations were obtained from the laboratory
experiments. Out of 60 samples arbitrarily selected 42 observations were used for training whereas residual 18
were used for testing the models. Input data set consist of discharge, time and depth whereas width of dam is
considered as output. A comparison of results suggest that random forest works well than artificial neural
network (ANN) and it could successfully use in modelling of width of embankment dam.
Keyword:
Breach formation, Random Forest, Artificial Neural Network, breach parameter.
I .INTRODUCTION
Embankments are constructed for the retention of water for irrigation and supply, and for protecting people,
land, and property from flooding. Failure of any embankment poses risks to people and property nearby and the
services provided by the embankment. A dam is a boundary that appropriates water or underground streams.
Supplies made by dams smother surges as well as give water to exercises, for example, water system, human
utilization, mechanical utilize, aquaculture, and safety. Hydropower is regularly utilized as a part of conjunction
with dams to create power. A dam can likewise be utilized to collect water or for capacity of water which can be
equally circulated between areas. Earth and rock fill dams are by and large used all through the world, and the
vast majority of the past dam failure included such dams.
In specialized writing, dam failure examination is partitioned into two principle parts. In the first place,
examination of the failure and breach process and, second, stream directing and extraction of the immersion
maps because of dam break. The failure of a solid dam ordinarily happens quickly; be that as it may, then again,
earthen dams step by step bomb because of the constant increment of an underlying break. For this situation, the
yield hydrograph is identified with the disintegration condition that happens inside the rupture. Accordingly, the
arrangement needs assist examination to study security administration of the dams. Distinctive reasons may lead
117 | P a g e however the initial two are the most widely recognized and vital causes. Although some dam failure because of
stream overtopping have been now observed and investigated by water driven designers, there is as yet a need
promote bits of knowledge into the wonder and to grow more powerful recreation models. As in an earth dam
failure prepare the piping mode is changed to an overtopping mode after some time, the specific worry in this
review is centered dam failure because of flow overtopping.
A few scientists have created recipes in view of discovery models and historical dam break information that
have empowered them to anticipate rupture parameters, for example, time of breach arrangement, breach
geometry and peak outflow from break. For example, Johnson and Illes (1976) were the first to predicted failure
shapes for earth, gravity and curve solid dams. Additionally, MacDonald and Monopolis (1984), Singh and
Snorrason (1984), FERC (1987), Von Thun and Gillette (1990) and Froehlich (1995) created equations to
predict the time breach development and break geometry. Kirkpatrick (1977), the US Bureau of Reclamation
(1982), Costa (1985), Froehlich (1995) and Webby (1996) have directed reviews to decide the peak outflow as a
component of dam height and reservoir storage volume.
II. METHODOLOGY AND DATA SET
The tests were conducted in a straight flume 12m long, 0.4m wide and 0.60m deep (see Figure 1). In this water
recirculation during experiments, this flume had a silt trap toward one side and a water channel at the other
side. The breach develops mainly vertically with only ignorable widening due tolimited width of flume. To get
test information on the breaching of overtopped homogeneous embankment, small scale physical investigations
were conducted at research laboratory. In whole experiments discharge were keep constant. A homogeneous
bank show comprising of material was utilized on a fixed bed. The breach procedure was started by
overtopping the embankment crest. Each test was performed under identical pore volume and moisture content.
Two modeling approaches, ANN and Random Forest were applied on the experimentally observed data (Table
1) to predict the value of width of embankment dam. The detailed description of the applied modeling
approaches are described in next section. Data set consists of 60 observations were used and Obtained from the
laboratory experiments. Input data set consists of discharge, depth and time whereas width of dam was
considered as output. The characteristics of experimental data are specified in Table 1
Table 1: The characteristics of training and testing data set
Input
units
Training data
parameters Min. Max. Mean Standard Dev.
Discharge 25 25 25 0
Time min 0.5 290.6 145.55 205.131
Depth cm 1.23 19.12 10.175 12.650
Width cm 2.3 20.8 11.55 13.081
Testing data
Min. Max. Mean Standard Dev.
118 | P a g e
Time min 0.333 360.5 180.416 254.676
Depth cm 1.98 18.63 10.305 11.773
Width cm 2.4 19.8 11.10 12.303
III. ANN MODELLING TECHNIQUE
Artificial neural network (ANN) is an elastic numerical structure, which is able to identify the complex
nonlinear associations between input data sets to output data sets (Onen, 2014). It is inspired by the functioning
of nervous system and brain architecture. The networks comprise a huge no. of simple processing element
linked to each other by weighted connections according to specified architecture. It has one input, one or more
hidden and one output layers. Each layer consists of number of nodes and the weighted connection between
these layers represents the link between nodes. Input layers having nodes equal to number of input parameters,
distributes the data presented to the network and does not help in processing. This layer follows one or more
hidden layers which help in processing of data. The output layer is final processing unit. Artificial neural
networks are computational methodologies that perform complex analyses. The purpose of most favorable
number of hidden layers and hidden neurons is regularly cumbersome, as no general methodology is accessible
for their determination. Many applications of artificial neural networks have been reported in the literature, and
applications in medicine are growing. The artificial neural system (ANN), with the error back-spread technique,
is at the origin of an interesting methodology similar with regression examination, yet especially productive for
non-linear information (Lendasse et al., 2000). In the last decade, research into ANNs has shown explosive growth. They are often applied in physics research like speech recognition (Chu, 1998) and image recognition
(Dekruger and Hunt, 1994; Kung and Taur, 1995). A large number of trials have been carried out to find the
optimal values of parameter of ANN. The optimal parameters were selected on the basis of statistical parameters
(C.C. and RMSE). Table 2 shows the optimal values of user-defined parameters of ANN.
Table 2: Optimal values of user-defined parameters of ANN
Learning rate Momentum Hidden layer
neuron
No. of iterations
0.3 0.2 4 100
IV. RANDOM FOREST REGRESSION
Random forest is a classification and regression process, consisting of a combination of tree predictors where
every tree is produced utilizing a random vector sampled autonomously from the input vector. In regression, tree
predictor proceeds on numerical values as arbitrary to class labels used by the random forest classifier (Breiman,
1999). Random forest regression used in present study consists of using a combination of variables or randomly
selected variable at each node to mature a tree. Plan of a tree predictor required the decision of a variable choice
measure and a pruning strategy. Different approach to manage the decision of variable for tree acknowledgment
119 | P a g e regularly utilized variable choice measures in tree enlistment are Information Gain Ratio basis (Quinlan1992)
and Gini Index (Brieman et. al., 1984).
The plan of random forest regression allows a tree to create to the most extreme depth of new preparing
information utilizing the mixing of factors. These full-created trees are not pruned back. This is one of the
primary favourable circumstances of random forest regression over other tree systems like M5P tree show
(Quinlan 1992). Thinks about recommend that the choice of the pruning procedure and not the variable
assurance, impact the execution of tree based calculations (Pal and Mather, 2003). Breiman (1999) proposes that
as the amount of trees builds, the theory mistake dependably focalizes even without pruning the tree and over
fitting is not an issue in perspective of the Strong Law of large numbers (Feller, 1968).
V .ANALYSIS OF RESULTS
To assess the effectiveness of ANN model and RF model in predicting width of the embankment dam.
Correlation coefficient (C.C.) and root mean square error (RMSE) values obtained with test data set were used
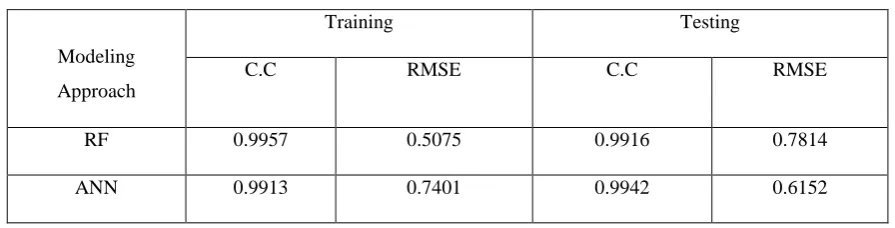
to compare the performance of ANN with RF. Table 3 provides the values of the correlation coefficient and
RMSE values provided by different predictive approaches. Comparison of results suggests improved
performance by ANN regression in terms of C.C., RMSE values used with this data set. A substantial
improvement in predictive accuracy of ANN approach indicates that it can be effectively used in predicting of
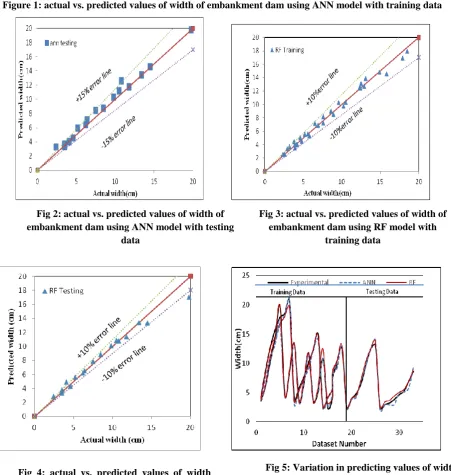
width of dam. Fig. 1and 2 shows the agreement of actual and predicted width of embankment dam for training
and testing data set using ANN shows the agreement diagrams of actual and predicted width of embankment
dam using ANN and RF respectively.
Table 3: Detail of performance evaluation parameters using RF and ANN of training and
testing data set
Fig. 3 and 4 shows the agreement of actual and predicted width of embankment dam for training and testing data
set using Random Forest (RF) respectively. The values of correlation coefficient 0.9957, 0.9916 and values of
Root Mean Square Error 0.5075, 0.7814 were achieved for training and testing data set using Artificial Neural
Network respectively. Fig. 5 indicates that the performance of RF is better than ANN in training and testing
period. RF estimated values is closer the actual values and follows the same path of actual values. Modeling
Approach
Training Testing
C.C RMSE
C.C RMSE
RF 0.9957 0.5075 0.9916 0.7814
120 | P a g e
Figure 1: actual vs. predicted values of width of embankment dam using ANN model with training data
Fig 4: actual vs. predicted values of width of embankment dam using RF model with testing data
Fig 5: Variation in predicting values of width of embankment dam using the different regression approach in comparison to actual values of width of
embankment dam
Figure 5: Variation in predicting values of width of
embankment dam using the different regression Fig 2: actual vs. predicted values of width of
embankment dam using ANN model with testing data
Fig 3: actual vs. predicted values of width of embankment dam using RF model with
121 | P a g e
VI. CONCLUSION
This paper examines the potential of artificial neural network (ANN) and random forest (RF) approaches in
predicting the width of embankment dam. From the comparison of performance evaluation parameters, it has
been observed that RF approach works well than ANN. It can be successfully used in estimation width of
embankment dam.
REFERENCES
[1] MacDonald, T. C. & Monopolis, J. L. 1984 Breaching characteristics of dam failures. J. Hydraul. Eng. 110
(5), 567–586.
[2] Singh, K. P. & Snorrason, A 1984 Sensitivity of outflow peaks and flood stages to the selection of dam
breach parameters and simulation models. J. Hydrol. 68, 295–310.
[3] Federal Energy Regulatory Commission, FERC 1987 Engineering Guidelines for the Evaluation of Hydropower Projects, FERC 0119-1. Office of Hydropower Licensing, Washington, DC, USA. 9 pp.
[4] Von Thun, J. L. & Gillette, D. R. 1990 Guidance on Breach Parameters, unpublished internal document. US
Bureau of Reclamation, Denver, Colorado, 17 pp.
[5] Froehlich, D. C. 1995 Peak outflow from breached embankment dam. J. Water. Res. Pl. 121 (1), 90–97.
[6] Kirkpatrick, G. W. 1977 Evaluation Guidelines for Spillway Adequacy. The Evaluation of Dam Safety.
Engineering Foundation Conference, ASCE, Pacific Grove, California, pp. 395–414.
[7] US Bureau of Reclamation 1982 Guidelines for Defining Inundated Areas Downstream from Bureau of
Reclamation Dams. Reclamation Planning Instruction 8, 2–11.
[8] Costa, J. E. 1985 Floods from dam failures. U.S Geological Survey Open-File Report 85–560, Denver,
Colorado, 54 pp.
[9] Webby, M. G. 1996 Discussion of peak outflow from breached embankment dam. J. Water Res. Pl. 122 (4),
316–317.
[10] Chu, S. (1998). Nobel Lecture: The manipulation of neutral particles. Reviews of Modern Physics, 70(3), 685.
[11] DeKruger, D., & Hunt, B. R. (1994). Image processing and neural networks for recognition of cartographic area features. Pattern Recognition, 27(4), 461-483.
[12] Kung, S. Y., & Taur, J. S. (1995). Decision based neural networks with signal/image classification applications. IEEE Transactions on Neural Networks, 6(1), 170-181.
[13] Breiman, Leo. "1 RANDOM FORESTS-RANDOM FEATURES." (1999).
[14] Pal, Mahesh, and Paul M. Mather. "An assessment of the effectiveness of decision tree methods for land
cover classification." Remote sensing of environment 86, no. 4 (2003): 554-565.
[15] Feller, William. An introduction to probability theory and its applications: volume I. Vol. 3. New York:
John Wiley & Sons, 1968.
[16] Breiman, Leo, Jerome Friedman, Charles J. Stone, and Richard A. Olshen. Classification and regression
trees. CRC press, 1984.