972 | P a g e
A survey on Automatic Analysis of Statistical Properties of
Rheumatoid Arthritis using Digital Image Processing
Prof G.S. Mate
1, Dr. A. K. Kureshi
21Department of Electronics, JSPM’s Rajarshi Shahu college of Engineering, Savitribai Phule Pune Univerity
,
(India)2
Department of Electronics, Vishwabharati College of Engineering, Ahmadnagar Savitribai Phule Pune Univerity, (India)
ABSTRACT
Rheumatoid arthritis destroys joints of the body like erosion in bones which intern may cause deformity and
characterized by inflammation of the tissue around the joints as well as in other organs of the body. At the
beginning of this disease mainly the joints of hand and wrist are affected making hand radiograph analysis very
important. Lately manual JSW measurement in hand X-ray digital radiograph of Arthritis patients were in use
but it has disadvantages like inaccuracy, inter-reader variability. The reproducible quantification of the
progression of joint space narrowing and the erosive bone destructions caused by RA is crucial during
treatment and in imaging biomarkers in clinical trials. Current manual scoring methods exhibit interreader
variability, even after intensive training, and thus, impede the efficient monitoring of the disease. Hand
radiograph analysis is difficult for radiologist as there are 14 number of hand joints. To avoid observer
dependency, computer-aided analysis is required. Wrist joint space narrowing is a main radiographic outcome
of rheumatoid arthritis (RA). Yet, automatic radiographic wrist joint space width (JSW) quantification with
statistical properties for RA patients has not been widely investigated. The automated analysis of statistical
properties helps to reduce need of skilled personnel.
Keywords: digital image, joints, Rheumatoid Arthritis, statistical properties.
1. INTRODUCTION
Arthritis is a common bone disease that mainly affects the joints of the body; basically fingers, hands, knees.
This may lead to disability, premature mortality and chronic ill-health. There are mainly two types of arthritis
Rheumatoid arthritis (RA) and Osteoarthritis (OA). Rheumatoid arthritis is a complex disease in which the patient’s immune system attacks its own tissue causing swelling and inflammation in the joints and damage of
tissues and other organs. Rheumatoid arthritis (RA) causes pain, swelling, stiffness, and loss of function in the
joints. Much of the rheumatoid arthritis research being conducted focuses on immune mechanisms involved.
Rheumatoid arthritis destroys joints of the body like erosion in bones which intern may cause deformity and
ankylosis in the later stage of the disease. At the beginning of this disease mainly the joints of hand and wrist are
affected making hand radiograph analysis very important. Lately manual JSW measurement in hand X-ray
digital radiograph of Arthritis patients were in use but it has disadvantages like inaccuracy, inter-reader
973 | P a g e a start and halt progression, with periods of active disease followed by periods of remission. Rheumatoid
arthritis (RA) is characterized by inflammation within the joint space as well as erosion or destruction of the
bone surface. Persistent inflammation over time can damage affected joints. The severity can vary from mild to
severe. Treatments include disease-modifying medicines to suppress inflammation, which can prevent or delay
the progression of the disease, and medication to ease pain. The earlier treatment is started, the less joint damage
is likely to occur. Surgery is needed in some cases if a joint becomes badly damaged. The various imaging
technologies were studied in order to evaluate the severity of disease. But, limitation exists in all the current
technologies. The assessment of multiple joints with magnetic resonance imaging (MRI) is time-consuming and
too expensive for routine use [16].
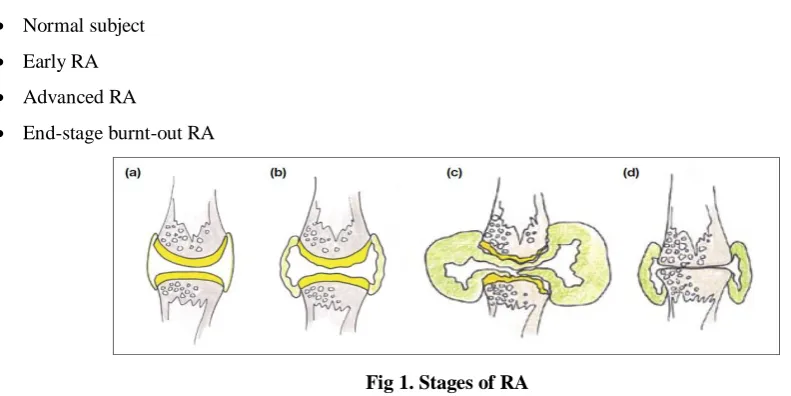
1.1 Stages of RA : Fig 1 shows the different stages of Rheumatoid arthritis
Normal subject
Early RA
Advanced RA
End-stage burnt-out RA
Fig 1. Stages of RA
1.2 The Use of Imaging Scans in the Detection and Monitoring of RA
For decades, X-ray images have been used to help detect RA and to monitor for the progression of bone
damage. In early RA, however, X-rays may appear normal although the disease is active – making the films
useful as a baseline but not much help in getting a timely diagnosis and treatment. Enter modern imaging
techniques, including ultrasound and magnetic resonance imaging (MRI), which can reveal early, non-bony
signs of RA that are invisible on X-ray. ―Both MRI and ultrasound are more sensitive at detecting bone erosion
than X-ray. That capability has become increasingly important with the development of ways to slow the RA
disease process, before serious bone and joint damage occurs, using disease-modifying antirheumatic drugs
(DMARDs), including biologics. Both ultrasound and MRI can detect inflammation of the lining of the joints,
and tendon abnormalities. In addition, MRI detects areas of increased fluid (edema) in bone marrow that is a
predictor for the development of bony erosions. While musculoskeletal MRI is quite expensive and requires an
experienced radiologist to read, rheumatologists often have access to power Doppler ultrasound in their offices –
used most frequently to guide joint aspirations and injections. Many rheumatologists are able to add ultrasound
to their physical exam, but quantifiable measures of what distinguishes RA from normal on ultrasound (or how
many joints need to be examined) have been lacking. In research presented at the American College of
974 | P a g e measurements taken in small, medium, and large joints could help physicians diagnose RA. For most joints,
they were able to quantify a level of change that clearly distinguished RA patients from controls. However
valuable ultrasound is not a solo diagnostic test for rheumatoid arthritis.
There are 35-70 million people are affected by RA in world wide. Since there is no proven cure for RA available
yet, current treatments mainly focus on pain relief, inflammation reduction, and slowing down or stopping joint
damage. In order to prevent irreversible joint damage, early detection of RA is essential. For an effective
medical treatment it is important that the disease can be monitored closely. Joint damage assessment in hand
radiographs is a frequently used method for monitoring the progression of RA.
The following questions about RA are still unanswered which motivate to do the research on RA.
Where and why does RA start?
Why does it attack the joints?
Why doestn’t it go away?
The motivation behind such system is that most of the previous related works of image analysis systems are not
automated for the analysis of RA according to statistical properties like age factor and continuous progression of
RA activity. There is not automated system for recognizing the severity of RA stage by seeing the image of
affected area like hand, knee etc. Rheumatoid arthritis occurs as a result of uncontrolled joint inflammation, but
it is not.
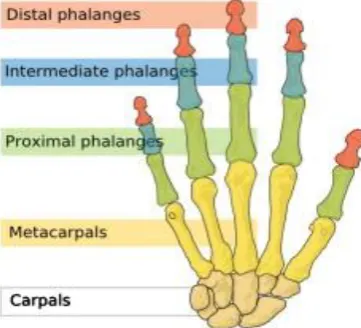
Fig 2 shows the details of joints of hand.
Fig 2 Joints of hands with names of joints plane II. LITERATURE SURVEY
Rheumatoid Arthritis (RA) results in pain of primary peripheral joints like fingers, wrist and feet. This disease
results in joint pain, stiffness, swelling of the joints which showed deformity and ankylosis in the late stages of
the disease. So its detection is of at most important in early stages, Various researchers has proposed methods
like MRI, X-Ray, Radiography, Thermography etc. for the detection of RA. For supporting research in RA
Sumitra Nair[1] have proposed application based on machine learning for study of EMG images patterns for
RA. Kernal LSK method is used for study of the limb displacement in space.
Georg Langs et al have proposed Automatic Quantification of Joint Space Narrowing and Erosions in RA
975 | P a g e progression. Based on a hand radiograph bone positions and contour delineations are determined by algorithm. Cao Mills et al have proposed ―Towards Quantitative Assessment of RA using Volumetric Ultrasound[3] This
algorithm for segmenting 1) the 3 -D bone surface and 2) the 3-D joint capsule region. They extends 2-D bone
extraction methods to 3-D and make algorithm more robust to the intensity loss due to surface normal’s facing
away from incident acoustic beams. The extracted bone surfaces coupled with a joint-specific anatomical model
are used to initialize a coarse localization of the joint capsule region. The joint capsule segmentation is refined
iteratively utilizing a probabilistic speckle model.
Yinghe Huo et al. have proposed automatic joint detection in rheumatoid arthritis hand radiographs [5]. This
method has focused on both joint location and joint margin detection. An automatic unsupervised joint location
and joint margin detection method with a high detection rate was proposed. Secondly, the margin span is
anatomically defined. The experiments are carried out on five 16-bit grayscale hand radiographs with resolution
2500 × 2000 pixels (0.1 × 0.1 mm). All detected joints are evaluated with the manual joint delineation. Syaiful
Anam et al. have proposed automatic bone boundary detection in hand radiographs by using modified level set
method and diffusion filter [6]. The method proposed by them has shown good extraction performance.
However, the mask operation in this method could not work well for some images because the pixel intensities
of bone and the pixel intensities of other areas are similar in some parts. Koay et al. [7] extracted ten features
from thermal image for each quadrant of each breast. Quadrants were defined having nipple as a common point.
Extracted features were skewness, standard deviation difference, mean temperature difference, entropy,
maximum, median, minimum, kurtosis, area and heat content.. The SPSS statistical software was used to
determine the correlation mong the features after feature extraction.
Lipari and Head [8] used asymmetry between breasts and quadrants. The features extracted are: standard
deviation median, mean, minimum and maximum value of temperature for each breast and Segmentation of
Thermal Images for Evaluation of Rheumatoid Arthritis Disease quadrant. The paper didn’t reflect any results in
sensibility or specificity, some comparisons of values between features extracted from each breast and quadrant.
Kuruganti and Qi [9] segmented each breast in thermal images using generalized HT to extract parabolic curves
defining the lower part of the breast. In return, the following features were extracted from the histogram of each
breast region four moments mean, variance, skewness, kurtosis and entropy measures. They used six normal and
eighteen cancer affected thermograms to validate the proposed classification method. It was observed by the
authors that the high-order statistics skewness and kurtosis proved to be most effective features to measure
asymmetry, while low-order statistics and entropy do not help in the detection of asymmetries. To validate their
methodology, the authors had implemented the correlation measure to asymmetric analysis. From the set of
features derived from the testing images, the existence of asymmetry is verified by computing the ratios of
features of left to the right region of interest.
Schaefer et al. [10] proposed an application of content- based image retrieval (CBIR) to thermal medical
images. CBIR allows the retrieval of same images based on features extracted directly from the image data.
Padmavathi et al. [11] indicated that fuzzy c means algorithm with thresholding is an effective algorithm in
segmenting underwater images. Zhou et al. [12] in their study indicated that fuzzy c means algorithm has been
shown to be work well for clustering based segmentation. S. Belongie et al. [13] used color and texture based
976 | P a g e
Table 1: Summery of Literature survey
Paper Feature extraction Evaluation Method Characteristics Sumitra Nair[1] Focused on EMG patterns of
radiograph images
Kernal LSK algorithm nueral network linear discriminant algorithm
Subset of muscles are most differentiated
Georg Langs[2] Automatic quantification of JSN and erosion in RA
JSN Measures two indicators for
disease progression
Cao Mills[3] Volumetric ultrasound Quantitative assessment of RA Detected 3 D bone joints
Yinghe Huo et al. [5]
This method has focused on both joint location and joint margin detection
An automatic unsupervised joint location and joint margin detection method
Detected joints are evaluated with the manual joint delineation
Syaiful Anam et al. [6]
Aautomatic bone boundary detection in hand radiographs
By using modified level set method and diffusion filter
Automatic bone boundary detection by modified diffusion filter
Koay et al. [7] Mean, standard deviation, median, maximum, minimum, skewness, kurtosis, entropy, area and heat content
Artificial neural network (ANN) with back propagation
At end, they use just two features: mean and standard deviation
Lipari and Head. [8]
Mean, median, standard deviation, maximum and minimum value of temperature for each mama and each quadrant
An algorithm of semi- automatic segmentation
Four reference points Each of these points connected to the nipple separates the image into four distinct quadrants.
Kuruganti and Qi. [9]
Means, variance, skewness, and kurtosis, the peak pixel intensity of the correlated image, entropy and joint entropy
Correlation measure to asymmetric analysis
Segmented each breast in thermal images using generalized HT to extract parabolic curves defining the lower part of the breast. Schaefer et al.
[10]
Basic statistical features, moments, histogram features, cross co-occurrence matrix, mutual information, and Fourier analysis
Fuzzy rule-based classification system
Statistical methods and fuzzy classification to diagnose breast cancer
Padmavathi et al. [11]
This method had focus on ROI Fuzzy c means algorithm in segmentation
Fuzzy clustering algorithm videlicet fuzzy c-mean and adaptive fuzzy clustering algorithm
Zhou et al. [12] Pixel intensities Fuzzy C-means algorithm Clustering based segmentation
S. Belongie et al. [13]
Color and texture based image segmentation
EM algorithm Automatic segmentation based on
image features
III. LIMITATIONS OF EXISTING LITERATURE • Detection of RA in early stage repeatedly requires X-rays
• No automatic tool for detecting and suggesting the treatment for RA. • The treatment available only slow down progression of RA
• No analysis of RA available by considering statistical characteristics of patient
IV. COMPARATIVE STUDY OF EXISTING LITERATURE
977 | P a g e Table 2: Different algorithms and their accuracy
Type of Input image Algorithm Accuracy
Hand x-ray DTCWT based watershed algorithm 92.9
Hand X-ray Joint space detection algorithm 96
Hand x-ray shape LLM 95
Hand Knee x-ray Backpropagation 82
Hand Knee x-ray Perception 71
V.PROPOSED SYSTEM
The doctor examines each joint, looking for tenderness, swelling, warmth and painful or limited movement. The
number and pattern of joints affected can also indicate RA. For example, RA tends to affect joints on both sides
of the body. A specialist with specific training and skills diagnose and treat RA. In its early stages, RA may
resemble other forms of inflammatory arthritis. No single test can confirm RA. To make a proper diagnosis, the
rheumatologist will ask questions about the personal and family medical history perform a physical exam and
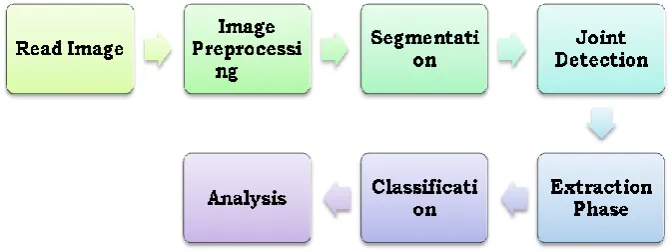
order diagnostic tests. For performing the research, image processing and feature extraction techniques will be
used. The block diagram of the proposed system is given as follows in Fig .2
Fig 3 Proposed system block diagram
VI. CONCLUSION
Currently RA is treated based on x-ray images and preparing treatment plan. For the lab observation of positive
subjects no automated or alternative system is available. Major of the work carried out till date concentrates on
medical images like X-ray, CT, MRI, EMG. As no computerized system is available ,expert opinion is required
every time. Automatic detection of JSN and erosion for predicting RA factor and ESR is the need of time which
will definitely help the doctors to act as an automotive tool for predicting the erosion and RA in the early stage.
REFERENCES
[1] Sumitra S. Nair, Robert French,et al – The Application of Machine learning Algorithms to the Analysis of
Electromyographic Patterns from RA, IEEE Transaction on Nueral Systems and Rehabitalization
978 | P a g e [2] Gorg Langs et al- Automatic Quantification of Joint Space Narrowing and Erosions in RA‖ IEEE
Transaction on Medical Imaging Vol 28,No 1 Jan 2009.
[3] Kunlin Cao, David Mills ―Towards Quantitative Assessment of RA using Volerteic Ultrasound‖ IEEE
Transaction on Biomedical Engineering Vol 62 ,No 2 Feb 2016.
[4] Yinghe Huo, Koen L. Vincken, Max A. Viergever, Floris P. Lafeber, ―Automatic joint detection in
rheumatoid arthritis hand radiograph‖., In IEEE 10th International Symposium on Biomedical Imaging:
From Nano to Macro San Francisco, CA, USA, April 7-11, 2013.
[5] Syaiful Anam, Eiji Uchino, Hideaki Misawa, and Noriaki Suetake, ―Automatic bone boundary detection
in hand radiographs by using modified level set method and diffusion filter‖., In IEEE 6th International
Workshop on Computational Intelligence and Applications, Hiroshima, Japan, July 13, 2013.
[6] J. Koay, C. Herry, M. Frize, ―Analysis of breast thermography with an artificial neural network‖.,
Engineering in Medicine and Biology Society—p vol 1(1) 1159–1162, 2004.
[7] C. Lipari and J. Head, ―Advanced infrared image processing for breast cancer risk assessment‖.,
Proceedings for 19th International Conference of the IEEE Engineering in Medicine and Biology Society,
vol. 2, Chicago, IEEE/EMBS, pp. 673–676, 30 October to 2 November 1997.
[8] P. T. Kuruganti and H. Qi, ―Asymmetry analysis in breast cancer detection using thermal infrared
images‖., Proceedings of Second Joint EMBS/BMES Conference, Houston, TX, USA, pp. 1129–1130,
2002.
[9] G. Schaefer, S.Y. Zhu, B. Jones, ―An image retrieval approach for thermal medical images‖., Medical
Image Understanding and Analysis, pp. 181–183, 2004.
[10] G. Padmavathi, Muthukumar, ―Image segmentation using fuzzy c means clustering method with
thresholding for underwater images‖., Int Journal of Advanced Networking and Applications, vol 2(2), pp.
514- 518, 2010.
[11] H. Zhou, G. Schaefer ,C. Shi, ―A mean shift based fuzzy c-means algorithm for image segmentation‖., in
proc IEEE Eng Med Biol Soc, pp. 3091-3094, 2008.
[12] S. Belongie, C. Charson, H. Greenspan, J. Malik, ―Color and texture based image segmentation using em
and its application to content based image retrival‖., in proceeding of computer vision. Sixth International
Conference, pp. 675-682, 2010.
[13] Dunn J. C, ―A Fuzzy relative of the ISODATA process and its use in detecting compact well separated
clusters‖.. Journal of Cybernetics, vol. 3, pp. 32–57, 1974.
[14] Robert L, Cannon, Jitendra V, ―Efficient implementation of the fuzzy c-means clustering algorithms‖.,
IEEE Transactions on Pattern Analysis and Machine Intelligence, vol. PAMI-8, no. 2, March 1986.
[15] Backhaus M, Kamradt T, Sandrock D, Loreck D,Fritz J, Wolf KJ, ―Arthritis of the finger joints: a
comprehensive approach comparing conventional radiography, scintigraphy, ultrasound, and
contrast-enhanced magnetic resonance imaging‖.. Arthritis Rheum, vol 42(6), pp. 1232-1245, 1999.
[16] Chin Lin at al ―Automatic Prediction of RA Disese Activity from the Electronic Medical Records, vol 8
979 | P a g e [17] Bhayashree et al , ―Determination and analysis of Arthritis using Digital imaging techniques, IJEEDC,
ISSN 2320-2084, vol 2 Issue 9,2014.
[18] Rajesh Pathak ,Dipesh Das ―Analysis of RA from Bio Medical images‖ ,IJMTER,ISSN 2349-9745,2015