12 | P a g e
Production Flow Analysis through Value Stream Mapping
1
Himanshu Vasnani ,
2Amit Tiwari ,
3
Dr. Neeraj Kumar,
4Mahendra Labana
1,2Assistant Professor, M.E Department, Suresh Gyan Vihar University, Jaipur [Raj]( India)
3
Professor & HOD, M.E Department, Suresh Gyan Vihar University, Jaipur [Raj] (India)
4
MC Nally Bharat Engineering Company Ltd Zawar Mines Udaipur Rajasthan (India)
I. INTRODUCTION
1.1 Overview
Value Stream Mapping has the reputation of uncovering waste in manufacturing, production and business processes by identifying and removing or streamlining non-value-adding steps. A flow diagram showing the process is drawn to reflect the current state of the operation. The non-value actions are identified in each step and between each step by their waste of time and resources. The process is analysed for opportunity to drastically reduce and simplify it to the fewest actions necessary. By reducing wastefulness the proportion of value adding time in the whole process rises and the process throughput speed is increased [27]. This makes the redesigned process more effective (the right things are being done) and more efficient (needing fewer resources). The reengineered process is flow charted in its future state with process steps and information flows redesigned, simplified and made less expensive.
What is Value Stream Mapping?
The use of Value Stream Mapping (VSM) has been attributed to the cause of much of the success that Toyota of Japan has had since the 1980‟s1. Developed during the work conducted by Taiichi Ohno at Toyota in the 1960‟s and 70„s, at its basic level VSM is a systematic methodology to identify wasted time and actions in a
manufacturing process. In more recent times VSM it has been used to re-engineer businesses because it identifies unnecessary effort and resources to permit simplification and streamlining of operations processes. In Taiichi Ohno‟s words - “All we are doing is looking at the time line from the moment the customer gives us an
13 | P a g e
Waste is one of the seven wastes identified by Toyota. These are: 1. Overproduction: Producing items for which there are no orders.
2. Waiting Time: Employees standing about. Inventory at stand-still.
3. Unnecessary Transport: Moving material unnecessarily or long distances.
4. Over-processing: Using more steps to produce a product than necessary.
5. Excess Inventory: Retaining unnecessary inventory between process steps.
6. Unnecessary Movement: Any wasted motion by man or machine.
7. Defect: Making incorrect product.
Flow is the continuous movement of inventory from step to step in a smooth, steady pattern and level rate.[38] Toyota says that when the process is right production „flows like water‟. Value is from the customer‟s
14 | P a g e
Value Stream Mapping Methodology
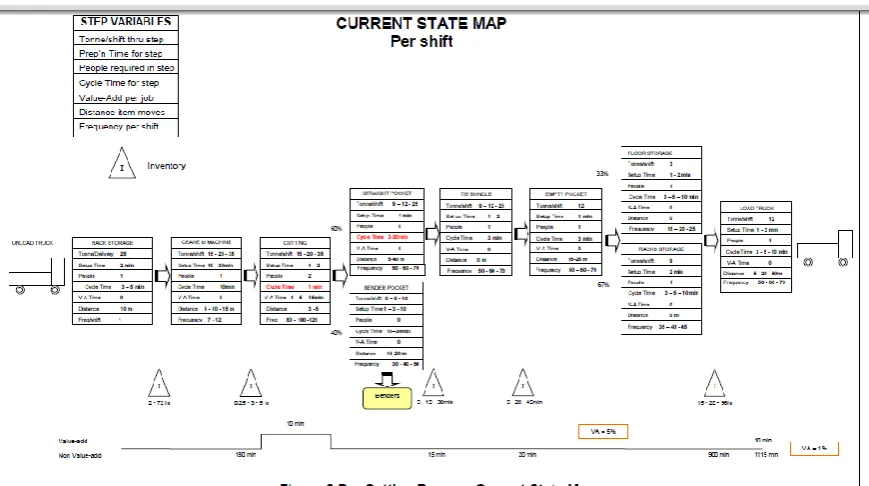
In VSM we follow a process from start to finish monitoring and measuring what happens within, and between, each process step. For each process step we record the variety of resources used in the step, the amount of their usage and the range of times each resource is in use as a block of information specific to that step. The measured variables are collected together in a „variable block‟ as shown in Figure 4. Note the spread, or variation, of the
variables is recorded and not just the average. The presence of variability offers great opportunity for improvement[31].
15 | P a g e
the „I‟ inside a triangle. Under the triangle is noted the range of times (quickest, average, longest) the inventory
can take to be moved. A visualisation of the location of value-add and non-value-add steps is presented as a line across the bottom of the page which jumps up during a value-adding step and stays low for all other times. The current state map is scrutinised step by step to identify which of the functions and actions performed in the step/process add „customer-value‟ and which do not.
The non-value-adding actions and resources are analysed to find where they can be minimised through time-saving and cost-time-saving improvements [36]. A secondary benefit of timing the process steps and measuring the rate of throughput is identification of the bottleneck step(s). The bottlenecks can be redesigned to lift their capacity and so increase the output rate of the whole process. The reengineered process is drawn on a new flow chart known as the „future state map‟. It shows all the steps and information flows in a redesigned, simplified
and more efficient process. A basic future state map block diagram for the bar cutting process is shown in Figure 10.
Investigation
16 | P a g e
Analysis
The worth of VSM becomes self-evident during the analysis phase. Once a business or manufacturing process is drawn as a series of steps and described in numerical terms, the inherent oddities and inconsistencies become evident. The first analysis performed is to compute a ratio of total customer-value-adding time to total process time to see how customer-effective is the process. Often this figure is in the single digits. A low customer-value-adding ratio indicates a process design without the customer‟s wishes being considered. The fortunate aspect of
non-customer-oriented processes is the great scope offered to cut big amounts of waste and cost from them. Other important factors to identify during the analysis are the variability between good and poor performance in each of the process steps and the time that inventory is standing still between steps. Poor inventory speed is an indicator of too much work-in-progress not levelled to the bottleneck rate. Variability indicates inconsistent and uncoordinated practices which need to be streamlined and proceduralised. The good aspect of variability is that without spending money improvements are made by discovering what causes the good and the poor performance and changing practices and procedures to do more of the good, and less of the poor. Numerous simple statistical techniques are available to analyse the data produced during the investigation. Scatter plots, Pareto charts, pie diagrams, cause and effect diagrams and the like are easy tools and methods to apply in analysing data for its hidden information. The problems identified in the process are quantified in terms of the costs and customer-non-value-adding time they take. By giving a money value to the waste and the non-value we have a powerful business motivator to make changes[14].
Identifying Improvements
Opportunities for improvement readily present themselves as the analysis is conducted. When developing proposals it is ideal if that the users of the process are included in identifying the solutions so they take ownership for the future implementation. During the analysis simplifications in process steps are identified, procedural changes to stop wasted actions show themselves, and equipment and process modifications needed to increase throughput rates become evident. The selected improvements are included in the redesigned „future state map‟ of the process.
Identifying less obvious improvements is helped by simplify the process into function blocks with single word function descriptors as shown above the variable blocks in Figure 9. By taking the process back to its most basic components it is possible to redesign the process by removing, combining and overlaying its basic functions to arrive at a simplified and higher customer-value-added operation. Figure 10 shows the steel bar cutting process with increased value-added and inventory speed achieved by halving the early morning deliveries and introducing a second late morning delivery so that the finished steel did not sit in storage a second time after manufacture. A further benefit was 5-6 hours of labour saving[45].
17 | P a g e
18 | P a g e
II. LITERATURE REVIEW
K. Venkataraman, B.Vijaya Ramnath , V.Muthu Kumar , C.Elanchezhian [1] discussed that Lean manufacturing initiative is being followed by various organizations in the recent years which mainly focuses on improving the efficiency of operations by eliminating and reducing wastes. They aimed to explain the implementation of lean manufacturing techniques in the manufacturing system . The objective of the case industry was to increase the export sales. Lean manufacturing system was selected to meet the company‟s
quality, cost and delivery targets.
Rahani AR, Muhammad al-Ashraf [2] layed emphasis on „Lean‟‟ approach which has been applied more than frequent in many manufacturing management floors over these few decades. Started in the automotive industry, sequential improvement initiatives were implemented to enhance the manufacturing practice changes. Value Stream Mapping (VSM) is one of the key lean tools used to identify the opportunities for various lean techniques. The contrast of the before and after the LP initiatives in determine managers potential benefits such as reduced production lead-time and lower work-in-process inventory. As VSM involves in all of the process steps, both value added and non-value added, are analyzed and using VSM as a visual tool to help see the hidden waste and sources of waste. A Current State Map is drawn to document how things actually operated on the production floor. Then, a Future State Map is developed to design a lean process flow through the elimination of the root causes of waste and through process improvements. An Implementation Plan then outline details of the steps needed to support the LP objectives.
Benjamin Haefner, Alexandra Kraemer, Torsten Stauss, Gisela Lanza [3] put a light on Companies in the manufacturing industry today are faced with increasing challenges with respect to cost effectiveness, lead time and quality of the production system. Dealing with these contradictory goals, an important task is the selection of suitable solutions for the integration of inspection processes within the process chain, which are necessary to ensure the required production quality. For this, supportive and easily applicable planning techniques are required to analyze and design the configuration of a respective process chain. Value Stream Mapping (VSM) is a state of the art tool which is very often used for this by professionals. It, however, is not capable of addressing the issue of a suitable integration of testing processes within the process chain. Yet, this provides valuable potential to facilitate the identification of effective testing equipment, testing strategies and quality control loops. Therefore, in this article an innovative approach called Quality Value Stream Mapping (QVSM) is presented. Based on the design elements of VSM, it provides a suitable tool for the visualization, analysis and design of quality assurance measures within process chains in manufacturing. The implementation of the developed approach is exemplarily shown for a complex value chain of a manufacturer in the electronic industry.
19 | P a g e
concludes with evidence of the early results of the programmes as well as a number of key learning points for other organisations wishing to follow a similar path.
Stephen L. Woehrle, Louay Abou-Shady [5], emphasized on Lean has proven to be an effective management philosophy for improving businesses in a competitive market by eliminating waste and improving operations. An impact of implementing lean projects is the rapid reduction in inventory levels, which gives management the false impression that profits are decreasing while workers on the shop floor observe improvements in operations and increased floor space. This paper explores the literature on lean manufacturing, value stream mapping (VSM), Simulation and lean accounting in order to incorporate and integrate them for the purpose of solving the dilemma between lean implementation benefits and financial and accounting reporting methods
Ulf K.Teichgräber, MaximiliandeBucourt [6] here tells about interventional radiology services by applying value stream mapping(VSM).Materials and methods: The Lean manufacturing technique was used to analyze
the process of material and information flow currently required to direct endovascularstents from external suppliers to patients. Based on a decision point analysis forth eprocurement of
stents in the hospital, a present state VSM was drawn. After assessment of the current status VSM and progressive elimination of unnecessary NVA waste, a future state VSM was drawn.
Clifford S. Barber and Brian C. Tietje [7] told us that Lean thinking has become pervasive in manufacturing, but its use in sales remains exploratory. In this paper, he demonstrate the sales application of an essential tool for lean management called value stream mapping. We conceptualize sales as a process in which a buyer and seller jointly participate in creating value, and using a case study, we demonstrate how this process can be mapped and analyzed. Finally, we discuss opportunities and challenges for future research, particularly the importance of customer-centric value metrics.
Haitao Yu; Tarry Tweed; Mohamed Al-Hussein; and Reza Nasseri [8] told us that Lean construction has recently attracted considerable attention in the home building industry. Lengthy delivery time and
significant waste in the construction process have caused many home builders to seek a more effective production model that will increase process reliability, reduce total lead time, and improve quality. However, although housing construction provides the closest analogy to manufacturing, a high level of variability prevents the direct transplantation of lean paradigm and techniques. In collaboration with a local home builder, a systematic approach based on value stream mapping technique is developed in this research to analyze the current process and to formulate a lean production model. The model has four main features: synchronized first-in, first-out lane-based flow, production leveling at pacemaker, work restructuring, and improved operation reliability. A simulation template is built to verify the model and to
assist in the development of interim implementation models. This paper presents data collection and value stream selection, current practice analysis, and specific changes proposed for the lean production model.
20 | P a g e
is to exploit lean thinking concepts in order to manage, improve and develop the product faster while improving or atleast maintaining the level of performance and quality.
S. S. Abuthakeer, P.V. Mohanram ,G. Mohan Kumar [10] here attempts to integrate Value Stream Map (VSM) with the cost aspects. A value stream map provides a blueprint for implementing lean manufacturing concepts by illustrating information and materials flow in a value stream. The objective of
the present work is to integrate the various cost aspects. The idea is to introduce a cost line, which enhances the clarity in decision making. The redesigned map proves to be effective in highlighting the improvement areas, in terms of quantitative data. TAKT time calculation is carried out to set the pace of
production. Target cost is set as a bench mark for product cost. The results of the study indicates that implementing VSM led to reduction in the following areas: processing lead time by 34%, processing cycle time was reduced by 35%, Inventory level by 66% and product cost from Rs 137 to Rs 125. It was found that adopting VSM in a small scale industry can make significant improvements.
V. Ramesh1*, K.V. Sreenivasa Prasad, T.R. Srinivas[11] also stressed Value Stream Mapping technique involves flowcharting the steps, activities, material flows, communications, and other process elements that are involved with a process or transformation. In this respect, Value stream mapping helps an organization to identify the non-value-adding elements in a targeted process and brings a product or a group of products that use the same resources through the main flows, from raw material to the arms of customers. In this study, a practical study carried out in a manufacturing industry for the manufacture of Machining center is discussed. The main aim was to draw the current state value stream mapping for the main components like Base, Column, Cross Slide, Milling Head and Table. Further, the paper has identified some of the processes which can be carried out by the sub contractor and suggested measures to be taken up by the higher level management in reducing the non value added process. It discusses the reduction in the set up time and cycle time that can be obtained through the implementation. This paper also discusses the plan of action for improving the Future State Value Stream Mapping (FVSM). A FVSM for the manufacture of Base is drawn. It was observed that, due to enormous potential in the lean manufacturing tools, value stream mapping study was carried out in a medium scale industry for the manufacture of machining center.
21 | P a g e
lean route map for the organization to implement the lean manufacturing system. Analyses of the exploratory survey results are summarized in this paper to illustrate the implementation sequence of lean elements in volatile business environment and the finding of this review was synthesized to develop a unified theory for implementation of lean elements.
Fawaz A. Abdulmalek, Jayant Rajgopal [13] told us that the lean approach has been applied more frequently in discrete manufacturing than in the continuous/process sector, mainly because of several perceived barriers in the latter environment that have caused managers to be reluctant to make the required commitment. We describe a case where lean principles were adapted for the process sector for application at a large integrated steel mill. Value stream mapping was the main tool used to identify the opportunities for various lean techniques. We also describe a simulation model that was developed to contrast the „„before‟‟ and „„after‟‟ scenarios in detail, in
order to illustrate to managers potential benefits such as reduced production lead-time and lower work-in-process inventory.
Bhim Singh and S.K. Sharma[14], explained how value stream mapping (VSM) is helpful in lean implementation and to develop the road map to tackle improvement areas to bridge the gap between the existing state and the proposed state of a manufacturing firm. Design/methodology/approach – Through this case study, the existing stage of manufacturing is mapped with the help of VSM process symbols and the biggest improvement areas like excessive WIP, lead time, cycle time, are identified. Some modifications in current state map are suggested and with these modifications future state map is prepared. Further TAKT time is calculated to set the pace of production processes.
Petter Solding, Per Gullander [15], told us that traditionally Value Stream Mapping (VSM) is used for quick analyses of product flows through a manufacturing system, from raw material to delivery. Discrete Event Simulation (DES) is often used for analyses of complex manufacturing systems with several products and a complex planning. These two methods have similarities but also differences. This paper presents a concept for creating dynamic value stream maps of a system using simulation. Creating dynamic value stream maps makes it possible to analyze more complex systems than traditional VSMs are able to and still visualize the results in a language the Lean coordinators recognize. The value stream map is presented in an spread sheet that can be altered in the way the team wants. Some standard icons are predefined, based on traditional VSM icons. One or more products can be visualized at the same time and simulation runs and results compared immediately, helping choosing the best solution.
III. RESEARCH GAP
It was observed from CVSM that the value added time was more. By carrying out interviews with the managers, engineers and workers, it can be proposed to reduce cycle time and improve the process of manufacture. A CVSM was drawn for all the processes as it was one of the main objectives of this VSM and the reasons for increase in cycle & reduced set up time need to be identified. The suggestions are FVSM for improving the value added time by reducing the cycle time and the set up time.
22 | P a g e
Simulation can be considered an effective tool to be used for demonstration, for financial and accounting executives who are distant from the shop floor due to geographic location constraints.
IV. CONCLUSION
The developed method of Quality Value Stream Mapping is capable of systematically visualizing, analyzing and optimizing multistage manufacturing processes from a quality assurance viewpoint. The procedure model consists of four consecutive phases: preparation, quality value stream analysis, quality value stream design and implementation. The method enables the visualization of inspection processes,
quality key indicators and quality control loops within the process flow.
To develop simulation software that can be broadcast online for organizations having international locations. Simulation can be considered an effective tool to be used for demonstration, for financial and accounting executives who are distant from the shop floor due to geographic location constraints.
REFERENCES
[1]. K. Venkataraman, B.Vijaya Ramnath , V.Muthu Kumar , C.Elanchezhian ( 2014 ), “Application of Value Stream Mapping for Reduction of Cycle Time in a Machining Process”, ELSEVIER ,ScienceDirect, Procedia Materials Science 6, 1187 – 1196.
[2] Rahani AR, Muhammad al-Ashraf ( 2012 ), “Production Flow Analysis through Value Stream Mapping: A Lean Manufacturing Process Case Study”, ELSEVIER, SciVerse, ScienceDirect, Procedia Engineering 41 , 1727 – 1734.
[3] Benjamin Haefner, Alexandra Kraemer, Torsten Stauss, Gisela Lanza ( 2014 ), “Quality Value Stream Mapping” , ELSEVIER ,Science Direct, Procedia CIRP 17, 254 – 259
[4] Peter Hines Nick Rich Ann Esain, (1999),"Value stream mapping", Benchmarking: An International Journal, Vol. 6 , Iss 1, pp. 60 – 77.
[5] Stephen L. Woehrle, Louay Abou-Shady (2010) ,” Using Dynamic Value Stream Mapping And Lean Accounting Box Scores To Support Lean Implementation,” American Journal of Business Education Volume 3, Number 8 .
[6] Ulf K.Teichgräber, Maximili and eBucourt (2011) , “Applying value stream mapping techniques to eliminate non-value-added waste for the procurement of endovascular stents”, ELSEVIER European Journal of Radiology, No. of Pages6.
[7] Clifford S. Barber and Brian C. Tietje (2008), “A RESEARCH AGENDA FOR VALUE STREAM MAPPING THE SALES PROCESS”, Journal of Personal Selling & Sales Management, vol. XXVIII, no. 2 , pp. 155–165.
23 | P a g e
lead-time of a product development process”, ELSEVIER, Int. J. Production Economics,
[10] S. S. Abuthakeer, P.V. Mohanram ,G. Mohan Kumar ( 2010) , “Activity Based Costing Value Stream Mapping”, International Journal of Lean Thinking ,Volume 1, Issue 2.
[11] V. Ramesh1*, K.V. Sreenivasa Prasad2, T.R. Srinivas3, (2008), “Implementation of a Lean Model for Carrying out Value Stream Mapping in a Manufacturing Industry”, Journal of Industrial and Systems Engineering ,Vol. 2, No. 3, pp 180-196,
[12] R.Sundar, A.N.Balaji, R.M.SatheeshKumar, (2014), “A Review on Lean Manufacturing Implementation Techniques” , ELSEVIER , Science Direct, Procedia Engineering 97 , pp= 1875 – 1885
[13] Fawaz A. Abdulmalek, Jayant Rajgopal (2007), “Analyzing the benefits of lean manufacturing and value stream mapping via simulation: A process sector case study”, ELSEVIER, Science Direct, Int. J. Production Economics ,pp- 223–236
[14] Bhim Singh and S.K. Sharma, (2009), “Value stream mapping as a versatile tool for lean implementation: an Indian case study of a manufacturing firm”, MEASURING BUSINESS EXCELLENCE, VOL. 13 NO. 3 2009, pp. 58-68, Q Emerald Group Publishing Limited, ISSN 1368-3047
[15] Petter Solding, Per Gullander (2009), “CONCEPTS FOR SIMULATION BASED VALUE STREAM MAPPING”, Proceedings of the 2009 Winter Simulation Conference, IEEE
[16] Lixia Chen, Bo Meng (2010) , “The Application of Value Stream Mapping Based Lean Production System”, International Journal of Business and Management, Vol. 5, No. 6.
[17] Bhim Singh & Suresh K. Garg & Surrender K. Sharma, Value stream mapping: literature review and implications for Indian industry ,Springer-Verlag London Limited 2010, Int J Adv Manuf Technology
[18] Palak P. Sheth , Vivek A. Deshpande , Hiren R. Kardani (2014), “VALUE STREAM MAPPING: A CASE STUDY OF AUTOMOTIVE INDUSTRY”, International Journal of Research in Engineering and Technology ISSN: 2319-1163, Volume: 03 Issue: 01.
[19] RHONDA R. LUMMUS, ROBERT J. VOKURKA & BRAD RODEGHIERO (2006) , “Improving Quality through Value Stream Mapping: A Case Study of a Physician‟s Clinic”, Total Quality
Management, Vol. 17, No. 8, 1063–1075 .
[20] Benjamin Haefner , Alexandra Kraemer, Torsten Stauss, Gisela Lanza ( 2014 ), “Quality Value Stream Mapping” , ELSEVIER, ScienceDirect, Procedia CIRP 17 , pp 254 – 259.
[21] Ana Julia Dal Forno & Fernando Augusto Pereira & Fernando Antonio Forcellini & Liane M. Kipper (2014), “Value Stream Mapping: a study about the problems and challenges found in the literature from
the past 15 years about application of Lean tools”, 10 February 2014, Int J Adv Manuf Technology,
Springer-Verlag .
[22] Noor Azlina Mohd.Salleh, Salmiah Kasolang, Ahmed Jaffar(2012) , “Simulation of Integrated Total Quality Management (TQM) with Lean Manufacturing (LM) Practices in Forming Process Using Delmia Quest”, ELSEVIER, ScienceDirect, Procedia Engineering 41, pp 1702 – 1707.
24 | P a g e
[24] J.M.Worley , T.L.Doolen , (2006),”The Role of Communication and Management support in a Lean manufacturing implementation”,Management Decision , Vol. 44 No.2,pp 228-245.
[25].V. Ramesh, K.V. Sreenivasa Prasad, T.R. Srinivas, (2008), “Implementation of a Lean Model for Carrying out Value Stream Mapping in a Manufacturing Industry” , Journal of Industrial and Systems
Engineering,Vol. 2, No. 3, pp 180-196.
[26] Jon H. Marvel , Charles R. Standridge ,(2009), “A simulation-enhanced lean design process”, Journal of Industrial Engineering and Management , Vol. 2 , No. 1 , pp 90-113.
[27] Gülgün Kayakutlu, Sule Itır Satoglu, Bülent Durmusoglu, “WASTE DETECTION AND OPTIMISATION BY APPLYING BAYESIAN CAUSUAL MAP TECHNIQUE ON VALUE STREAM MAPS”, 19th International Conference on Production Research , pp:1-4.
[28] Hamid Tohidi, Kourosh KhedriLiraviasl, (2012), “Six Sigma Methodology and its Relationship with Lean Manufacturing System”, Advances in Environmental Biology , Vol: 6 No:2 , pp: 895-906.
[29] Mattias Hallgren, Jan Olhager , (2009), “Lean and agile manufacturing: external and internal drivers and performance outcomes”, International Journal of Operations & Production Management , Vol.: 29 , No.:10, PP: 976-999 .
[30] Jostein Pettersen , (2009) , “Defining lean production: some conceptual and practical issues” , The TQM Journal , Vol. 21 , No. 2, pp. 127-142 .
[31] Ibon Serrano Lasa , Carlos Ochoa Laburu , Rodolfo de Castro Vila , (2008) , “An evaluation of the value stream mapping tool” , Business Process Management Journal , Vol. 14 , No. 1, pp. 39-52 .
[32] William M. Goriwondo, Samson Mhlanga, Alphonce Marecha,(2011), ”USE OF THE VALUE STREAM MAPPING TOOL FOR WASTE REDUCTION IN MANUFACTURING. CASE STUDY FOR BREAD MANUFACTURING IN ZIMBABWE”, Proceedings of the 2011 International
Conference on Industrial Engineering and Operations Management Kuala Lumpur, Malaysia,pp:236-241. [33] Hande ALACA, Dr. Cemil CEYLAN,(2011), “Value Chain Analysis using Value Stream Mapping: White Good Industry Application” , Proceedings of the 2011 International Conference on Industrial
Engineering and Operations Management Kuala Lumpur, Malaysia, January 22 – 24, 2011,pp:993-998 . [34] Roger W. Schmenner , Mohan V. Tatikonda , (2005) , “Manufacturing process flexibility Revisited” ,
International Journal of Operations & Production Management , Vol. 25 , No. 12, pp. 1183-1189.
[35] Petter Solding, Per Gullander, (2009) , “ CONCEPTS FOR SIMULATION BASED VALUE STREAM MAPPING”,IEEE, Vol. 09 , pp. 2231-2237.
[36] R.M. Belokar, Vikas Kumar, (2012),” An Application of Value Stream Mapping In Automotive Industry: A Case Study”, International Journal of Innovative Technology and Exploring Engineering
(IJITEE),Vol.1 , Issue 2 , pp: 152-157.
[37] Yang-Hua Lian, Hendrik Van Landeghem ,(2002) ,”an application of simulation and value stream mapping in lean manufacturing”,Proceedings 14th European Simulation Symposium A. Verbraeck, W.
Krug, eds. (c) SCS Europe BVBA, pp.1-8.
25 | P a g e
Organization Development Journal, Vol. 25 ,No. 8, pp. 622-645.
[40] Brandon Lee, (2001) , “VALUE STREAM MAPPING” , IE 780S – Lean Manufacturing , paper 1 , pp. 1-5.
[41] Renu Yadav, Ashish Shastri, Mithlesh Rathore , (2012) , “Increasing Productivity by Reducing Manufacturing Lead Time through Value Stream Mapping” , International Journal of Mechanical and Industrial Engineering (IJMIE), Volume-1, Issue-3, pp. 31-35.
[42] Jostein Pettersen, (2009),"Defining lean production: some conceptual and practical issues", The TQM Journal, Vol. 21 Iss: 2 pp.127 – 142.
[43] Peter Hines, Nick Rich, (1997),"The seven value stream mapping tools", International Journal of Operations & Production Management, Vol. 17 Iss: 1 pp. 46 – 64.
[44] Hugh L. McManus, Richard L. Millard,(2002),” VALUE STREAM ANALYSIS AND MAPPING FOR PRODUCT DEVELOPMENT”, Proceedings of the International Council of the Aeronautical Sciences
23rd ICAS Congress, 8-13 September, Toronto Canada, pp.1-10.
[45] Gurav R.D and Dolas D.R., (2013), “Value Stream Mapping” International Journal of Industrial Engineering Research And Development (IJIERD) , Volume 4, Issue 1, pp. 25-33.
[46] Yang-Hua LIAN and Hendrik VAN LANDEGHEM ,(2006), “Analyzing the Effects of Lean Manufacturing using a Value Stream Mapping based simulation generator”, International Journal of Production Research
[47] Mohamed A. Shararah, Khaled S. El-Kilany, and Aziz E. El-Sayed,(2011),”Value Stream Map Simulator Using ExtendSim”, Proceedings of the World Congress on Engineering, Vol I, July 6 - 8, London, U.K.,
pp 1-4
[48] Roberto J. Arbulu and Iris D. Tommelein (2002), “VALUE STREAM ANALYSIS OF CONSTRUCTION SUPPLY CHAINS: CASE STUDY ON PIPE SUPPORTS USED IN POWER PLANTS”, Proceedings IGLC-10, Gramado, Brazil.
[49] De Toni, S. Tonchia, (1996),"Lean organization, management by process and performance measurement", International Journal of Operations & Production Management, Vol. 16 Iss: 2 pp. 221 – 236.
[50] 38.Holweg, M. (2007), “The genealogy of lean production”, Journal of Operations Management, Vol. 25 ,