Cite as: Can Urol Assoc J 2013;7:E93-E97. http://dx.doi.org/10.5489/cuaj.270. Epub 2012 January 24.
Abstract
Introduction: Preoperative Gleason score is crucial, in combination with other preoperative parameters, in selecting the appropriate treatment for patients with clinically localized prostate cancer. The aim of the present study is to determine the clinical and pathologi-cal variables that can predict differences in Gleason score between biopsy and radical prostatectomy.
Methods: We retrospectively analyzed the medical records of 302 patients who had a radical prostatectomy between January 2005 and September 2010. The association between grade changes and preoperative Gleason score, age, prostate volume, prostate-specific antigen (PSA), PSA density, number of biopsy cores, presence of prostatitis and high-grade prostatic intraepithelial neoplasia was analyzed. We also conducted a secondary analysis of the factors that influence upgrading in patients with preoperative Gleason score ≤6 (group 1) and downgrading in patients with Gleason score ≤7 (group 2).
Results: No difference in Gleason score was noted in 44.3% of patients, while a downgrade was noted in 13.7% and upgrade in 42.1%. About 2/3 of patients with a Gleason score of ≤6 upgraded after radical prostatectomy. PSA density (p = 0.008) and prostate volume (p = 0.032) were significantly correlated with upgrade. No significant predictors were found for patients with Gleason score ≤7 who downgraded postoperatively.
Conclusion: Smaller prostate volume and higher values of PSA density are predictors for upgrade in patients with biopsy Gleason score ≤6 and this should be considered when deferred treatment modalities are planned.
Introduction
Prostate cancer is the most common form of cancer and the second leading cause of cancer death among men.1 In
2010, there was an incidence of slightly less than 217 000
new cases and mortality of 32 000 in the United States.1
Gleason grading system is widely accepted to evaluate prostate adenocarcinoma grade.2 Biopsy Gleason score (GS),
obtained by the histological examination of cores received during transrectal ultrasound, is an independent prognostic factor for progression.3 Gleason score is highly considered
when we make decisions about the appropriate treatment selection or about the application of surgical modifications of the standard radical prostatectomy (RP) technique (lymph node and/or nerve sparing). It is also greatly correlated with the postoperative stage and the presence of adverse pathol-ogy.4,5 Since GS is highly associated with aggressiveness and
progression of prostate cancer, its accurate determination is crucial in deciding the best treatment (active surveillance, watchful waiting, radical therapy, hormone therapy) for each patient.6,7
Several investigators have studied the correlation between biopsy GS and GS obtained after RP by the pathological examination of the specimen. Interestingly, a very low posi-tive correlation has been reported (some studies achieve 25% positive correlation).8-10
The aim of this study was to assess the impact of preop-erative clinical and pathological variables in the prediction of tumour grade changes between biopsy and RP in patients with prostate cancer. When prostatectomy specimen GS was found to be greater than biopsy GS it was defined as upgrade, whereas downgrade was defined as the converse.
Methods
We retrospectively reviewed the medical records of 302 patients with clinically localized prostate cancer. A retro-pubic RP was performed in all patients between January 2005 and September 2010. Preoperative therapy for pros-tate cancer (active surveillance, hormone therapy, radiation therapy) was an exclusion criterion, as PSA and GS needed to be clear of any influences. Patients with incomplete medi-cal records were also excluded. Patients who had
previ-Stavros Sfoungaristos, MD; Petros Perimenis, MD
Patras University Hospital, Urology Department, Patras, Greece
ously been operated on for benign prostate hypertrophy and patients who were diagnosed with prostate cancer after a transurethral prostate resection (stage T1a and T1b) were also excluded due to alterations in the prostate volume and PSA density calculation.
The analysis comprised preoperative first and second GS and Gleason summary, age, preoperative value of PSA, pros-tate volume, preoperative PSA density, number of biopsy cores, presence of prostate inflammation and high-grade prostatic intraepithelial neoplasia (HGPIN) in biopsy mate-rial and postoperative tumour grade. The study design had two objectives. The first one was to analyze the association of the aforementioned factors before upgrading or down-grading after RP. The second objective was to study the correlation of the same factors with an upgrade in patients with a preoperative GS ≤6 (group 1) or with a downgrade in patients with GS ≥7 (group 2).
Preoperative PSA was measured before digital rectal exam-ination, transrectal ultrasound or biopsy. Prostate cancer diag-nosis was based upon transrectal ultrasound biopsy results.
An open retropubic or laparoscopic extraperitoneal RP was performed in all patients by 4 experienced surgeons. A histological report concerning the prostate dimensions and tumour grade was obtained. The prostate volume was cal-culated according to the information of the maximum trans-verse diameter (D1), the maximum anteroposterior diameter (D2) and the maximum longitudinal diameter (D3) and by using the formula D1×D2×D3×π/6 based on the prostate ellipse dimension theory. The PSA density was calculated by dividing the preoperative PSA value and prostate volume.
Statistical analyses were performed by using SPSS ver-sion 16 (SPSS Inc, Chicago, IL). The descriptive statistics are presented as the mean ± standard deviation (SD) and interquartile range (IQR) for normally distributed variables and as the absolute and percent frequency for categorical variables.
The normality condition of the numerical variables was studied by means of the Kolmogorov-Smirnov test. None of them had normal distribution, except for the age vari-able in group 2. For this reason, the Mann-Whitney U test and Kruskal Wallis H test were used to compare means between numerical groups. Student’s t-test was used to com-pare means between the ages of patients in group 2. The Chi-square χ2 test was used for categorical variables. A mul-tivariate analysis was performed for the clinical and patho-logical variables studying the potential impact in prediction of upgrade and downgrade in group 1 and 2, respectively, by using logistic regression. By using receiver operating curve (ROC curve), the area under the curve (AUC) for the quantitative variables designed and the optimal cut-off value were estimated for variables with predictive significance in GS changes. All tests were 2-tailed with a p value of <0.05 considered statistically significant.
Results
A total of 31 patients were excluded because of incomplete medical records (n=9), preoperative hormone deprivation therapy (n=7), preoperative surgical therapy for benign pros-tatic hypertrophy (n=12) and prostate cancer diagnosis after a transurethral resection of the prostate (n=3). Finally, a total of 271 patients were part of our analysis. Patients’ median age was 68.0 years (66.6 ± 6.3, IQR 10). Median preopera-tive PSA value was 8.5 ng/mL (10.8 ± 7.9, IQR 5.5), median PSA density was 0.22 ng/mL2 (0.31 ± 0.34, IQR 0.19) and
median prostate volume was 40.0 mL (45.4 ± 22.6, IQR 27). No differences in GS were found in 120 patients (44.3%). Tumour grade was different in 151 patients (55.7%), with 37 patients downgraded (13.7%) and 114 patients upgraded (42.1%). We tallied the preoperative clinical and pathological characteristics of patients who upgraded, downgraded or had no change in tumour grade between biopsy and RP (Table 1).
In the secondary analysis, patients were divided in 2 groups based on the preoperative GS. The first group included patients with a biopsy GS ≤6 and the second group patients with a biopsy GS ≥7. Patients from the first group were evalu-ated for upgrading and patients from group 2 were evaluevalu-ated for downgrading. Furthermore, we evaluated the implication of several pathological and clinical characteristics in upgrad-ing or downgradupgrad-ing, in group 1 and 2, respectively.
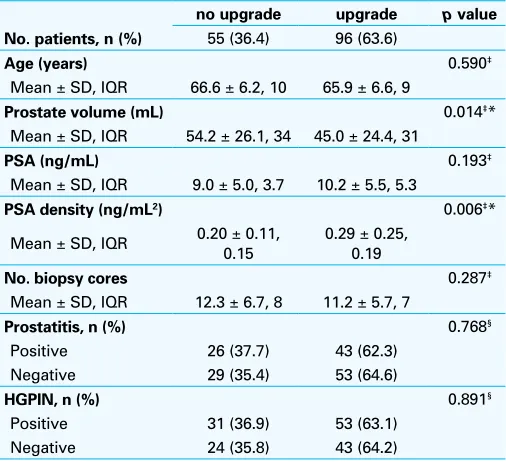
Of the 271 patients, 151 had biopsy GS ≤6 (55.7%) and 120 (44.3%) had biopsy GS >6. Among patients with a pre-operative GS ≤6, 96 (63.6%) upgraded and 55 (36.4%) did not (Table 2). From the second group, 29 patients (24.2%) had lower Gleason grade after RP, while 91 (75.8%) did not (Table 3).
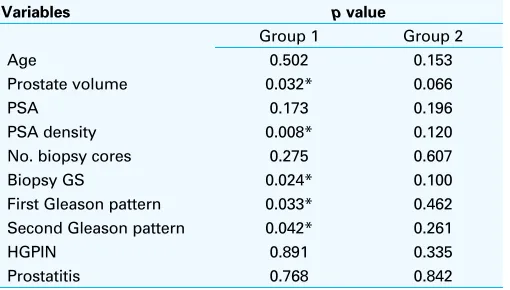
We noted the independency of the pathological and clini-cal factors to prediction upgrade and downgrade in group 1 and group 2, respectively (Table 4).
The PSA density was a statistically significant predictor for upgrade among patients with GS ≤6. Based on the ROC analysis, a cut-off value of PSA density >0.155 was associ-ated with higher incidence of upgrade. Sensitivity was 0.719 and specificity was 0.491 (AUC:0.635, p = 0.006, 95% con-fidence interval [CI]: 0.545-0.725). Similarly, prostate vol-ume <34.5 mL engendered an increased risk for upgrade. Sensitivity was 0.782 and specificity was 0.604 (AUC:0.620,
p = 0.015, 95% CI: 0.527-0.712). The analysis of group 2
patients revealed no significant predictors for downgrade.
Discussion
Preoperative clinical stage, PSA and GS are cornerstones for treatment decisions in patients with localized prostate cancer and a life expectancy of more than 10 years.6 Gleason score is
for progression.7,11 Furthermore, these patients have a greater
risk for biochemical (PSA) recurrence after radical therapies and lower cancer-free survival. Therefore, treatment modal-ities in these patients should be more aggressive. Patients with upgraded tumours are at an even higher risk of adverse pathologic features after RP.12 Thus, aggressive nature and
poor prognosis are related to high-grade and upgraded PCa. The incidence of insignificant (small, localized, well-dif-ferentiated) prostate cancer has increased in recent years due to PSA screening, while the disease mortality has decreased. Based on the above, overtreatment should be avoided in patients who could benefit from conservative treatment protocols, such as deferred treatment (watchful waiting, active surveillance). Clinical stage ≤T2a, PSA <10 ng/mL and biopsy GS ≤6 are the baseline standards for starting these treatment protocols. However, a more aggressive treat-ment should be selected in patients with GS ≥7 because of the potential for advanced disease and rapid progres-sion.6 Therefore, accurate grading is essential in deciding
the appropriate treatment.7
The discordance in GS between biopsy and RP has been retrieved by several recent studies. It has been reported that the difference between the preoperative and postoperative GS ranges from 28% to 58%, as confirmed by a large data review.13 In our study, this difference was 55.7%. High rates
of discordance are especially important for patients who are considered for not-definitive treatment. For this reason, the assessment of pathological and clinical features of prostate cancer that might predict GS upgrade is crucial. Furthermore, the evaluation of prognostic factors that may be associated with tumour downgrade would anticipate overtreatment in some patients with insignificant prostate cancer.
The association of high preoperative PSA levels and upgrade is controversial. Some studies have found that high PSA levels are associated with a poor correlation between biopsy and RP GS.14,15 The same results were noted when
patients had biopsy GS ≤7 or ≤6.7,16 In contrast, no
correla-tion was found in two recent studies.17,18 Based on the results
of our analysis, preoperative PSA values had no statistically significance in predicting changes in tumour grade.
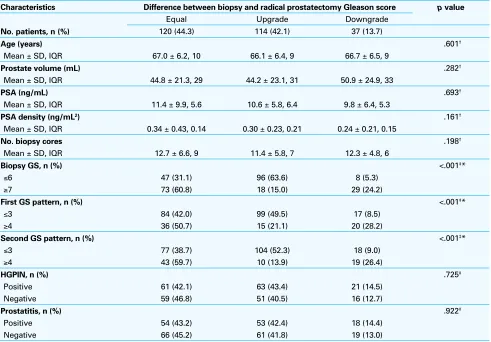
Table 1. Correlation of patients’ characteristics and changes between preoperative and postoperative Gleason score
Characteristics Difference between biopsy and radical prostatectomy Gleason score p value
Equal Upgrade Downgrade
No. patients, n (%) 120 (44.3) 114 (42.1) 37 (13.7)
Age (years) .601†
Mean ± SD, IQR 67.0 ± 6.2, 10 66.1 ± 6.4, 9 66.7 ± 6.5, 9
Prostate volume (mL) .282†
Mean ± SD, IQR 44.8 ± 21.3, 29 44.2 ± 23.1, 31 50.9 ± 24.9, 33
PSA (ng/mL) .693†
Mean ± SD, IQR 11.4 ± 9.9, 5.6 10.6 ± 5.8, 6.4 9.8 ± 6.4, 5.3
PSA density (ng/mL2) .161†
Mean ± SD, IQR 0.34 ± 0.43, 0.14 0.30 ± 0.23, 0.21 0.24 ± 0.21, 0.15
No. biopsy cores .198†
Mean ± SD, IQR 12.7 ± 6.6, 9 11.4 ± 5.8, 7 12.3 ± 4.8, 6
Biopsy GS, n (%) <.001‡*
≤6 47 (31.1) 96 (63.6) 8 (5.3)
≥7 73 (60.8) 18 (15.0) 29 (24.2)
First GS pattern, n (%) <.001‡*
≤3 84 (42.0) 99 (49.5) 17 (8.5)
≥4 36 (50.7) 15 (21.1) 20 (28.2)
Second GS pattern, n (%) <.001‡*
≤3 77 (38.7) 104 (52.3) 18 (9.0)
≥4 43 (59.7) 10 (13.9) 19 (26.4)
HGPIN, n (%) .725‡
Positive 61 (42.1) 63 (43.4) 21 (14.5)
Negative 59 (46.8) 51 (40.5) 16 (12.7)
Prostatitis, n (%) .922‡
Positive 54 (43.2) 53 (42.4) 18 (14.4)
Negative 66 (45.2) 61 (41.8) 19 (13.0)
The association between smaller prostate volume and upgrading of the GS has been reported.7,16,17,19 It was found
that prostate volume of ≤20 mL have a higher risk for upgrade than prostate volume of >60 mL.20 On the other
hand, no correlation was found in another study when one or more histopathologic grades on needle biopsy and subse-quent RP specimens were compared with prostate volume.15
In our analysis, prostate volume was a significant predic-tor of upgrade in the group of patients with biopsy GS ≤6 (p = 0.032). This notification is of high importance, since the incidence of upgrade in this category of patients was as high as 63.58%. If we consider the fact that these patients with biopsy GS ≤6 are potential candidates for conservative treat-ment modalities, like watchful waiting or active surveillance, the significance of this observation is even higher because grade underestimation might lead to inappropriate therapy.
Several studies have questioned whether saturation biop-sy is more accurate than conventional biopbiop-sy in tumour grade estimation. There is a wide agreement in the literature that obtaining an increased number of cores is associated with tumour grade prediction.17,21 Although the appropriate
number of cores that should be obtained during a prostate biopsy has not clarified, most studies contend that 10 or more biopsy cores increase the likelihood of correct GS prediction.19,22-24 However, this was not the case in our study.
No association was found between the number of cores and tumour grade prediction.
A number of factors, such as patient’s age and the pres-ence of HGPIN or inflammation, have been studied as
potential predictors of GS changes.7,14,17,19 In our study, none
of them were correlated with upgrade or downgrade. PSA density has been used to diagnose prostate cancer and it correlates with its aggressiveness. To our knowledge, the positive impact of PSA density to predict GS changes has been reported only in one study.15 Our analysis showed
that higher PSA density values are highly associated with upgrade in patients with a preoperative GS ≤6 (p = 0.008). This observation is limited by its postoperative PSA density calculation, even though there is a great positive correlation between preoperative (during transrectal ultrasound) and postoperative calculation of prostate volume.25
Conclusions
The overall accuracy of biopsy GS in predicting actual dis-ease grade is severely restricted. PSA, patient’s age, number of biopsy cores, the presence of HGPIN and prostatitis are not correlated with grade changes between biopsy and RP. On the other hand, PSA density >0.155 ng/mL2 and prostate
volume <34.5 mL was significantly associated with upgrade in patients with preoperative GS ≤6. This observation may assist in the appropriate treatment selection for patients with prostate cancer.
Competing interests: None declared.
Table 2. Characteristics of patients with biopsy Gleason
score≤6 regarding upgrade after radical prostatectomy
no upgrade upgrade p value
No. patients, n (%) 55 (36.4) 96 (63.6)
Age (years) 0.590‡
Mean ± SD, IQR 66.6 ± 6.2, 10 65.9 ± 6.6, 9
Prostate volume (mL) 0.014‡* Mean ± SD, IQR 54.2 ± 26.1, 34 45.0 ± 24.4, 31
No. biopsy cores 0.287‡
Mean ± SD, IQR 12.3 ± 6.7, 8 11.2 ± 5.7, 7
Prostatitis, n (%) 0.768§
Positive 26 (37.7) 43 (62.3)
Negative 29 (35.4) 53 (64.6)
HGPIN, n (%) 0.891§
Positive 31 (36.9) 53 (63.1)
Negative 24 (35.8) 43 (64.2)
*statistical significance; †Student’s t test; ‡Mann-Whitney U test; §Chi-square χ2 test; SD: standard deviation; IQR: interquartile range; GS: Gleason score; HGPIN: high-grade prostatic intraepithelial neoplasia; PSA: prostate-specific antigen.
Table 3. Characteristics of patients with biopsy Gleason
score ≤7 regarding downgrade after radical prostatectomy
No
downgrade Downgrade p value No. patients, n (%) 91 (75.8) 29 (24.2)
Age (years) 0.191†
Mean ± SD, IQR 67.5 ± 5.8, 8 65.7 ± 6.7, 11
Prostate volume (mL) 0.119‡
Mean ± SD, IQR 39.9 ± 16.5, 23 46.9 ± 21.6, 27
PSA (ng/mL) 0.108‡
Mean ± SD, IQR 12.9 ± 10.9, 8.3 10.1 ± 7.1, 5.8
PSA density (ng/mL2) 0.033‡*
Mean ± SD, IQR 0.41 ± 0.48, 0.24
0.26 ± 0.23, 0.18
No. biopsy cores 0.865‡
Mean ± SD, IQR 12.8 ± 6.5, 8 12.2 ± 3.9, 4
Prostatitis, n (%) 0.842§
Positive 42 (75.0) 14 (25.0)
Negative 49 (76.6) 15 (23.4)
HGPIN, n (%) 0.335§
Positive 44 (72.1) 17 (27.9)
Negative 47 (79.7) 12 (20.3)
This paper has been peer-reviewed.
References
1. Jemal A, Siegel R, Xu J, et al. Cancer statistics 2010. CA Cancer J Clin 2010;60:277-300. http:// dx.doi.org/10.3322/caac.20073
2. Gleason DF, Mellinger GT. Prediction of prognosis for prostatic adenocarcinoma by combined histological grading and clinical staging. J Urol 1974;111:58-64.
3. Hull GW, Rabbani F, Abbas F, et al. Cancer control with radical prostatectomy alone in 1,000 consecutive patients. J Urol 2002;167:528-34. http://dx.doi.org/10.1016/S0022-5347(01)69079-7 4. Rubin MA, Bismar TA, Curtis S, et al. Prostate needle biopsy reporting: how are the surgical members of
the Society of Urologic Oncology using pathology reports to guide treatment of prostate cancer patients? Am J Surg Pathol 2004;28:946-52. http://dx.doi.org/10.1097/00000478-200407000-00016 5. Makarov DV, Trock BJ, Humphreys EB, et al. Updated nomogram to predict pathologic stage of prostate
cancer given prostate-specific antigen level, clinical stage, and biopsy Gleason score (Partin tables) based on cases from 2000 to 2005. Urology 2007;69:1095-101. http://dx.doi.org/10.1016/j. urology.2007.03.042
6. Epstein JI, Partin AW, Sauvageot J, et al. Prediction of progression following radical prostatectomy. A multivariate analysis of 721 men with long-term follow-up. Am J Surg Pathol 1996;20:286-92. http:// dx.doi.org/10.1097/00000478-199603000-00004
7. Moussa AS, Li J, Soriano M, et al. Prostate biopsy clinical and pathological variables that predict significant grading changes in patients with intermediate and high grade prostate cancer. BJU Int 2009;103:43-8. http://dx.doi.org/10.1111/j.1464-410X.2008.08059.x
8. Patel AR, Jones JS. Optimal biopsy strategies for the diagnosis and staging of prostate cancer. Curr Opin Urol 2009;19:232-7. http://dx.doi.org/10.1097/MOU.0b013e328329a33e
9. Miyake H, Kurahashi T, Takenaka A, et al. Improved accuracy for predicting the Gleason score of prostate cancer by increasing the number of transrectal biopsy cores. Urol Int 2007;9:302-6. http://dx.doi. org/10.1159/000109713
10. Hong SK, Han BK, Lee ST, et al. Prediction of Gleason score upgrading in low-risk prostate cancers diagnosed via mult (> or =12)-core prostate biopsy. World J Urol 2009;27:271-6. http://dx.doi. org/10.1007/s00345-008-0343-3
11. Oesterling JE, Brendler CB, Epstein JI, et al. Correlation of clinical stage, serum prostatic acid phosphatase and preoperative Gleason grade with final pathological stage in 275 patients with clinically localized adenocarcinoma of the prostate. J Urol 1987;138:92-8.
12. Sved PD, Gomez P, Manoharan M, et al. Limitations of biopsy Gleason grade: implications for counsel-ing patients with biopsy Gleason score 6 prostate cancer. J Urol 2004;172:98-102. http://dx.doi. org/10.1097/01.ju.0000132135.18093.d6
13. King CR, Long JP. Prostate biopsy grading errors: a sampling problem? Int J Cancer 2000;90:326-30. http://dx.doi.org/10.1002/1097-0215(20001220)90:6<326::AID-IJC3>3.0.CO;2-J
14. Carlson GD, Calvanese CB, Kahane H, et al. Accuracy of biopsy Gleason scores from a large uropathology laboratory: use of a diagnostic protocol to minimize observer variability. Urology 1998;51:525-9. http:// dx.doi.org/10.1016/S0090-4295(98)00002-8
15. Kojima M, Troncoso P, Babaian RJ. Use of prostate-specific antigen and tumour volume in predicting needle biopsy grading error. Urology 1995;45:807-12. http://dx.doi.org/10.1016/S0090-4295(99)80088-0 16. Dong F, Jones JS, Stephenson AJ, et al. Prostate cancer volume at biopsy predicts clinically significant
upgrading. J Urol 2008;179:896-900. http://dx.doi.org/10.1016/j.juro.2007.10.060 17. Mian BM, Lehr DJ, Moore CK, et al. Role of prostate biopsy schemes in accurate prediction of Gleason
scores. Urology 2006;67:379-83. http://dx.doi.org/10.1016/j.urology.2005.08.018
18. Nayyar R, Singh P, Gupta NP, et al. Upgrading of Gleason score on radical prostatectomy specimen compared to the pre-operative needle core biopsy: An Indian experience. Indian J Urol 2010;26:56-9. http://dx.doi.org/10.4103/0970-1591.60445
19. Stackhouse DA, Sun L, Schroeck FR, et al. Factors predicting prostatic biopsy Gleason sum under grading. J Urol 2009;182:118-22. http://dx.doi.org/10.1016/j.juro.2009.02.127
20. Turley RS, Hamilton RJ, Terris MK, et al. Small transrectal ultrasound volume predicts clinically sig-nificant Gleason score upgrading after radical prostatectomy: results from the SEARCH database. J Urol 2008;179:523-7. http://dx.doi.org/10.1016/j.juro.2007.09.078
21. Kahl P, Wolf S, Adam A, et al. Saturation biopsy improves preoperative Gleason scoring of prostate cancer. Pathol Res Pract 2009;205:259-64. http://dx.doi.org/10.1016/j.prp.2008.10.010
22. Divrik RT, Eroglu A, Sahin A, et al. Increasing the number of biopsies increases the concordance of Gleason scores of needle biopsies and prostatectomy specimens. Urol Oncol 2007;25:376-82. http://dx.doi. org/10.1016/j.urolonc.2006.08.028
23. King CR, McNeal JE, Gill H, et al. Extended prostate biopsy scheme improves reliability of Gleason grading: implications for radiotherapy patients. Int J Radiat Oncol Biol Phys 2004;59:386-91. http://dx.doi. org/10.1016/j.ijrobp.2003.10.014
24. San Francisco IF, DeWolf WC, Rosen, et al. Extended prostate needle biopsy improves concordance of Gleason grading between prostate needle biopsy and radical prostatectomy. J Urol 2003;169:136-40. http://dx.doi.org/10.1016/S0022-5347(05)64053-0
25. Wolff JM, Boeckmann W, Mattelaer P, et al. Determination of prostate gland volume by transrectal ultrasound: correlation with radical prostatectomy specimens. Eur Urol 1995;28:10-2.
Correspondence: Dr. Stavros Sfoungaristos, Patras University Hospital, Urology Department, Building A, 4th floor, Rion, Patras, 26500 Greece; fax: +302610993981; [email protected]
Table 4. Multivariate analysis of predictive factors for upgrade in patients with biopsy Gleason score ≤6 (Group 1)
and downgrade in patients with Gleason score ≤7 (Group 2)
Variables p value
Group 1 Group 2
Age 0.502 0.153
Prostate volume 0.032* 0.066
PSA 0.173 0.196
PSA density 0.008* 0.120
No. biopsy cores 0.275 0.607
Biopsy GS 0.024* 0.100
First Gleason pattern 0.033* 0.462
Second Gleason pattern 0.042* 0.261
HGPIN 0.891 0.335
Prostatitis 0.768 0.842