Thailand low and equatorial
F
2-layer peak electron density and comparison
with IRI-2007 model
N. Wichaipanich1, P. Supnithi1, T. Tsugawa2, and T. Maruyama2
1Faculty of Engineering, King Mongkut’s Institute of Technology Ladkrabang, Ladkrabang, Bangkok 10520, Thailand 2Space Environment Group, National Institute of Information and Communications Technology,
Nukui-kita, 4-2-1, Koganei, Tokyo 183-8795, Japan
(Received June 10, 2010; Revised January 14, 2011; Accepted January 25, 2011; Online published July 27, 2012)
Ionosonde measurements obtained at two Thailand ionospheric stations, namely Chumphon (10.72◦N, 99.37◦E, dip 3.0◦N) and Chiang Mai (18.76◦N, 98.93◦E, dip 12.7◦N) are used to examine the variation of the
F2-layer peak electron density (NmF2) which is derived from theF2-layer critical frequency, foF2. Measured
data from September 2004 to August 2005 (a period of low solar activity) are analyzed based on the diurnal and seasonal variation and then compared with IRI-2007 model predictions. Our results show that, in general, the diurnal and seasonal variations of theNmF2predicted by the IRI (URSI and CCIR options) model show a
feature generally similar to the observedNmF2. Underestimation mostly occurs in all seasons except during the
September equinox and the December solstice at Chumphon, and the September equinox and the March equinox at Chiang Mai, when they overestimate those measured. The best agreement between observation and prediction occurs during the pre-sunrise to post-sunrise hours. The best agreement of the %PD values of both the options occurs during the March equinox, while the agreement is the worst during the September equinox. TheNmF2
values predicted by the CCIR option show a smaller range of deviation than theNmF2 values predicted by the
URSI option. During post-sunset to morning hours (around 21:00–09:00 LT), the observedNmF2 at both
sta-tions are almost identical for the periods of low solar activity. However, during daytime, the observedNmF2 at
Chumphon is lower than that at Chiang Mai. The difference between these two stations can be explained by the equatorial ionospheric anomaly (EIA). These results are important for future improvements of the IRI model for
NmF2over Southeast Asia, especially for the areas covered by Chumphon and Chiang Mai stations.
Key words:Equatorial latitude, ionosonde, ionogram, IRI model,NmF2, solar activity.
1.
Introduction
The ionosonde is one of the most widely-used instru-ments for studying ionospheric variability, which is im-portant for a better understanding of the ionosphere and the design of HF, VHF and UHF communication systems. The F2-layer peak electron density (NmF2) is an
impor-tant parameter which is derived from the F2-layer critical
frequency (foF2) measured by ionosondes. This
parame-ter is used for the development and improvement of iono-spheric models, such as the International Reference Iono-sphere (IRI) (Bilitza, 2001). The IRI is a widely-used global empirical ionospheric model, which describes the electron density, electron temperature, ion temperature and ion com-position in the altitude range of approximately 50 to 1,500 kilometers, for a given location, time and sunspot number. Many improvements have been made to this model (IRI-80, IRI-90, IRI-95, IRI-2000 and IRI-2001). The most recent update was released in 2007, known as IRI-2007 (Bilitza and Reinisch, 2008). The most important changes in IRI-2007 are: (1) two new options for the topside electron den-sity, (2) a new model for the topside ion composition, (3)
Copyright cThe Society of Geomagnetism and Earth, Planetary and Space Sci-ences (SGEPSS); The Seismological Society of Japan; The Volcanological Society of Japan; The Geodetic Society of Japan; The Japanese Society for Planetary Sci-ences; TERRAPUB.
doi:10.5047/eps.2011.01.011
the first-time inclusions of a model for the spreadF occur-rence probability, (4) a Neural Net model for the auroral
D-region electron densities, (5) a model for the plasmas-phere electron temperature and (6) the latest International Geomagnetic Reference Field (IGRF) model for the com-putation of magnetic coordinates, including their changes due to the secular variation of the magnetic field. The IRI model has two options for the prediction of theNmF2: one
is the model developed by the International Radio Consulta-tive Committee, namely CCIR (CCIR, 1966) and the other is the model developed by the International Union of Ra-dio Science, namely URSI (Rushet al., 1989). The CCIR options are based on monthly median values obtained by a worldwide network of ionosondes (about 150 stations). The URSI options are based on both ionosonde data (about 180 stations) and the values obtained by aeronomic theory for filling the data gaps above the oceans and in the southern hemisphere.
The observed ionospheric data in many parts of the world have been analyzed by investigating the diurnal and sea-sonal variations, and then compared with the IRI model. In Africa, the variations of the F2 peak parameters
ob-tained by the ionosonde at Ouagadougou (12.4◦N, 1.5◦W, dip 5.9◦N), Burkina Faso and Korhogo (9.3◦N, 5.4◦W, dip 0.67◦S), Cote-d’Ivoire, were compared with IRI model pre-dictions (Adeniyiet al., 2003; Obrouet al., 2003; Bilitzaet
Fig. 1. Locations of the five ionosonde stations in the SEALION project-project{Phu Thuy (PHT), Chiang Mai (CMU), Chumphon (CPN), Bac Lieu (BCL), Koto Tabang (KTB)}.
al., 2004). In South America, a comparison was made be-tween the results from the IRI model and the ionospheric data collected by digisondes located at Sao Luis (2.6◦S, 44.2◦W, dip 0.5◦S), Cachoeira Paulista (22.5◦S, 45◦W, dip 28◦S), Palmas (10.7◦S, 45.20◦W, dip 10.8◦S), Sao Jose dos Campos (23.20◦S, 45.86◦W, dip 38.41◦S), Brazil, and Ji-camarca (12.0◦S, 76.9◦W, dip 1.0◦N), Peru, and the data measured by the ionosonde at Tucuman (26.9◦S, 294.6◦E), Argentina (Batista and Abdu, 2004; Bertoniet al., 2006; Lee and Reinisch, 2006; Lee et al., 2008; Ezquer et al., 2008). In Europe, Ratovsky et al. (2009) com-pared the observed ionospheric data with the IRI model at Irkutsk (52.3◦N, 104.3◦E), Russia. In Asia, Zhang et al.
(2007), Sethiet al.(2007), Chuo and Lee (2008), Ayubet al. (2009), Wichaipanich et al. (2010) compared the IRI model results with experimental data at Hainan (19.4◦N, 109.0◦E, dip 22.8◦N), China, New Delhi (28.6◦N, 77.2◦E, dip 42.4◦N), India, Chung-Li (24.9◦N, 121.1◦E, dip 35◦N), Taiwan, Karachi (24.95◦N, 67.14◦E), Islamabad (33.75◦N, 72.87◦E), Pakistan, and Chumphon (10.72◦N, 99.37◦E, dip 3.0◦N), Thailand, respectively. Although studies of the ob-served ionospheric data are common in many parts of the world, only a few studies of ionospheric conditions have been carried out for the region over Southeast Asia.
Since 2003, two frequency modulate-continuous waves (FM/CW) ionosondes have been installed at two stations in Thailand, one is close to the magnetic equator, namely Chumphon (CPN) and the other is close to the northern crest of the Equatorial Ionization Anomaly (EIA), namely Chiang Mai (CMU). Both stations are two of the 5
(COPEX) in South East Asia. The COPEX includes the northern and southern hemispheres and around the mag-netic equator. In this paper, we take F2-layer peak
elec-tron density (NmF2) data derived from the F2-layer
criti-cal frequency (foF2), which is manually scaled from
bot-tomside ionograms recorded by the FM/CW ionosonde at Chumphon and Chiang Mai, and compare these data with the IRI-2007 model. This is a continuation of a previ-ous study (Wichaipanichet al., 2010) onF2-layer peak
pa-rameters measured by a FM/CW ionosonde at Chumphon province, Thailand, and a comparison with the IRI-2001 model.
2.
Data and Methodology
The data used in this study are collected by two FM/CW ionosonde (Maruyamaet al., 2007) stations at Chumphon campus of King Mongkut’s Institute of Technology Lad-krabang, Chumphon province (10.72◦N, 99.37◦E, dip an-gle: 3.0◦N), denoted by CPN, and Chiang Mai Univer-sity, Chiang Mai province (18.76◦N, 98.93◦E, dip angle: 12.7◦N), denoted by CMU, Thailand. The CPN station is near the magnetic equator while the CMU station is near the northern crest of the Equatorial Anomaly. The FM/CW ionosonde is a type of transceiver that continuously trans-mits a radio frequency signal in the range of 2–30 MHz into the ionosphere and receives an echo. The echo returns to the receiver and is collected as a photographic display, called an ionogram. The ionogram is used to infer the structure of theE andF-layers which illustrate virtual height (h) ver-sus frequency (f). In this work, the ionograms are every 15 minutes and manually scaled. The obtainedF2-layer critical
frequency (foF2) values are converted intoNmF2according
to (Davies, 1990), i.e.,
NmF2=1.24(foF2)2×10¹⁰, (1)
where NmF2 is in electron/m3 and foF2 is the F2-layer
critical frequency in MHz.
The monthly hourly medians and the seasonally hourly medians of NmF2 at Chumphon and Chiang Mai for four
seasons, including the September equinox (September and October in 2004), the December solstice (November, De-cember in 2004 and January and February in 2005), the March equinox (March and April in 2005), and the June solstice (May, June, July and August in 2005), have been plotted and compared with the IRI model predictions.
For the comparison between observation and the model, both the URSI and CCIR options of the IRI-2007 model are used to predict theNmF2values, which can be downloaded
m 2
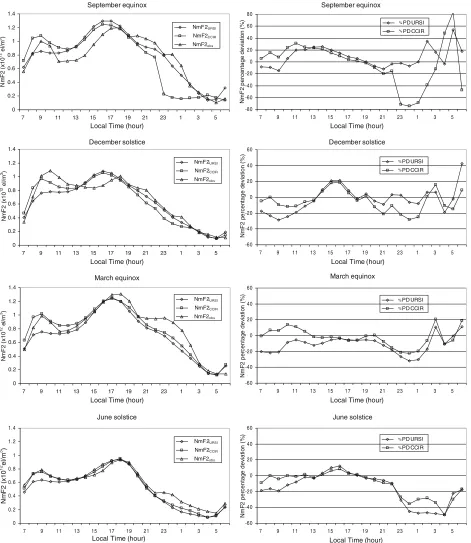
Fig. 2. The observedNmF2 and IRI-2007 model predictions (left panels) and the percentage deviation between data and model (right panels) at
Chumphon station for different seasons from September 2004 to August 2005.
In addition, theNmF2percentage deviation (PD) is
com-puted from
%PD= (NmF2IRI−NmF2obs)
NmF2obs
×100%, (2)
where NmF2IRI=NmF2URSI for the URSI option and NmF2IRI = NmF2CCIR for the CCIR option. The
parame-terNmF2obsis derived from the foF2observations obtained
from the ionosondes at Chumphon and Chiang Mai stations.
3.
Results and Discussions
3.1 Chumphon station
Figure 2 shows the diurnal variations in the NmF2
pa-rameter versus local time (LT) at Chumphon station. The left panels are the observedNmF2labeled asNmF2obs
com-pared with the predicted NmF2 values from the URSI and
CCIR options of the IRI-2007 model, labeled asNmF2URSI
and NmF2CCIR, respectively, and the right panels show
the NmF2 percentage deviation (%PD) of both options in
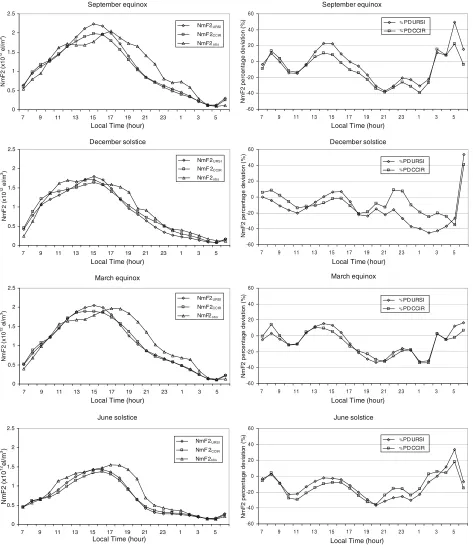
Fig. 3. The observedNmF2and IRI-2007 model predictions (left panels) and the percentage deviation between data and models (right panels) at Chiang
Mai station for different seasons.
2005. In the left panels, most the results show similar trends in the variation of NmF2, increasing during
sun-rise hours (around 06:00 LT), reaching the highest values in the pre-sunset hours (around 17:00–19:00 LT) with a noon bite-out around 11:00–13:00 LT, and decreasing ing post-sunset hours, until the lowest levels occur dur-ing pre-sunrise hours (around 05:00 LT). For the Septem-ber equinox, both NmF2URSI and NmF2CCIR overestimate NmF2obsduring the daytime hours except during the
morn-ing hours (around 06:00–09:00 LT), when NmF2URSI
un-derestimates, but NmF2CCIR overestimates, NmF2obs.
Dur-ing the post-sunset hours (around 19:00–21:00 LT), both
NmF2URSI and NmF2CCIR underestimate NmF2obs. For the
night-time, NmF2URSI predicts values close to NmF2obs,
but NmF2CCIR underestimates NmF2obs. For the
Decem-ber solstice season, both NmF2URSI and NmF2CCIR
under-estimate NmF2obs during the daytime hours except
dur-ing post-noontime to sunset hours, when they overestimate those observed. During the night-time, NmF2URSIis close
m 2
Fig. 4. Diurnal variation of hourly medians ofNmF2over all months (left panel) and the annual variation of the monthlyNmF2median values (right
panel) at Chumphon and Chiang Mai stations.
results during 20:00–01:00 LT. For the March equinox,
NmF2obs is higher than NmF2URSI during daytime, but is
lower than NmF2CCIR. For night-time, both NmF2URSIand NmF2CCIRunderestimateNmF2obs, especially during 21:00–
00:00 LT, but are close to NmF2obsduring the pre-sunrise
hours. The results for the June solstice show that the
NmF2CCIR model is close to NmF2obs, but NmF2URSI
un-derestimates NmF2obs during the daytime, except during
14:00–17:00 LT when bothNmF2URSIandNmF2CCIR
over-estimate NmF2obs. In the right panels, the results of the NmF2percentage deviation (%PD) of the CCIR options for
the four seasons show a similar feature: the %PD values vary between around±27% during daytime to pre-midnight hours, the lowest levels occur around 18:00 LT (±5%), fluc-tuations during post-midnight to pre-sunrise hours (±45%) except during the September equinox, when it reaches 80%. The results of the %PD of the CCIR option show a good agreement during daytime for all seasons when compared with the %PD of the URSI option, especially during the March equinox (±20%). The agreement between predic-tion and observapredic-tion is the worst during night-time, espe-cially for the %PD of the CCIR option during the Septem-ber equinox.
3.2 Chiang Mai station
Similarly, we compared the observed NmF2 and the IRI
model, and theNmF2percentage deviations (%PD) at
Chi-ang Mai station, which are shown in Fig. 3. In the left panel of Fig. 3, theNmF2values for the September equinox show
that both NmF2URSI and NmF2CCIR predict NmF2 values
close to NmF2obs during pre-sunrise to the morning hours
(around 03:00–09:00 LT), but they underestimateNmF2obs
during 10:00–02:00 LT, except during the hours 13:00– 15:00 LT when they overestimate NmF2obs. For the
De-cember solstice season, both NmF2URSI andNmF2CCIR
un-derestimateNmF2obsbetween the hours of 10:00–13:00 LT
and 17:00–21:00 LT. In addition,NmF2URSIunderestimates
the observed data except during 15:00–16:00 LT, when it overestimatesNmF2obs. In the March equinox season, good
predictions are provided by the URSI and CCIR options for the hours of 03:00–09:00 LT. However, bothNmF2URSIand NmF2CCIRunderestimate the observed data during the hours
of 10:00–11:00 LT and 17:00–02:00 LT, and they overes-timate during the hours of 13:00–15:00 LT. During the June solstice season, most of the results show that both
NmF2URSI and NmF2CCIR underestimate NmF2obs, except
during 02:00–08:00 LT, when they are close to NmF2obs.
In the right panels, the %PD values vary between−25 and 22% during the daytime for both the URSI and CCIR op-tions. For night-time, the results of both the options show the %PD values vary between−40 and−20% during post-sunset to post-midnight hours except during the December solstice, when the %PD values for the CCIR option vary between −20 and+10%. During pre-sunrise hours, the %PD values increase and reach the highest level of 50% especially during the December solstice, when the %PD for the URSI option reaches 50%. For all the seasons, in gen-eral, the %PD values for the CCIR option are better than the %PD values for the URSI option. The best agreement of the %PD values for both the URSI and CCIR options occurs during the March equinox.
3.3 ComparingNmF2at Chumphon and Chiang Mai
The comparison between the observed NmF2 at the
Chumphon and Chiang Mai stations are shown in Fig. 4. The left panel shows the hourly medians of all the months of NmF2 values and the right panel shows the monthly
hourly medians of NmF2 values for both stations. The
left panel shows that the observed NmF2 at both stations
are almost identical during post-sunset to morning hours (around 21:00–09:00 LT), but during the daytime, the ob-servedNmF2 at Chiang Mai appear much higher than that
at Chumphon. The right panel shows that the observed
NmF2 values at Chiang Mai station are higher than those
at Chumphon station during the equinox seasons, while a similarity is seen during the solstice seasons except during November and February. The maximum NmF2 values for
each season at both stations are tabulated in Table 1 and this shows that the difference in NmF2 values between the
stations is highest during the September equinox and low-est during the June solstice. In other words, the maximum monthlyNmF2values during the equinox seasons are higher
than that for other seasons, but they are at lower levels dur-ing the solstice seasons.
The observedNmF2at Chiang Mai are higher than that at
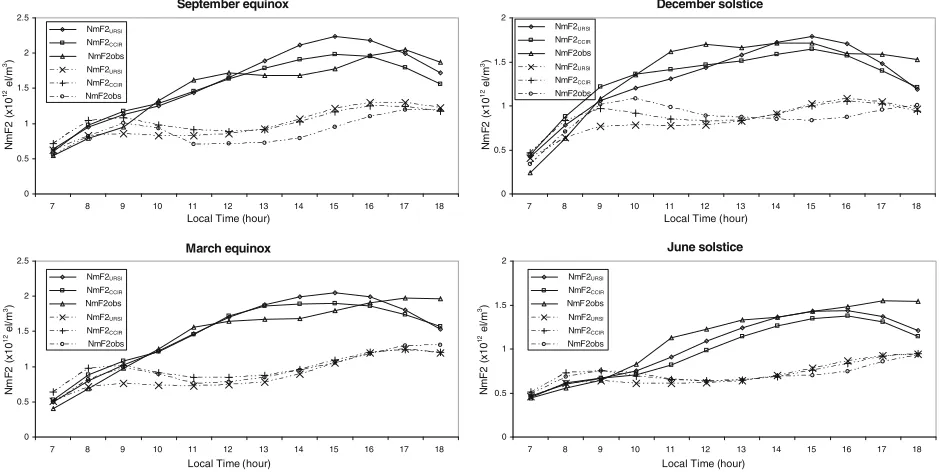
Fig. 5. The observedNmF2and IRI-2007 model predictions during the daytime hours at Chumphon and Chiang Mai stations for different seasons.
Table 1. Maximum seasonal hourly medians ofNmF2(×1012electron/m3).
Seasons Chumphon Chiang Mai Difference inNmF2between stations
September equinox 1.19 2.00 0.81
December solstice 1.07 1.71 0.64
March equinox 1.32 2.01 0.69
June solstice 0.94 1.55 0.61
Anomaly (EIA) is intensified resulting in variations in the
F-layer at equatorial and low-latitudes as follows: the F -layer is lifted up at the magnetic equator but the peak den-sity decreases, however, theF-layer peak density increases at the crest of the anomaly (located at approximately 15◦ north and south of the magnetic latitude, moderated by the meridional wind from the magnetic equator to the crests of the anomaly). While Chumphon is close to the mag-netic equator (Geomagmag-netic dip latitude+3.0◦N), Chiang Mai is located at the northern anomaly crest (Geomagnetic dip latitude+12.7◦N), causing higherNmF2median values
at Chiang Mai. The location of both stations in relation to the Equatorial Anomaly explains the differences in electron density between the two stations.
Figure 5 is the same as Fig. 2, but for Chumphon (dashed lines) and Chiang Mai (solid lines) stations during the day-time hours. Generally,NmF2obs, NmF2URSI andNmF2CCIR
at Chumphon station are lower than those at Chiang Mai station in all seasons.
When compared with previous studies for periods with low solar activity, our results are similar to the study of Ayub et al. (2009) at two Pakistan low-latitude stations, namely Karachi and Islamabad, in that the IRI model pre-dictsNmF2values close to the observedNmF2during
pre-sunrise to pre-noon (around 03:00–09:00 LT), but a dif-ference occurred during daytime, when they found that the IRI/URSI model overestimates NmF2obs, while our
re-sults show an underestimation. Furthermore, they found that the observedNmF2 values at Karachi are higher than
that at Islamabad due to the equatorial anomaly. While Karachi is located in the EIA, Islamabad is outside the anomaly, explaining the higher NmF2 median values and
bite-outs at Karachi. The maximum NmF2 values reach
a peak during the equinox seasons and a minimum level during the solstice seasons. In addition, our results differ from the study of Ezquer et al. (2008) at Tucuman, Ar-gentina, in that good predictions are provided by the URSI option for night-time and the agreement between predic-tion and measurement is worst during the June solstice in that the %PD varies between−50 and 80% during the pre-noontime hours (10:00–11:00 LT), while our results show good predictions from the CCIR option, with a disagree-ment between prediction and measuredisagree-ment occurring dur-ing the September equinox where the %PD varies between
−70 and+80% during night-time at Chumphon station and between−40 and+50% during night-time at Chiang Mai station. Furthermore, our results differ from the studies of Lee and Reinisch (2006) and Leeet al.(2008) at the equato-rial latitude station in Peru, namely Jicamarca, in that both the URSI and CCIR options of the IRI-2007 model are gen-erally close to the observed values, but our results show that both models underestimate observed values during the mid-night and pre-sunrise hours, especially in 2005. This un-derestimation is consistent with the results of Wichaipanich
et al.(2010) although, in that work, foF2 is studied from
m 2
4.
Conclusions
This paper presents the monthly hourly median values of the F2-layer peak electron density (NmF2) during
Septem-ber 2004 to August 2005, a period of low solar activity, as compared with the IRI-2007 model. A summary of all the results from Chumphon and Chiang Mai stations are as fol-lows.
1. The diurnal and seasonal variations ofNmF2predicted
by the IRI (URSI and CCIR options) model generally show the same features as the observedNmF2.
2. In most cases both the URSI and CCIR options under-estimate the observedNmF2except during the
Septem-ber equinox and the DecemSeptem-ber solstice at Chumphon, and the September equinox and the March equinox at Chiang Mai, when they overestimateNmF2obs.
3. The best agreement between observation and predic-tion occurs during pre-sunrise to post-sunrise hours (around 03:00–09:00 LT).
4. The best percentage agreement occurs during the March equinox for Chumphon and Chiang Mai sta-tions.
5. The worst %PD values are found during night-time during the September equinox for both stations with the highest value observed at Chumphon, where %PD reaches 80% for the CCIR option.
6. Although both the URSI and CCIR options of the IRI model predict NmF2 close to the NmF2obs especially
during daytime, the CCIR option produces a smaller range of deviation than the URSI option.
7. During post-sunset to morning hours (around 21:00– 09:00 LT), the observed NmF2 at both stations are
almost identical for the periods of low solar activ-ity. However, during daytime, the observedNmF2
val-ues at Chiang Mai are larger than those at Chumphon due to the higher dip angle related to the Equatorial Anomaly.
8. A bite-out phenomenon is clearly seen during noon-time hours (around 11:00 LT) at Chumphon for all sea-sons, but it rarely occurs during the equinox seasons at Chiang Mai.
Acknowledgments. In this research work, the financial support from the Telecommunications Research and Industrial Devel-opment Institute (TRIDI), National Telecommunications Com-mission (NTC) fund (Grant No. PHD/004/2552) to Mr. Noraset Wichaipanich and Assoc. Prof. Dr. Pornchai Supnithi is acknowl-edged. We would like to thank the Space Environment Group, Na-tional Institute of Information and Communications Technology (NICT), Japan, for the equipment and technical support. In addi-tion, we are grateful to the reviewers and the editor for comments and suggestions which greatly helped to improve this manuscript.
References
Adeniyi, J. O., D. Bilitza, S. M. Radicella, and A. A. Willoughby, Equato-rial F2-peak parameters in the IRI model,Adv. Space Res.,31(3), 507– 512, 2003.
Anderson, D. N., A theoretical study of the ionosphere F region equatorial anomaly. II: Results in the American and Asian sectors,Planet Space Sci.,21, 421–442, 1973.
Ayub, M., S. Iqbal, M. A. Ameen, and B. W. Reinisch, Study of maximum electron density NmF2 at Karachi and Islamabad during solar minimum (1996) and solar maximum (2000) and its comparison with IRI,Adv. Space Res.,43, 1821–1824, 2009.
Batista, I. S. and M. A. Abdu, Ionospheric variability at Brazilian low and equatorial latitude: Comparison between observations and IRI model,
Adv. Space Res.,34, 1894–1900, 2004.
Bertoni, F., Y. Sahai, P. R. Fagundes, V. G. Pillat, F. B. Guedes, and J. R. Abalde, IRI-2001 model predictions compared with ionospheric data observed at Brazilian low latitude stations,Ann. Geophys.,24, 2191– 2200, 2006.
Bilitza, D., International Reference Ionosphere 2000,Radio Sci.,36(2), 261–275, 2001.
Bilitza, D. and B. W. Reinisch, International Reference Ionosphere 2007: Improvements and new parameters,Adv. Space Res.,42, 599–609, 2008. Bilitza, D., O. K. Obrou, J. O. Adeniyi, and O. Oladipo, Variability of foF2
in the equatorial ionosphere,Adv. Space Res.,34, 1901–1906, 2004. CCIR: Comite Consultatif International des Radio communications,
Reports, 340-1 and 340-6, International Telecommunication Union, Geneva, Switzerland, 1966.
Chuo, Y. J. and C. C. Lee, Ionospheric variability at Taiwan low latitude station: Comparison between observations and IRI-2001 model,Adv. Space Res.,42, 673–681, 2008.
Davies, K., inIonospheric Radio, edited by Clarricoats, P. J. B., Y. Rahmat-Samii, and J. R. Wait, 580 pp., Peter Peregrinus Ltd., London, United Kingdom, 1990.
Ezquer, R. G., M. Mosert, L. Scida, and J. Lopez, Peak characteristics of F2 region over Tucuman: Predictions and measurements,Atmos. Terr. Phys.,70, 1525–1532, 2008.
Lee, C. C. and B. W. Reinisch, Quiet-condition hmF2, NmF2, andB0 vari-ations at Jicamarca and comparison with IRI-2001 during solar maxi-mum,Atmos. Terr. Phys.,68, 2138–2146, 2006.
Lee, C. C., B. W. Reinisch, S. Y. Su, and W. S. Chen, Quiet-time variations of F2-layer parameters at Jicamarca and comparison with IRI-2001 during solar minimum,Atmos. Terr. Phys.,70, 184–192, 2008. Maruyama, T., M. Kawamura, S. Saito, K. Nozaki, H. Kato, N.
Hem-makorn, T. Boonchuk, T. Komolmis, and C. Ha Duyen, Low latitude ionosphere-thermosphere dynamics studies with ionosonde chain in Southeast Asia,Ann. Geophys.,25, 1569–1577, 2007.
Obrou, O. K., D. Bilitza, J. O. Adeniyi, and S. M. Radicella, Equatorial F2-layer peak height and correlation with vertical ion drift and M(3000)F2,
Adv. Space Res.,31(3), 513–520, 2003.
Ratovsky, K. G., A. V. Oinats, and A. V. Medvedev, Diurnal and seasonal variations of F2 layer characteristics over Irkutsk during the decrease in solar activity in 2003–2006: Observations and IRI-2001 model predic-tions,Adv. Space Res.,43, 1806–1811, 2009.
Rush, C., M. Fox, D. Bilitza, K. Davies, L. Mcnamara, F. Stewart, and M. Pokempner, Ionospheric mapping—an update of foF2 coefficients,
Telecomm. J.,56, 179–182, 1989.
Sethi, N. K., R. S. Dabas, and Y. Ninawe, foF2 variability over New Delhi during different solar cycle conditions and comparison with IRI-2001 model,Adv. Space Res.,40, 855–860, 2007.
Wichaipanich, N., P. Supnithi, M. Ishii, and T. Maruyama, Ionospheric variations at Thailand equatorial latitude station: Comparison between observations and IRI-2001 model predictions,Adv. Space Res.,45, 284– 293, 2010.
Zhang, M. L., J. K. Shi, X. Wang, S. P. Shang, and S. Z. Wu, Ionospheric behavior of the F2 peak parameters foF2 and hmF2 at Hainan and comparisons with IRI model predictions,Adv. Space Res.,39, 661–667, 2007.