Copyright © 2004, American Society for Microbiology. All Rights Reserved.
Development of a Macroarray To Specifically Analyze Immunological
Gene Expression in Swine
Terence N. Ledger,
1Philippe Pinton,
1Dorothe´e Bourges,
2Patrick Roumi,
3Henri Salmon,
2and
Isabelle P. Oswald
1*
INRA, Laboratoire de Pharmacologie-Toxicologie, UR66,1and Laboratoire des Xenobiotiques, UMR1089,331931 Toulouse, and Laboratoire de Pathologie Infectieuse et Immunologie, UR918, 37380 Nouzilly,2France
Received 9 February 2004/Returned for modification 16 March 2004/Accepted 6 April 2004
DNA arrays are useful tools for simultaneously studying the expressions of a large number of genes. Herein, we describe the construction and the optimization of conditions for a low-density DNA macroarray specific for the porcine immune system. This specific DNA macroarray contains 63 gene products, including 20 cytokines, 11 chemokines, and 12 immunologically relevant receptors. It was constructed by designing gene-specific oligonucleotide primers from porcine sequences available in the EMBL or TIGR expressed sequence tag data bank and using primers from conserved regions of aligned sequences from other species for sequences unavailable for swine. Amplicons produced by reverse transcription-PCR were cloned, sequenced, and spotted onto nylon filters. A trial DNA array was first produced to optimize the intensity, specificity, and variability of signals from amplicons amplified with either gene-specific or universal primers. The DNA macroarray was then validated by comparing the gene expression profile of nonstimulated peripheral blood mononuclear cells (PBMCs) to that of phorbol 12-myristate 13-acetate and ionomycin (PMA-Iono)-stimulated PBMCs from three different animals over a 48-h time period. As already described for more conventional techniques, we showed that certain genes, such as those for CD40, gamma interferon, interleukin 2 (IL-2), the IL-2 receptor, and tumor necrosis factor alpha, were upregulated in PMA-Iono-stimulated PBMCs. A detailed analysis also indicated a downregulation of several genes which are expressed mainly by macrophages (IL-1, IL-8, AMCF-1, natural-resistance-associated macrophage protein, neutrophil chemotactic protein, DAP-12, and monocyte chemoattractant protein) in samples stimulated for 24 h with PMA-Iono compared to their levels of expression in control samples. These results indicate that the DNA macroarray that we constructed can be a useful tool for simultaneously monitoring the mRNA expression of immunologically relevant genes in different porcine samples.
The recent availability of a number of complete genomic sequences, such as those of bacteria (6), plants (1), animals (25), and humans (19, 33), has opened up new avenues in the study of the biology of these organisms with DNA arrays. Indeed, DNA arrays offer the advantage of providing simulta-neous quantitative measurements of the expression levels of hundreds to thousands of genes.
Different DNA arrays have been used to analyze the host response to infection (31, 37). For example, microarrays con-structed from the mouse genome have been used to analyze the in vitro response of mice macrophages toSalmonella en-terica serovar Typhimurium (30) or Legionella pneumophila
(26) infection as well as the in vivo response toSchistosoma mansoni infection (18). Microarrays have also been used to study the infection of human monocytes with Staphylococcus aureus(34), human foreskin fibroblasts withToxoplasma gondii
(5), and human cell lines with Listeria monocytogenes (8) or
Bordetella pertussis(3). Analysis of the gene expression of hu-man peripheral blood mononuclear cells (PBMCs) in response to bacteria, bacterial products, and pharmacological stimulants has also been performed with a DNA array (7).
In contrast, very few studies of the host response to infection have been carried out using specific immunological DNA ar-rays for domesticated animals. For example, a chicken DNA array was prepared from nonredundant cDNAs and used to study the reaction of chicken fibroblasts infected with Marek’s disease virus (24). Also, a bovine-specific cDNA array system containing leukocyte expressed sequence tags (ESTs) and am-plicons representing known genes was used to study cattle PBMCs infected byMycobacterium aviumsubsp. paratubercu-losis (9). Some workers have also carried out cross-species microarray hybridization experiments. Indeed, calf ␥␦ -T-cell-subset cDNAs were hybridized to human arrays, showing that they have markedly different tissue-specific functions (17).
Although the pig genome is currently being sequenced and a number of ESTs are available (13), no results of a study using a DNA array specific for the porcine immune system have been published. One of the main interests of our laboratory is to analyze the effect of microbial pathogens and toxins on the immune system, using the pig as a target and model species. In the present paper, we describe a pilot macroarray that can be used as a tool to analyze the changes in gene expression of the pig immune response.
MATERIALS AND METHODS
Isolation and culture of porcine PBMCs.Blood from healthy conventionally reared boars from a slaughterhouse facility at Pamiers, France, was used to * Corresponding author. Mailing address: Laboratoire de
Pharma-cologie-Toxicologie, INRA, 180 Chemin de Tournefeuille, BP3, 31931 Toulouse Cedex 9, France. Phone: (33) 5 61 28 54 80. Fax: (33) 561285310. E-mail: [email protected].
691
on August 17, 2020 by guest
http://cvi.asm.org/
isolate PBMCs as previously described (10). PBMCs isolated from each animal were adjusted to 5⫻ 106 cells/ml in Dulbecco’s minimal essential medium
(Eurobio, Les Ulis, France) containing 2 mML-glutamine, 10% fetal bovine serum (HyClone; Perbio, Brebie`res, France), 100 U of penicillin/ml, and 0.1 mg of streptomycin (Eurobio) per ml. Cells were distributed in 24-well plates (Greiner bio-one, Poitiers, France) and stimulated or not stimulated with 50 ng
of phorbol 12-myristate 13-acetate per ml and 1g of ionomycin per ml (PMA-Iono; Sigma, St. Quentin Fallavier, France). After 3 to 48 h of incubation, cells were harvested for RNA isolation. RNA samples were also obtained from PBMCs collected immediately after isolation and used as time zero samples.
Extraction of RNA.Total RNA was extracted from 10⫻106PBMCs
con-served in Trizol (Invitrogen, Cergy Pontoise, France) as recommended by the TABLE 1. List of the amplicons spotted onto the DNA macroarray
Amplicon name Gene group Size (bp) Accession no. or EST Gene product description ICAM Adhesion molecule 204 AF156712 Intercellular adhesion molecule
VCAM Adhesion molecule 675 L43124 Vascular cell adhesion molecule
CD1 CD antigen 433 AF059492 CD1 antigen
CD40 CD antigen 606 AF326598 CD40 antigen
CD59 CD antigen 210 AF020302 CD59 antigen
CD80 CD antigen 222 AF203442 CD80 antigen
CD95 CD antigen 397 AB027297 CD95 antigen/Fas ligand
IL-8 Chemokine 269 X61151 IL-8
AMCF-1 Chemokine 487 M99367 Alveolar macrophage chemotactic factor 1 (homologue of IL-8) AMCF-2 Chemokine 284 M99368 Alveolar macrophage-derived chemotactic factor 2
BRAK Chemokine 237 AY308800 Breast and kidney derived
MCP-1 Chemokine 320 Z48479 Monocyte chemoattractant protein 1
MCP-2 Chemokine 558 Z48480 Monocyte chemoattractant protein 2
MIP-3- Chemokine 157 AY312065 Macrophage inflammatory protein 3 beta
RANTES Chemokine 290 F14636 Regulated on activation of normal T cell expressed and secreted
SDF-1 Chemokine 446 AY312066 Stromal-cell-derived factor 1
SLC Chemokine 419 AY312067 Secondary lymphoid tissue chemokine
TECK Chemokine 284 AY312064 Thymic expressed chemokine
NCP-1 Chemotactic factor 283 X77935 Neutrophil chemotactic protein 1
COX1 Cyclooxygenase 471 AF207823 Cyclooxygenase 1
GM-CSF Cytokine 407 U61139 Granulocyte-macrophage colony-stimulating factor
IFN-␣ Cytokine 403 M28623 IFN-␣
IFN-␥ Cytokine 379 S63967 IFN-␥
IL-1␣ Cytokine 337 X52731 IL-1 alpha
IL-1 Cytokine 286 X86725 IL-1 beta
IL-2 Cytokine 338 X58428 IL-2
IL-4 Cytokine 324 X68330 IL-4
IL-5 Cytokine 236 AJ133452 IL-5
IL-6 Cytokine 493 M86722 IL-6
IL-7 Cytokine 362 AB035380 IL-7
IL-10 Cytokine 446 L20001 IL-10
IL-12p35 Cytokine 255 L35765 IL-12 (p35 subunit)
IL-12p40 Cytokine 375 U08317 IL-12 (p40 subunit)
IL-13 Cytokine 346 AF385626 IL-13
IL-15 Cytokine 286 U58142 IL-15
IL-16 Cytokine 315 AB091290 IL-16
IL-18 Cytokine 259 AF176949 IL-18
TGF-1 Cytokine 337 M23703 TGF-1
TGF-2 Cytokine 268 L08375 TGF-2
TNF-␣ Cytokine 351 X57321 TNF-␣
GST-A3 GlutathioneS-transferase 435 Z69585 GlutathioneS-transferase alpha3 GST-M1 GlutathioneS-transferase 405 BE232478 (EST) GlutathioneS-transferase mu1 GST-O1 GlutathioneS-transferase 434 AF188838 GlutathioneS-transferase omega1 GST-P1 GlutathioneS-transferase 428 BF440652 (EST) GlutathioneS-transferase pi1 GST-T2 GlutathioneS-transferase 461 BI344427 (EST) GlutathioneS-transferase theta2
-Actin Housekeeping 233 U07786 Beta actin
Cyclo Housekeeping 368 AY008846 Cyclophilin
GAPDH Housekeeping 603 AF017079 Glyceraldehyde-3-phosphate dehydrogenase HPRT Housekeeping 248 AF143818 Hypoxanthine phosphoribosyltransferase ICE IL-1-converting enzyme 398 AB027296 IL-1-converting enzyme
DAP-12 Immunoreceptor 259 AF152021 Associated adapter protein DAP-12 NKG2D Immunoreceptor 405 AF285448 Natural killer immunoreceptor NKG2D IL-2R␣ Cytokine receptor 427 U78317 IL-2R alpha chain
IL-6R␣ Cytokine receptor 220 AF147881 IL-6R alpha chain
IL-8R1 Cytokine receptor 300 AF296552 IL-8R1
TGF-3R Cytokine receptor 329 L07595 TGF-type III receptor
TNF-R Cytokine receptor 520 U19994 p55 TNF receptor
MHC class II MHC class II 471 AB010577 Major histocompatibility complex class II SLA-DQabeta chain
16S Mitochondrial gene 300 AF107224 Mitochondrial 16S RNA
NRAMP NRAMP 307 AF132037 Natural-resistance-associated macrophage protein CTLA4 T-cell activation marker 261 AF220248 Cytotoxic-T-lymphocyte-associated protein 4 iNOS Toxicity response gene 593 U59390 Inducible nitric oxide synthase
aSLA-DQ, swine leukocyte antigen DQ.
692 LEDGER ET AL. CLIN. DIAGN. LAB. IMMUNOL.
on August 17, 2020 by guest
http://cvi.asm.org/
manufacturer. Poly(A)⫹mRNA was isolated from 30⫻106PBMCs with the
Quickprep mRNA purification kit (Amersham Biosciences, Orsay, France). All RNAs [total RNA and poly(A)⫹mRNA] were resuspended in ultrapure water
containing 0.02% (wt/vol) diethyl pyrocarbonate (Sigma). RNAs were quantified by measuring the optical density at 260 nm (OD260). Purity was assessed by
determining the OD260/OD280ratio, which was between 1.8 and 2.
Design of primers and production of amplicon.A global list of immunologi-cally relevant porcine genes, especially those for cytokines and chemokines, was prepared by searching the scientific literature and publicly available databases (PubMed, GenBank, and TIGR) and adding our own isolated sequences (7a). Oligonucleotide primer pairs for the porcine sequences, selected for size (18 to 27 bp), annealing temperature (55 to 68°C), GC% (20 to 80%), and amplicon length (200 to 650 bp), were designed by using the software Primer3 (http://www-.broad.mit.edu/cgi-bin/primer/primer3_www.cgi; Whitehead Institute, Massachu-setts Institute of Technology, Boston, Mass.). For the 5⬘extension of the RANTES protein sequence, primers were designed from the conserved regions of human-, mouse-, and rat-aligned sequences. The sizes of the amplicons and the accession or EST numbers of the genes which were spotted on the macroarray are listed in Table 1. The amplicons were produced by reverse transcription (RT)-PCR using 40 cycles of PCR as previously described (10) and analyzed by electrophoresis. The correct band was purified with a QIAquick gel extraction kit (QIAGEN, Courtaboeuf, France) and cloned into the PCR 2.1 TOPO vector (Invitrogen). Plasmid DNA for each amplicon was isolated with the GenElute plasmid miniprep kit (Sigma) and checked by sequencing (Genome Express, Grenoble, France).
Macroarray production.To prepare all the amplicon templates for spotting on the nylon membrane, PCR amplifications were performed on the purified diluted plasmid with either specific primers for each amplicon or primers designed close to the cloning site of the vector (universal TOPO primers; sense, TAGTAACG GCCGCCAGTGTGCT; antisense, CCGCCAGTGTGATGGATATCTGCA). PCR amplicons were precipitated, washed, and resuspended in distilled water. The amplicon concentration was quantified by measuring the OD260and
ad-justed to 0.2 mg/ml. As seen, the amplicons were spotted in triplicate onto
Immobilon-NY⫹membranes (Millipore, Guyancourt, France) (100 nl of the
PCR template per spot) at the Toulouse Ge´nopoˆle (http://genopole.toulouse .inra.fr) by using a Eurogridder robot (Eurogentec, Seraing, Belgium), and the preliminary testing of arrays revealed good spot homogeneity and good repro-ducibility (Fig. 1).
Synthesis of labeled cDNA and DNA macroarray hybridization.Radioactively labeled cDNA probes were prepared according to an already published protocol (21) by using 5g of total RNA or 1g of poly(A)⫹RNA and 9g of a random
hexamer primer or 1g of an oligo(dT)12–18primer (Invitrogen). cDNA was
purified with ProbeQuant G-50 micro columns (Amersham Biosciences), and similar levels of33P incorporation were verified.
The macroarrays were prehybridized at 65°C for 4 h in 2 ml of Church’s buffer (0.5 M sodium phosphate buffer, pH 7.2, 1% sodium dodecyl sulfate, 1 mM EDTA) before being hybridized for 48 h at 65°C. They were then washed extensively (with 40 mM sodium phosphate buffer, pH 7.2, and 0.1% sodium dodecyl sulfate), dried, and exposed to a Kodak-Molecular Dynamics low-energy screen (Amersham Biosciences) for 3 to 5 days. The hybridization signals were visualized by scanning the screen with a Molecular Dynamics Storm 840 Phos-phorImager (Amersham Biosciences) at a resolution of 50m.
DNA array data analysis.After image acquisition, the scanned images were imported into the Image Master array software (Amersham Biosciences) to quantify the intensities for each spot. The background hybridization intensity was corrected for by subtracting the mean intensity value of water samples spotted randomly over the membrane. All data were analyzed with the software pro-grams Bioplot and Bioclust (https://bio71.gba.insa-tlse.fr/) or imported into a Microsoft Excel worksheet for graphical analysis.
RESULTS
Optimization of the DNA array.A trial DNA array
contain-ing 14 immunologically relevant genes spotted in triplicate was
FIG. 1. Macroarray specific for the pig immune system. (A) Gene layout on the DNA macroarray; (B) hybridization of DNA macroarray with
33P-labeled cDNA probes from unstimulated and PMA-Iono-stimulated porcine PBMCs cultured for 3 h. GSTs, glutathioneS-transferases.
on August 17, 2020 by guest
http://cvi.asm.org/
produced to optimize different factors. We first investigated the intensity, specificity, and variability of signals from ampli-cons amplified with either gene-specific or universal primers. Analysis of the DNA arrays did not reveal any difference in the signal intensities of the amplicons amplified with specific or universal primers (data not shown). Due to the convenience of producing the amplicons with this method, the next macroar-ray generation was created by using universal TOPO primers. Several RNA purification and labeling techniques were also compared. Trial membranes were hybridized with cDNA probes produced with either a random hexamer primer or an oligo(dT) primer. At the same time, a comparison between total and poly(A)⫹mRNA template samples was carried out.
Although there were no differences in intensity between total and poly(A)⫹ samples, those transcribed with the random
primer always had stronger intensities than those transcribed with the oligo(dT) primer (data not shown). Therefore, the next generation of cDNA probes was produced from total RNA with random hexamer primers.
The trial array was checked for the within-sample variability of the spotted amplicons. The coefficient of variation for this parameter was between 2 and 18% depending on which gene was studied and was higher for genes with low expression levels, such as those for transforming growth factor1
(TGF-1) (10%), interleukin 15 (IL-15) (15%), and IL-16 (18%). This DNA macroarray was also tested by comparing the levels of gene expression of porcine PBMCs cultured for 3 h in the presence and in the absence of PMA-Iono. Figure 1 reveals good spot homogeneity and demonstrates that mitogenic stim-ulation induced the overexpression of several immunological genes, such as those for gamma interferon (IFN-␥), tumor necrosis factor alpha (TNF-␣), and IL-10.
Selection of a housekeeping gene.As a differential
expres-sion of housekeeping genes has been described recently (14, 22, 35), the expression levels of four putative housekeeping genes included in the array were determined. Compared to those of immunological genes, the levels of expression of three out of these four housekeeping genes were high: median arbi-trary units were 58 ⫻ 104, 23 ⫻ 104, and 13 ⫻ 104 for the
-actin, GAPDH (glyceraldehyde-3-phosphate dehydroge-nase), and cyclophilin genes, respectively, and 2.1⫻104for the immunological genes. In contrast, the housekeeping gene for hypoxanthine phosphoribosyltransferase (HPRT) had a level of expression similar to that of the immunological genes. The median value of HPRT expression through the different time points was more reproducible than that of the other house-keeping genes, and HPRT expression was very reproducible (median arbitrary units, 2.6 ⫻ 104). Therefore, in all later procedures the HPRT gene was used to normalize the results.
Kinetic analysis of porcine gene expression. The global
change in gene expression was investigated kinetically in both unstimulated and PMA-Iono-stimulated porcine PBMCs. Gene expression in unstimulated PBMCs was first analyzed. The immunity-relevant genes were expressed at low levels in all animals, with expression varying less than twofold between the different animals studied. A global analysis also revealed that in vitro culture for 3 h modulated the expression of several immunity-relevant genes in both unstimulated and PMA-Iono-stimulated PBMCs. Indeed, in vitro culture induced the ex-pression of 10 and 16 genes and suppressed the exex-pression of
TABLE 2. Expression profile of unstimulated porcine PBMCs cultivated in vitro for 3, 12, 24, and 48 h
Gene productb Relative expression (AU) at a:
3 h 12 h 24 h 48 h
ICAM 81.9ⴞ10.2 28.0ⴞ1.3 5.3ⴞ1.6 5.7ⴞ1.2
MCP-1 2.5ⴞ0.5 10.4ⴞ2.0 11.9ⴞ2.6 27.8ⴞ2.9
NCP-1 3.0ⴞ0.2 4.7ⴞ0.2 3.3ⴞ1.0 2.9ⴞ0.8
IL-6R␣ 2.9ⴞ1.1 2.4ⴞ1.2 2.3ⴞ2.2 1.0⫾0.1 IL-2R␣ 2.3ⴞ0.9 1.4⫾0.2 1.2⫾0.2 1.1⫾0.1 IL-4 2.1ⴞ0.5 1.4⫾0.1 1.3⫾0.1 1.2⫾0.2 IL-8 2.6ⴞ0.8 1.1⫾0.3 1.3⫾0.6 0.9⫾0.4 GST-O1 2.3ⴞ0.7 1.9⫾0.2 1.8⫾0.5 1.7⫾0.0 MCP-2 1.3⫾0.0 3.2ⴞ0.5 5.8ⴞ3.8 7.6ⴞ0.3
NRAMP 1.5⫾0.0 2.3ⴞ0.1 2.9ⴞ0.1 2.1ⴞ0.2
VCAM 1.8⫾0.4 1.7⫾0.0 1.4⫾0.1 1.9⫾0.3 CD1 1.7⫾0.1 1.5⫾0.1 1.3⫾0.2 1.2⫾0.1 CD59 1.8⫾0.0 1.5⫾0.3 1.3⫾0.2 1.0⫾0.3 CD80 1.4⫾0.0 1.3⫾0.1 1.1⫾0.0 1.0⫾0.1 CD95 1.0⫾0.0 1.1⫾0.0 1.1⫾0.2 0.9⫾0.1 AMCF-1 1.5⫾0.1 1.1⫾0.3 1.2⫾0.6 0.5⫾0.4 BRAK 1.4⫾0.2 1.1⫾0.4 1.0⫾0.1 0.9⫾0.1 MIP-3 1.5⫾0.1 1.3⫾0.2 1.0⫾0.2 0.9⫾0.2 RANTES 1.1⫾0.1 1.4⫾0.2 1.4⫾0.1 0.6⫾0.1 SDF-1 2.0⫾0.3 1.4⫾0.1 1.1⫾0.1 1.1⫾0.0 SLC 1.7⫾0.2 1.5⫾0.4 1.3⫾0.0 1.1⫾0.2 TECK 1.8⫾0.1 1.6⫾0.3 1.1⫾0.2 1.1⫾0.2 COX1 1.3⫾0.1 1.0⫾0.3 0.9⫾0.2 0.8⫾0.1 GM-CSF 1.8⫾0.6 1.7⫾0.6 1.5⫾0.7 0.9⫾0.2 IFN-␣ 1.3⫾0.2 1.2⫾0.1 0.9⫾0.1 1.2⫾0.1 IFN-␥ 1.9⫾0.1 1.3⫾0.1 1.2⫾0.2 1.0⫾0.0 IL-2 1.5⫾0.1 1.3⫾0.3 1.0⫾0.2 0.9⫾0.1 IL-5 1.7⫾0.1 1.5⫾0.1 1.3⫾0.1 1.2⫾0.3 IL-6 2.0⫾0.2 1.5⫾0.3 1.1⫾0.3 1.1⫾0.2 IL-7 1.4⫾0.1 1.1⫾0.2 1.0⫾0.2 0.9⫾0.2 IL-10 1.7⫾0.8 1.2⫾0.3 0.8⫾0.2 0.7⫾0.2 IL-12p35 1.2⫾0.2 1.2⫾0.2 1.1⫾0.1 1.0⫾0.2 IL-12p40 1.5⫾0.2 1.3⫾0.0 1.1⫾0.1 1.1⫾0.1 IL-13 1.7⫾0.2 1.5⫾0.1 1.2⫾0.0 1.4⫾0.1 IL-15 1.3⫾0.1 1.2⫾0.3 1.0⫾0.3 1.0⫾0.3 IL-16 1.5⫾0.6 1.3⫾0.1 1.2⫾0.1 1.2⫾0.2 IL-18 1.8⫾0.3 1.5⫾0.2 1.2⫾0.3 1.0⫾0.3 TGF-2 1.8⫾0.6 1.2⫾0.2 1.1⫾0.0 1.2⫾0.2 TNF-␣ 1.0⫾0.1 0.8⫾0.2 0.7⫾0.2 0.7⫾0.1 GST-A3 1.4⫾0.2 1.3⫾0.3 0.9⫾0.3 0.9⫾0.2 GST-M1 1.8⫾0.6 1.6⫾0.3 1.5⫾0.1 1.5⫾0.3 GST-P1 0.8⫾0.1 1.5⫾0.2 1.4⫾0.1 1.8⫾0.2 GST-T2 1.5⫾0.2 1.3⫾0.4 1.1⫾0.3 0.9⫾0.3 IL-8R1 1.4⫾0.2 1.1⫾0.2 0.8⫾0.2 0.7⫾0.1 TGF-3R 1.9⫾0.6 1.6⫾0.1 1.3⫾0.0 1.2⫾0.1 TNF-R 1.3⫾0.0 1.6⫾0.1 1.4⫾0.1 1.4⫾0.1 NKG2D 1.5⫾0.2 1.1⫾0.3 0.9⫾0.2 0.6⫾0.1 DAP-12 1.3⫾0.2 1.7⫾0.1 1.6⫾0.1 1.6⫾0.2 CTLA4 2.0⫾0.2 1.5⫾0.2 1.1⫾0.1 1.0⫾0.2 ICE 1.9⫾0.2 1.5⫾0.3 1.1⫾0.1 1.1⫾0.3 iNOS 1.4⫾0.1 1.1⫾0.2 0.9⫾0.2 0.9⫾0.1 IL-1␣ 1.1⫾0.1 0.9⫾0.3 0.7⫾0.3 0.4⫾0.2 IL-1 1.3⫾0.1 0.9⫾0.5 0.9⫾0.4 0.3⫾0.2 CD40 0.7⫾0.1 0.5⫾0.1 0.4⫾0.1 0.4⫾0.1 MHC class II 0.6⫾0.1 0.3⫾0.0 0.3⫾0.0 0.2⫾0.0 TGF-1 0.6⫾0.1 0.3⫾0.0 0.3⫾0.0 0.3⫾0.1
aData are expressed as the means⫾standard errors of the means of values
obtained from three animals relative to those at time zero. Boldface values (mean,⬎2.0) indicate gene overexpression, and underlined values (mean,⬍0.5) indicate gene underexpression. AU, arbitrary units.
bAbbreviation explanations can be found in the gene product description
column of Table 1.
694 LEDGER ET AL. CLIN. DIAGN. LAB. IMMUNOL.
on August 17, 2020 by guest
http://cvi.asm.org/
2 and 6 genes in unstimulated and PMA-Iono-stimulated cul-tures, respectively (Tables 2 and 3).
Stimulation with PMA-Iono induced an early upregulation of the expression of several genes; however, most of the genes returned to their baseline expression level by 48 h (Table 3). This stimulation also downregulated, in a time-dependent manner, the expression of the immunity-relevant genes, with a minimum expression observed 24 h poststimulation. Certain genes, such as the IL-10, CD40, and RANTES genes, were upregulated at the beginning of the stimulation by PMA-Iono and downregulated thereafter (Table 3). Of note is that other genes, such as those for NCP-1 and MCP-1, were modulated only in unstimulated PBMCs (Table 2) and not affected in PMA-Iono-stimulated cultures.
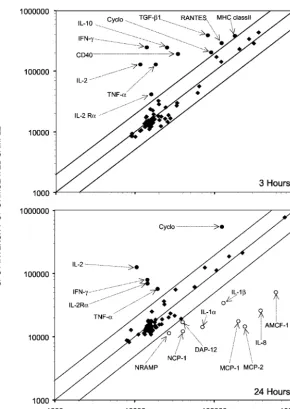
A differential analysis between unstimulated and PMA-Iono-stimulated PBMCs cultivated in vitro for 3 and 24 h was carried out (Fig. 2). It indicated that at the early time point (3 h), 10 genes expressed mainly by lymphocytes were overex-pressed upon PMA-Iono-stimulation. At the later time point (24 h), a few genes remained overexpressed in stimulated sam-ples, and several other genes (the MCP-1, MCP-2, IL-1␣, IL-1, IL-8, AMCF-1, DAP-12, natural-resistance-associated macrophage protein [NRAMP], and NCP-1 genes) expressed mainly by macrophages appeared to be downregulated by the mitogenic stimulation compared with levels of expression in unstimulated samples. We further analyzed the expression of five genes in control and PMA-Iono-stimulated porcine PBMCs. Figure 3 clearly illustrates the induction of the expression of these genes by PMA-Iono stimulation but also reveals the variation between the responses of animals. Indeed, one of the three animals responded poorly to PMA-Iono stimulation for the expression of genes coding for CD40, IL-2, and IL-10 but had a response similar to that of the other animals for the expression of TNF-␣.
DISCUSSION
We have developed a DNA macroarray containing immu-nologically relevant porcine genes. This array has been vali-dated on pig PBMCs cultured in vitro. RT conditions to label the cDNA were optimized to obtain the best reproducibility and yield. We showed that using total RNA and a random hexamer primer gave the strongest reproducible signals (Fig. 1).
When DNA arrays are used, there are several sources of systematic variation which can be corrected by normalization. Normalization can be done in a number of ways: by using either all genes on the array, housekeeping genes, or spiked controls (36). Our macroarray contains fewer than 100 genes, and all of them have the potential to be differentially ex-pressed. In contrast, housekeeping genes are considered to be expressed constantly. However, several reports have indicated that the expression levels of these genes may change in differ-ent situations and tissues (11, 14, 15, 22, 32, 35). In this paper, we demonstrated that the gene coding for HPRT was ex-pressed uniformly among the tested samples and at the same level as the other immunological genes. Therefore, we used this method to normalize our results, and we are currently working on the development of spiked controls.
As was already observed in other studies (10, 28), variations
TABLE 3. Expression profile of PMA-Iono-stimulated porcine PBMCs cultivated in vitro for 3, 12, 24, and 48 h
Gene productb Relative expression (AU) at a:
3 h 12 h 24 h 48 h
ICAM 9.0ⴞ2.9 16.8ⴞ6.7 16.2ⴞ8.9 10.0ⴞ4.5
MCP-1 0.9⫾0.2 1.0⫾0.3 1.5⫾0.7 1.4⫾0.8 NCP-1 0.8⫾0.3 0.8⫾0.1 0.8⫾0.3 1.6⫾0.5 IL-6R␣ 2.5ⴞ1.8 1.5⫾1.10 0.4⫾0.1 0.3⫾0.2 IL-2R␣ 3.7ⴞ0.5 2.8ⴞ0.7 3.2ⴞ0.6 3.7ⴞ1.0
IL-4 2.2ⴞ0.6 1.3⫾0.5 1.1⫾0.5 1.1⫾0.2 IL-8 2.9ⴞ1.5 1.4⫾1.1 0.8⫾0.7 0.8⫾0.4 GST-O1 1.0⫾0.1 1.2⫾0.2 2.3ⴞ0.4 1.8⫾0.0 MCP-2 0.4⫾0.1 0.4⫾0.1 0.4⫾0.0 0.6⫾0.1 NRAMP 1.3⫾0.2 1.1⫾0.4 0.8⫾0.2 0.6⫾0.4 VCAM 1.9⫾0.1 1.8⫾0.4 1.1⫾0.1 1.0⫾0.2 CD1 1.4⫾0.4 1.0⫾0.2 0.7⫾0.3 1.0⫾0.1 CD59 1.5⫾0.2 1.2⫾0.1 0.7⫾0.0 1.3⫾0.1 CD80 1.9⫾0.2 1.1⫾0.0 0.7⫾0.0 1.0⫾0.1 CD95 1.2⫾0.2 1.1⫾0.2 1.1⫾0.2 1.1⫾0.1 AMCF-1 1.4⫾0.0 0.5⫾0.2 0.2⫾0.1 0.2⫾0.1 BRAK 1.1⫾0.1 0.8⫾0.1 0.6⫾0.1 0.6⫾0.1 MIP-3 1.3⫾0.3 1.0⫾0.1 0.9⫾0.1 0.8⫾0.1 RANTES 3.3ⴞ1.3 0.9⫾0.0 0.9⫾0.1 0.8⫾0.3 SDF-1 1.3⫾0.5 1.0⫾0.4 1.0⫾0.2 1.1⫾0.3 SLC 0.9⫾0.1 1.0⫾0.1 0.9⫾0.0 1.1⫾0.0 TECK 1.6⫾0.3 1.3⫾0.2 1.0⫾0.2 1.2⫾0.1 COX1 1.4⫾0.0 1.0⫾0.1 0.7⫾0.2 1.1⫾0.1 GM-CSF 1.9⫾0.3 2.0⫾0.3 2.0⫾0.4 1.9⫾0.3 IFN-␣ 1.0⫾0.5 0.7⫾0.1 0.7⫾0.1 0.8⫾0.3 IFN-␥ 35.8ⴞ15.3 10.4ⴞ1.9 9.4ⴞ0.1 7.8ⴞ1.2
IL-2 15.5ⴞ10.0 11.1ⴞ1.7 12.8ⴞ5.8 1.4⫾0.0 IL-5 1.5⫾0.2 1.2⫾0.1 0.7⫾0.1 0.9⫾0.1 IL-6 2.6ⴞ0.5 3.2ⴞ0.8 1.3⫾0.4 1.0⫾0.3 IL-7 1.2⫾0.2 1.0⫾0.1 0.7⫾0.1 0.8⫾0.0 IL-10 9.8ⴞ2.0 1.0⫾0.5 0.6⫾0.3 0.5⫾0.0 IL-12p35 1.1⫾0.2 0.9⫾0.1 0.7⫾0.1 0.9⫾0.0 IL-12p40 1.1⫾0.0 1.5⫾0.4 1.5⫾0.6 1.0⫾0.1 IL-13 2.1ⴞ0.2 1.2⫾0.3 1.1⫾0.4 1.1⫾0.4 IL-15 1.0⫾0.1 0.8⫾0.1 0.7⫾0.0 0.7⫾0.0 IL-16 1.1⫾0.6 1.1⫾0.6 1.0⫾0.4 0.9⫾0.2 IL-18 1.2⫾0.2 1.1⫾0.2 0.9⫾0.2 0.9⫾0.2 TGF-2 1.0⫾0.0 1.0⫾0.0 1.0⫾0.3 1.3⫾0.2 TNF-␣ 9.7ⴞ0.9 3.6ⴞ0.5 3.4ⴞ0.6 1.1⫾0.2 GST-A3 1.1⫾0.1 1.0⫾0.2 0.7⫾0.1 1.0⫾0.3 GST-M1 2.3ⴞ0.9 1.7⫾0.4 1.4⫾0.5 1.4⫾0.3 GST-P1 0.5⫾0.0 0.8⫾0.1 0.8⫾0.1 1.1⫾0.2 GST-T2 1.3⫾0.2 1.0⫾0.1 0.7⫾0.0 0.7⫾0.0 IL-8R1 1.0⫾0.1 0.7⫾0.0 0.6⫾0.0 0.6⫾0.0 TGF-3R 2.0⫾0.6 1.2⫾0.5 1.0⫾0.4 1.1⫾0.3 TNF-R 0.8⫾0.1 0.7⫾0.0 0.6⫾0.0 0.6⫾0.1 NKG2D 1.3⫾0.1 0.6⫾0.2 0.4⫾0.1 0.5⫾0.1 DAP-12 0.8⫾0.1 0.6⫾0.1 0.4⫾0.0 0.4⫾0.0 CTLA4 2.1ⴞ0.2 1.3⫾0.1 1.1⫾0.1 1.5⫾0.0 ICE 0.9⫾0.0 0.9⫾0.2 0.8⫾0.1 1.1⫾0.1 iNOS 1.0⫾0.1 0.7⫾0.1 0.6⫾0.1 0.8⫾0.0 IL-1␣ 0.7⫾0.1 0.2⫾0.1 0.1⫾0.0 0.1⫾0.0 IL-1 0.9⫾0.2 0.2⫾0.1 0.2⫾0.0 0.1⫾0.0 CD40 2.7ⴞ0.6 1.4⫾0.1 0.7⫾0.1 0.7⫾0.1 MHC class II 0.9⫾0.1 0.3⫾0.1 0.3⫾0.1 0.3⫾0.1 TGF-1 2.0⫾0.3 0.7⫾0.3 0.5⫾0.2 0.4⫾0.1
aData are expressed as the means⫾standard errors of the means of values
obtained from three animals relative to those at time zero. Boldface values (mean,⬎2.0) indicate gene overexpression, and underlined values (mean,⬍0.5) indicate gene underexpression. AU, arbitrary units.
bAbbreviation explanations can be found in the gene product description
column of Table 1.
on August 17, 2020 by guest
http://cvi.asm.org/
in the individual responses to gene expression upon mitogenic stimulation were observed (Fig. 3). As the animals were ran-domly chosen from a commercial farm, even if they were from the same breed, the differences in their genetic backgrounds could have contributed to the observed variations.
Treatment with a combination of PMA and ionomycin acti-vates lymphocytes, as well as other leukocytes, by mimicking the intracellular signals that occur during natural responses to antigens (20, 29). A number of studies have investigated the effect of PMA-Iono on the proliferation and expression of cytokines in human and animal PBMCs. As observed in the present study, PMA-Iono stimulation increased the expression of the gene coding for IFN-␥in human PBMCs (4) but also in PMA-differentiated THP-1 cells (2) and in a porcine
trophec-toderm cell line (23). Similarly, PMA-Iono stimulation has been reported to increase the expression of both IL-2 and the IL-2 receptor (IL-2R) in murine mixed leukocytes (20), human T cells (16), and porcine PBMCs (Table 3). Increased expres-sion of TNF-␣and CD40 upon PMA-Iono stimulation was also observed in CD3-positive human T cells and B cells, respec-tively (12, 27). Using a DNA macroarray specific to the porcine immune system, we confirm the induction of the expression of IFN-␥, IL-2, the IL-2R, TNF-␣, and CD40 in pig PBMCs stimulated with PMA-Iono. Of note is that the kinetic expres-sion of these genes resembles previous results that were ob-tained with concanavalin A-stimulated PBMCs monitored by RT-PCR (10).
PBMCs display both innate and adaptive immune functions
FIG. 2. Scatterplot showing the differential levels of expression of the genes between unstimulated and PMA-Iono-stimulated porcine PBMCs cultured in vitro for 3 and 24 h. Labeled cDNA probes were prepared from lymphocytes of the same animal stimulated or not stimulated with PMA-Iono for 3 or 24 h. Genes that were overexpressed are indicated by filled circles, those that were expressed normally are indicated by filled diamonds, and those that were underexpressed are indicated by open circles. Abbreviations can be found in the gene product description column of Table 1.
696 LEDGER ET AL. CLIN. DIAGN. LAB. IMMUNOL.
on August 17, 2020 by guest
http://cvi.asm.org/
which have well-established roles in surveillance for infectious threats, both directly through contact with infectious agents and indirectly through interactions with infected cells and tis-sues by means of secreted molecules acting as messages. DNA arrays can monitor the expression of genes involved in the immune response as well as that of the secreted messages. Using a DNA macroarray specific to the porcine immune sys-tem, we were able to measure and quantify the changes in gene expression in PBMCs during in vitro culture in the absence or presence of PMA-Iono. This array is currently used to compare the gene expression levels of tissues obtained from pig-ligated loops inoculated with various strains of Escherichia coli and demonstrating different levels of pathogenicity (T. N. Ledger, I. Taranu, and I. P. Oswald, unpublished results).
ACKNOWLEDGMENTS
We thank Veronique Le Berre and Adilia Dagkesamanskaya for the spotting of the PCR amplicons onto the membranes and Thierry Pineau for the use of the TOPO universal primers. We appreciate the help of Segei Sokol for his aid with the computer analysis of data obtained and that of Pascal Martin for helpful discussion.
We also thank the Toulouse Ge´nopoˆle, INRA Transversalite´ “Im-munite´ Muqueuse,” the AGENAE program, and the European Union (project AEEC infection, QLK2-CT-2000-006000) for financial sup-port.
We are solely responsible for the work described in this article, and our opinions are not necessarily those of the European Union.
REFERENCES
1. Arabidopsis Genome Initiative.2000. Analysis of the genome sequence of the flowering plant Arabidopsis thaliana. Nature408:796–815.
2. Asseffa, A., L. A. Dickson, S. Mohla, and T. A. Bremner.1993. Phorbol myristate acetate-differentiated THP-1 cells display increased levels of MHC class I and class II mRNA and interferon-gamma inducible tumoricidal activity. Oncol. Res.5:11–18.
3. Belcher, C. E., J. Drenkow, B. Kehoe, T. R. Gingeras, N. McNamara, H. Lemjabbar, C. Basbaum, and D. A. Relman.2000. The transcriptional re-sponses of respiratory epithelial cells to Bordetella pertussis reveal host defensive and pathogen counter-defensive strategies. Proc. Natl. Acad. Sci. USA97:13847–13852.
4. Biller, H., B. Bade, H. Matthys, W. Luttmann, and J. C. Virchow.2001. Interferon-␥secretion of peripheral blood CD8⫹T lymphocytes in patients
with bronchial asthma:in vitrostimulus determines cytokine production. Clin. Exp. Immunol.126:199–205.
5. Blader, I. J., I. D. Manger, and J. C. Boothroyd.2001. Microarray analysis reveals previously unknown changes inToxoplasma gondii-infected human cells. J. Biol. Chem.276:24223–24231.
6. Blattner, F. R., G. Plunkett, C. A. Bloch, N. T. Perna, V. Burland, M. Riley, J. Collado-Vides, J. D. Glasner, C. K. Rode, G. F. Mayhew, J. Gregor, N. W. Davis, H. A. Kirkpatrick, M. A. Goeden, D. J. Rose, B. Mau, and Y. Shao.
1997. The complete genome sequence ofEscherichia coli K-12. Science
277:1453–1474.
7. Boldrick, J. C., A. A. Alizadeh, M. Diehn, S. Dudoit, C. L. Liu, C. E. Belcher, D. Botstein, L. M. Staudt, P. O. Brown, and D. A. Relman.2002. Stereotyped and specific gene expression programs in human innate immune responses to bacteria. Proc. Natl. Acad. Sci. USA99:972–977.
7a.Bourges, D., C. H. Wang, C. Chavaleyre, and H. Salmon.T and sIgA B lymphocytes of the pharyngeal and palatine tonsils: differential expression of adhesion molecules and chemokines. Scand. J. Immunol., in press. 8. Cohen, P., M. Bouaboula, M. Bellis, V. Baron, O. Jbilo, C. Poinot-Chazel, S.
Galiegue, E. H. Hadibi, and P. Casellas.2000. Monitoring cellular responses toListeria monocytogeneswith oligonucleotide arrays. J. Biol. Chem.275:
11181–11190.
9. Coussens, P. M., C. J. Colvin, G. J. M. Rosa, J. P. Laspiur, and M. D. Elftman.2003. Evidence for a novel gene expression program in peripheral blood mononuclear cells fromMycobacterium aviumsubsp.paratuberculosis -infected cattle. Infect. Immun.71:6487–6498.
10. Dozois, C. M., E. Oswald, N. Gautier, J. P. Serthelon, J. M. Fairbrother, and I. P. Oswald. 1997. A reverse transcription-polymerase chain reaction method to analyze porcine cytokine gene expression. Vet. Immunol. Immu-nopathol.58:287–300.
11. Eickhoff, B., B. Korn, M. Schick, A. Poustka, and J. Van der Bosch.1999. Normalization of array hybridization experiments in differential gene expres-sion analysis. Nucleic Acids Res.27:e33. [Online.]
12. Elliott, S. R., D. M. Roberton, H. Zola, and P. J. Macardle.2000. Expression of the costimulator molecules, CD40 and CD154, lymphocytes from neo-nates and young children. Hum. Immunol.61:378–388.
13. Fahrenkrug, S. C., T. P. L. Smith, B. A. Freking, J. Cho, J. White, J. Vallet, T. Wise, G. Rohrer, G. Pertea, R. Sultana, J. Quackenbush, and J. W. Keele.
2002. Porcine gene discovery by normalized cDNA-library sequencing and EST cluster assembly. Mamm. Genome13:475–478.
14. Foss, D. L., M. J. Baarsch, and M. P. Murtaugh.1998. Regulation of hypoxanthine phosphoribosyltransferase, glyceraldehyde-3-phosphate dehy-drogenase and-actin mRNA expression in porcine immune cells and tis-sues. Anim. Biotechnol.9:67–78.
15. Gibbs, P. J., C. Cameron, L. C. Tan, S. A. Sadek, and W. M. Howell.2003. House keeping genes and gene expression analysis in transplant recipients: a note of caution. Transplant Immunol.12:89–97.
16. Hashimoto, S., Y. Takahashi, Y. Tomita, T. Hayama, S. Sawada, T. Horie, C. C. McCombs, and J. P. Michalski.1991. Mechanism of calcium ionophore and phorbol ester-induced T-cell activation. Scand. J. Immunol.33:393–403. 17. Hedges, J. F., D. Cockrell, L. Jackiw, N. Meissner, and M. Jutila.2003. Differential mRNA expression in circulating␥␦T lymphocyte subsets defines unique tissue-specific functions. J. Leukoc. Biol.73:306–314.
18. Hoffmann, K. F., T. C. McCarty, D. H. Segal, M. Charamonte, M. Hesse, E. M. Davis, A. W. Cheever, P. S. Meltzer, H. C. Morse III, and T. A. Wynn.
2001. Disease fingerprinting with cDNA microarrays reveals distinct gene expression profiles in lethal type 1 and type 2 cytokine-mediated inflamma-tory reactions. FASEB J.15:2545–2547.
19. International Human Genome Sequencing Consortium.2001. Initial se-quencing and analysis of the human genome. Nature409:860–921. (Erratum,
412:565.) FIG. 3. Kinetics of mRNA expression of five immune genes (the
CD40, IFN-␥, IL-2, TNF-␣, and IL-10 genes) in PBMCs isolated from three different pigs. RNAs obtained from unstimulated and PMA-Iono-stimulated PBMCs which had been cultured for different times (0, 3, 24, and 48 h) were reverse transcribed, labeled, and hybridized to the macroarray. Relative mRNA levels for each gene plotted against time are presented as the mean levels of intensity of expression stan-dardized to HPRT gene expression. In each panel, unstimulated and PMA-Iono-stimulated PBMCs from the same pig are represented by the same symbol. Open symbols represent unstimulated PBMCs. Filled symbols represent PMA-Iono-stimulated PBMCs.
on August 17, 2020 by guest
http://cvi.asm.org/
20. Isakov, N., and A. Altman.1985. Tumor promoters in conjunction with calcium ionophores mimic antigenic stimulation by reactivation of alloanti-gen-primed murine T lymphocytes. J. Immunol.135:3674–3680.
21. Lagorce, A., N. C. Hauser, D. Labourdette, C. Rodriguez, H. Martin-Yken, J. Arroyo, J. D. Hoheisel, and J. Francois.2003. Genome-wide analysis of the response to cell wall mutations in the yeastSaccharomyces cerevisiae.J. Biol. Chem.278:20345–20357.
22. Manganelli, R., E. Dubnau, S. Tyagi, F. R. Kramer, and I. Smith.1999. Differential expression of 10 sigma factor genes inMycobacterium tubercu-losis.Mol. Microbiol.31:715–724.
23. Marcelo, P., M. Bernoin, and F. Lefe`vre.2003. Atypical mechanisms regulate the PMA-induced expression of IFN-␥in a porcine trophectoderm cell line. Vet. Immunol. Immunopathol.92:163–172.
24. Morgan, R. W., L. Sofer, A. S. Anderson, E. L. Bernberg, J. Cui, and J. Burnside.2001. Induction of host gene expression following infection of chicken embryo fibroblasts with oncogenic Marek’s disease virus. J. Virol.
75:533–539.
25. Mouse Genome Sequencing Consortium.2002. Initial sequencing and com-parative analysis of the mouse genome. Nature420:520–562.
26. Nakachi, N., K. Matsunaga, T. W. Klein, H. Friedman, and Y. Yamamoto.
2000. Differential effects of virulent versus avirulentLegionella pneumophila
on chemokine gene expression in murine alveolar macrophages determined by cDNA expression array technique. Infect. Immun.68:6069–6072. 27. Nguyen, L. T., M. Ramanathan, B. Weinstock-Guttman, M. Baier, C.
Brown-scheidle, and L. D. Jacobs.2003. Sex differences inin vitropro-inflammatory cytokine production from peripheral blood of multiple sclerosis patients. J. Neurol. Sci.209:93–99.
28. Oswald, I. P., C. M. Dozois, R. Barlagne, S. Fournout, M. V. Johansen, and H. O. Bøgh.2001. Cytokine mRNA expression in pigs infected with Schis-tosoma japonicum.Parasitology122:299–307.
29. Pinzon-Charry, A., J. P. Vernot, R. Rodriguez, and M. E. Patarroyo.2003. Proliferative response of peripheral blood lymphocytes to mitogens in the owl monkeyAotus nancymae.J. Med. Primatol.32:31–38.
30. Rosenberger, C. M., M. G. Scott, M. R. Gold, R. E. Hancock, and B. B. Finlay.2000. Salmonella typhimurium infection and lipopolysaccharide stim-ulation induce similar changes in macrophage gene expression. J. Immunol.
164:5894–5904.
31. Rosenberger, C. M., A. J. Pollard, and B. B. Finlay.2001. Gene array technology to determine host responses toSalmonella. Microbes Infect.
3:1353–1360.
32. Savonet, V., C. Maenhaut, F. Miot, and I. Pirson.1997. Pitfalls in the use of several “housekeeping” genes as standards for quantitation of mRNA: the example of thyroid cells. Anal. Biochem.247:165–167.
33. Venter, J. C., M. D. Adams, E. W. Myers, P. M. Li, R. J. Mural, G. G. Sutton, H. O. Smith, M. Yandell, C. A. Evans, R. A. Holt, et al.2001. The sequence of the human genome. Science291:1304–1351. (Erratum,292:1838.) 34. Wang, Z. M., C. Liu, and R. Dziarski.2000. Chemokines are the main
proinflammatory mediators in human monocytes activated byStaphylococcus aureus, peptidoglycan, and endotoxin. J. Biol. Chem.275:20260–20267. 35. Wu, X., K. Englund, B. Lindblom, and A. Blanck.2003. mRNA-expression of
often used house-keeping genes and the relation between RNA and DNA are sex steroid-dependent parameters in human myometrium and fibroids. Gynecol. Obstet. Investig.55:225–230.
36. Yang, Y. H., S. Dudoit, P. Luu, D. M. Lin, V. Peng, J. Ngai, and T. P. Speed.
2002. Normalization for cDNA microarray data: a robust composite method addressing single and multiple slide systematic variation. Nucleic Acids Res.
30:e15. http://nar.oupjournals.org/cgi/reprint/30/4/e15.
37. Yowe, D., W. J. Cook, and J. C. Gutierrez-Ramos.2001. Microarrays for studying the host transcriptional response to microbial infection and for the identification of host drug targets. Microbes Infect.3:813–821.
698 LEDGER ET AL. CLIN. DIAGN. LAB. IMMUNOL.