A Robust Augmented Combination of Digital Predistortion and
Crest Factor Reduction for RF Power Amplifiers
Jingmei Zhao1, 2, *, Cuiping Yu1, 2, Jianguo Yu1, 2, Yuanan Liu1, 2, and Shulan Li1, 2
Abstract—This paper proposes a robust combination of digital predistortion (DPD) and crest factor reduction (CFR) for radio frequency (RF) power amplifiers (PAs). It is constructed using the architecture of CFR-DPD connected with a compensation module (CM). The compensation module is introduced to achieve mutual compensation between the output signals of CFR and DPD, and this can reduce the damage to the signal by CFR. The combination of CFR-DPD-CM provides the means to exploit margins in the transmitter performance, allowing the tradeoff among peak-to-average power ratio (PAPR), adjacent channel power ratio (ACPR) and error vector magnitude (EVM). The proposed combination of CFR-DPD-CM is assessed using a GaN Class-F PA driven by two modulated signals (a 4-carrier OFDM signal and a WCDMA 1001 signal with 20-MHz bandwidth), and a GaN Doherty PA driven by a 15-MHz long-term evolution (LTE) signal. The experimental results show that when the CFR reduces the PAPR about 4 dB, applying the proposed combination of CFR-DPD-CM, the average reduction of ACPR is 5.12 dB, and the average reduction of EVM is 1.26% compared with the conventional architecture of CFR-DPD.
1. INTRODUCTION
In modern wireless communication infrastructure, radio frequency power amplifiers (PAs) are one of the most critical and expensive subsystems. In 3G and 4G wireless communication standards, PAs are designed to meet stringent linearity and high efficiency requirements [1–3]. The main signals used in modern communication systems often carry more information, such as wideband code division multiple access (WCDMA) signal, orthogonal frequency-division multiplexing (OFDM) signal, and long-term evolution (LTE) signal. However, these signals are non-constant envelope modulate and are always with high peak-to-average power ratio (PAPR). Hence, the power amplifier needs to operate at lower power levels, relatively far away from the region of saturated, which means that the power must be backed-off to ensure the amplifier operating in the linear region. However, the efficiency of the amplifier will be greatly reduced.
To overcome this problem, several methods have been proposed in the literature [4–7]. The main approach is reducing the PAPR, but a peak reduction of the complex baseband signal is generally at the expense of additional distortions. In recent years, some scholars have proposed the technique of combining the crest factor reduction (CFR) and digital predistortion (DPD) [8–17], which will make considerable improvement in both efficiency and linearity. In [14], a synergetic CFR and DPD design is discussed, which uses a structure similar to the situation in Figure 1. The author in [17] applied the CFR post to the DPD to reduce the PAPR of the predistorted signal.
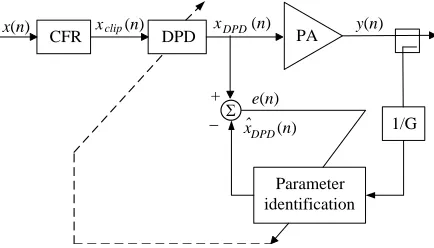
Figure 1 illustrates the generic CFR and DPD scheme, wherex(n) is the input signal to the CFR unit, and the output signal of DPD feeds the power amplifier to produce the output signal y(n). This system will create unrecoverable damage to the EVM, and the linearization performance will be worse
Received 23 March 2015, Accepted 5 June 2015, Scheduled 15 June 2015 * Corresponding author: Jingmei Zhao ([email protected]).
1 Beijing Key Laboratory of Work Safety Intelligent Monitoring, Beijing University of Posts and Telecommunications, China. 2School
CFR DPD PA
1/G +
Parameter identification −
x(n) x (n)clip x (n)DPD y(n)
e(n) ˆ
DPD
x (n)
Σ
Figure 1. Typical use of CFR with DPD.
than the situation with DPD applied only [20]. Hence, reducing the PAPR and at the same time ensuring good performance of EVM and ACPR is very significant.
In this paper, based on the peak clipping algorithm and predistortion technique, a robust and accurate architecture termed as CFR-DPD-CM is proposed. Compared with the conventional architecture of CFR-DPD, the combination of CFR-DPD-CM adds a compensation module, used to optimize the output signals from CFR and DPD. Hence, the overall system has a high performance in improving the distortions of in-band and out-of-band. Moreover, we give the detailed algorithm for system identification. Thorough comparisons have also been given between conventional technique and the proposed technique. The comparison results fully illustrate that the combination of CFR-DPD-CM is superior to the conventional architecture of CFR-DPD. In Section 2, the crest factor reduction, digital predistortion techniques and the relationship between them are introduced. Section 3 presents the identification algorithm of the CFR-DPD-CM architecture. Section 4 gives the experimental results of a wideband PA and a Doherty PA. Finally, a conclusion is given in Section 5.
2. CFR AND DPD TECHNIQUES 2.1. Crest Factor Reduction
In the design and linearization systems of power amplifiers, the CFR technique is widely used to reduce the PAPR of multiband modulated signals. Clipping works by intentionally limiting a signal, so that the amplitude is limited to a maximum value with in a desired range. It allows additional gain at the output and makes it possible to operate the PA closer to its 1-dB compression point, which increases its efficiency. This paper applies polar clipping method [6], which can mitigate the clipping noise significantly and is described by formula as follows
xclip=
xn |xn| ≤A
Aexp(jarg(xn)) |xn|> A (1)
where xn is the input signal, xclip the clipped output signal, A a clipping threshold, and arg(·) the seeking phase. The clipping ratio (CR) is defined as
CR= 20 logA
σ dB (2)
where σ is the root mean square (RMS) of the input signal power. Because the process of limit is nonlinear, the system which includes CFR will create in-band distortion and out-of-band spectral regrowth. After clipping, the clipped output signal often requires filtering to mitigate the impact on the out-of-band spectral regrowth.
2.2. Digital Predistortion
Polynomial (MP) model and indirect learning architecture [18]. We define the DPD module without a preceding CFR module as follows
y(n) = K
k=1 M
m=0
hkmx(n−m)|x(n−m)|k−1 (3)
where x(n) and y(n) are the input and the output signals of the MP model respectively, andK is the nonlinearity order. The model includes only odd-order terms. M is the finite memory length of the model, and hkm are the complex DPD coefficients. Since y(n) is linear with parametershkm, we define a new sequence
ukm =x(n−m)|x(n−m)|k−1 (4)
We can rewrite (3) in matrix form as
y=Uh (5)
y = [y(0), . . . , y(N −1)]T, U = [u10, . . . ,uK0, . . . ,u1M, . . . ,uKM], ukm = [ukm(0), . . . , ukm(N −1)]T, andh= [h10, . . . , hK0, . . . , h1M, . . . , hKM]T,N is the number of input signal. The least-squares (LS) [19] solution for (5) is
ˆ
h=UHU−1UHy (6)
where (·)H denotes the complex conjugate transpose.
2.3. Relationship between CFR and DPD
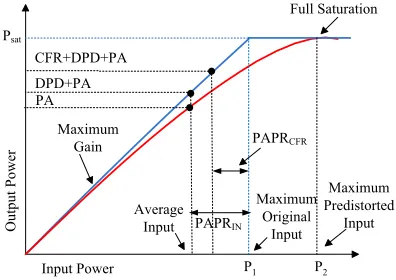
Although the technologies of CFR and DPD are researched separately in the past, there are some intrinsical links between them. Such a relationship is shown in Figure 2.
From Figure 2 we can see that after clipping, the PAPR is decreased from PAPRIN to PAPRCFR. Meanwhile, the operation zone of the output power is pushed higher. In other words, combining CFR and DPD pushes the operation region of the PA near its 1-dB compression point. References [20–22] presented the research of the effects by CFR in DPD systems, and the experimental results validate that the introduction of CFR will bring a few drawbacks to the system.
3. PROPOSED APPROACH DESCRIPTION
In order to alleviate the drawbacks of the traditional combination of CFR and DPD, it is augmented through additional parameters of a compensation module (CM). The CM sub-block is for the mutual compensation of CFR and DPD. As shown in Figure 3, one may further notice that CFR and DPD with the compensation module are interoperable.
Full Saturation
Input Power
Output Power
Maximum Gain Psat
PAPRIN
Maximum Original
Input PAPRCFR
P1
Maximum Predistorted
Input
P2 CFR+DPD+PA
DPD+PA
Average Input PA
Figure 2. Relationship between CFR and DPD.
CFR DPD
Compensation module
PA
1/G
Parameter identification ˆ
DPD x (n)
Σ
+
−
x(n) x (n)clip x (n)DPD y(n)
e(n)
From Figure 3, assuming that the input and output signals of CFR arex(n) andxclip(n), the output signal of DPD is xDPD(n). For the sake of simplicity, x(n), xclip(n) and xDPD(n) are represented by xn,xclip and xDPD. The average power of the clipped signal is
Pclip =E
|xclip|2
= 1−e−γ2 (7)
whereγ =A/√δ is the limiting ratio,δ=E{|xn|2} the average power of the input signal, andE[ ] the expected value. Here, the clipped output signal is equal to the one in Formula (1), and it can be written by the superimposed of the input signal and the limiting non-linear disturbances [6] as follows
xclip=αxn+dn (8)
whereα is the complex attenuation coefficient of the clipped signal and is given as follows
α= E
xH
nxclip E{xH
nxn}
(9)
dn is a random variables, with zero mean and being independent identically distributed. The variance is
E
|dn|2
=δ·
1−e−γ2 −α2
(10)
Similar to Equation (8), xDPD is also written as follows
xDPD =q·xclip+sn (11)
whereq is the complex attenuation coefficient of the predistorter’s input signal and is given as follows
q= E
xH
clipxDPD
E
xHclipxclip
(12)
where sn is the nonlinear distortion that generated by the predistorter. Substituting (8) into (11), we can obtain the relationship between the input signal and predistorted signal. Here, we consider the three modules of CFR, DPD and CM as a local system, and the equation can be written as
xDPD =q·α·xn+q·dn+sn=η·xn+gn (13)
whereη and gn are the attenuation coefficient and interference of the local system as mentioned above respectively, andη can be defined by
η = E
xHnxDPD E{xH
nxn}
(14)
With respect to the signals’ peaks, DPD tends to increase peaks in order to compensate the compression caused by the power amplifier, and it can be seen as an extension applied to the input signal, while CFR tends to reduce peaks to achieve the target PAPR. In some sense, they have a reciprocal relationship.
In the proposed system of CFR-DPD-CM, clipping parameters are set by the compensation module. The clipping parameters mainly refer to the threshold, target PAPR, EVM index, etc. The procedure to implement compensation of CFR and DPD is briefly summarized as follows:
(1) According to the practical requirements, preset the clipping parameters;
(2) Distribute the clipping parameters to CFR and DPD via compensation module;
(3) Based on the clipping parameters, CFR and DPD will correct the results xclip and xDP D, determined from (1) and (11), then give the correct values back to the compensation module; (4) The compensation module continues to analyze and optimize the results, and repeat the process
until the results conform to the objectives’ requirements;
As in Figure 3, the output signal of DPD is assumed as follows
xDPD(n) = K
k=1 M
m=0
hkmxclip(n−m)|xclip(n−m)|k−1 (15)
K×(M + 1) is the number of coefficients for aligned signal and envelope. When the system achieves convergence state, it should have
xDPD(n) = K
k=1 M
m=0 hkm
y(n−m) G
y(nG−m)k−1 (16)
whereG is the linear gain of the system, and we define a new sequence as follows
u(n) = M
m=0
y(n−m) G
y(nG−m)k−1 (17)
Equation (16) can be rewritten in matrix form as (18), and the LS solution for it is given in (19)
xDPD =Uh (18)
h=UHU−1UHxDPD (19) The estimation error is written as
e(n) =xDPD(n)−xˆDPD(n) (20)
In the same way, the LS estimate of the DPD coefficient error is
Δh=UHU−1UHen (21)
where Δh = [Δh10, . . . ,ΔhK0, . . . ,Δh1M, . . . ,ΔhKM]T, xDPD = [xDPD(0), . . . , xDPD(N −1)]T, and
en= [e(0), . . . , e(N −1)]T the updated DPD coefficients can be written as
hi+1=hi−λDPDΔh (22)
where iindicates the iteration number, andλDPD is the relaxation constant. IfλDPD = 1 and h0 = 0, the algorithm converges to the LS solution (19) in one step. For λDPD < 1, there is some memory introduced, which constrains how much h can change from one block to the next, and updating the coefficients is repeated, further reducing the output distortion.
4. EXPERIMENTAL RESULTS AND DISCUSSION
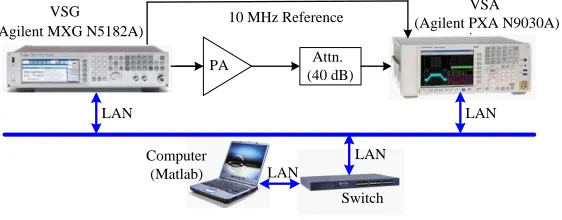
In order to validate the effectiveness of the proposed architecture of CFR-DPD-CM for different PAs, a 30 W Class F wideband PA (Vds = 28 V, Vgs = 5 V) operating at a frequency range from 2.6 GHz to 2.7 GHz and a 40 W GaN Doherty PA (DPA, Vds = 28 V, Vgs = −2.7 V) operating at 2.65 GHz were tested. The test bench for generating the RF input and output signals to the PA is shown in Figure 4.
Attn. (40 dB) 10 MHz Reference
LAN LAN
LAN LAN
Switch Computer
(Matlab) VSG
(Agilent MXG N5182A)
VSA (Agilent PXA N9030A)
PA
It consists of a vector signal generator (VSG, Agilent MXG N5182A), a vector signal analyzer (VSA, Agilent PXA N9030A), a RF PA, a 40 dB attenuator, and a computer running MATLAB software. The VSG and VSA were phase locked with the 10 MHz reference clock.
The connections between the MATLAB code and the MXG/PXA use functions available from the Agilent Download Assistant. The digital baseband signal was generated in the computer and processed by the local system of CFR-DPD-CM, then downloaded over an Ethernet connection to the VSG, which will up-convert to RF to drive the PA. After that, the output signal of the PA was attenuated and sent to the VSA. After down-converted and demodulated, the output signal was captured by the MATLAB software. The captured signal was time aligned with its corresponding input signal for further behavioral modeling. A memory polynomial such as (3) is used to behavioral modeling, nonlinearity order (K = [3,5,7]), and the memory depth (M = 3).
In the following three experiments, the Class F wideband PA was driven by a 4-carrier OFDM signal which comprised four 5-MHz channels, and a 20-MHz WCDMA 1001 signal. The modulation scheme used in the above two signals was 16 quadrature amplitude modulated (16-QAM). The GaN Doherty PA was driven by a 15-MHz LTE signal modulated with 64-QAM. The center frequency of each signal is 2.65 GHz.
Regarding the effects of the signals peak controller on the in-band error, the EVM, which presents a measure of the average constellation errors, is defined as
EVM =
N−1
n=0
r−→(n)−m−→(n)2
N−1
n=0
r−→(n)2
∗100% (23)
where r(n) andm(n) are the reference signal and test signal, respectively. PAPR is also an important index defined as the ratio of the highest signal peak power to its average power value and can be expressed as
PAPR(dB) = 10 log10
max 0≤n≤N−1
|xn|2
E 0≤n≤N−1
|xn|2
(24)
4.1. Class F Wideband PA with OFDM Signal
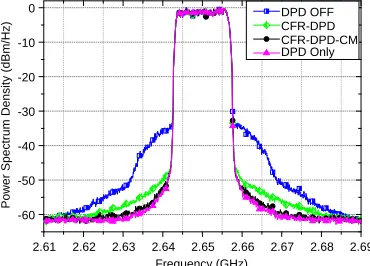
In the first experiment, we employed a 20-MHz 4-carrier OFDM signal to drive the Class F wideband PA. The out-of-band distortion is measured by ACPR. The in-band distortion is measured by EVM determined in (23), and the PAPR of the input signal is about 11.21 dB. In the 4-carrier OFDM signal test, a total of 100,000 samples were captured at the input and output of the PA with 100 MHz sampling rate, whereas 8000 samples were used for synchronization and model extraction employing the LS algorithm.
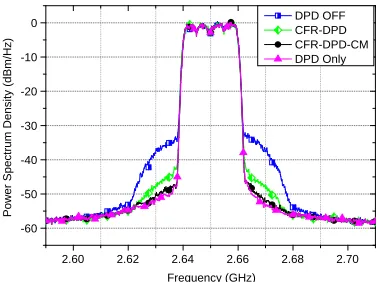
Let us present the parameters for the CFR-DPD-CM structure implemented using the compensation. The threshold A of the CFR is set to 2.1 times of the average power and the index of the EVM set to 2.2%. Figure 5 shows the measured spectra of the PA’s output signal for the cases of DPD off, combination of CFR-DPD, combination of CFR-DPD-CM, and DPD only. When applied the proposed combination of CFR-DPD-CM, the value of ACPR has improved about 18 dB, which is significantly better than the conventional structure of CFR-DPD.
2.60 2.62 2.64 2.66 2.68 2.70
Frequency (GHz)
DPD OFF CFR-DPD CFR-DPD-CM DPD Only
-60 -50 -40 -30 -20 -10 0
Power Spectrum Density (dBm/Hz)
Figure 5. PA output spectrum with the 4-carrier OFDM signal.
0 2 4 6 8 10 12
10 10 10 10 10
PAPR (dB)
Probability (%)
X-in
X-DPD y
X-CFR
-4 -3 -2 -1 0
Figure 6. CCDF plots under the structure of CFR-DPD-CM with the OFDM signal.
Table 1. Comparison results under the OFDM signal.
Combined Output EVM ACPR (dBc)
approaches PAPR (dB) (%) −5 MHz 5 MHz DPD OFF 9.33 5.42 −34.9 −34.5 CFR-DPD 7.02 3.45 −47.6 −47.1 DPD Only 11.84 1.99 −52.5 −53.1 CFR-DPD-CM 7.23 2.13 −52.3 −52.7
Measurements of the PA output include the output PAPR, EVM, and ACPR. Table 1 lists the measurements for different conditions when the OFDM signal is applied. We can see that under the condition of CFR-DPD-CM, it has reduced the output PAPR by 4.61 dB and slightly increased the EVM about 0.14 percentage points compared to the case of DPD applied in isolation. However, compared to the combination of CFR-DPD, it has reduced the EVM about 1.32 percentage points, reduced ACPR about 5 dB. Meanwhile, PAPR has a slight increase, as expected.
4.2. Class F Wideband PA with WCDMA Signal
In order to further verify the performance of the proposed approach, the second example employs a WCDMA signal with 1001-carrier configuration, which comprises two 5-MHz wide carriers, and the PAPR of the signal is about 10.12 dB.
When the Class F wideband PA was driven by the 20-MHz WCDMA 1001 signal, the spectrum performance for the cases of no linearization, both CFR and DPD, the combination of CFR-DPD-CM, and DPD only are shown in Figure 7. It is obvious that the combination of CFR-DPD-CM and DPD only can implement better linearization effectiveness of RF PA than the combination of CFR-DPD. Figure 8 shows the CCDF of the input signal x(n), clipped signal xclip(n), the predistorted signal xDPD(n), and output signal y(n) when the proposed approach of CFR-DPD-CM is applied. From Figure 8, the combination of CFR-DPD-CM has reduced the PAPR of the input signal by 3.42 dB, and the variation characteristics are similar to the cases in Figure 6.
Table 2 shows the output PAPR, EVM and ACPR of the PA in the cases of DPD off, both CFR and DPD, DPD only, and the combination of CFR-DPD-CM. It is obvious that employing a WCDMA signal to drive the Class F PA can also get the anticipated effect.
2.61 2.62 2.63 2.64 2.65 2.66 2.67 2.68 2.69 Frequency (GHz)
DPD OFF CFR-DPD CFR-DPD-CM DPD Only
-60 -50 -40 -30 -20 -10 0
Power Spectrum Density (dBm/Hz)
Figure 7. PA output spectrum with the WCDMA 1001 signal.
0 2 4 6 8 10 12
10 10 10 10 10
PAPR (dB)
Probability (%)
X-in
X-DPD
y
X-CFR
-4 -3 -2 -1 0
Figure 8. CCDF plots under the structure of CFR-DPD-CM with the WCDMA signal.
Table 2. Comparison results under the WCDMA signal.
Combined Output EVM ACPR (dBc)
approaches PAPR (dB) (%) −5 MHz 5 MHz DPD OFF 8.52 5.02 −34.8 −34.2 CFR-DPD 6.73 3.12 −47.6 −47.8 DPD Only 10.71 1.95 −52.8 −52.9 CFR-DPD-CM 6.85 2.04 −52.5 −52.2
Table 3. Measurements for the WCDMA signal when the combination of CFR-DPD-CM is applied.
Pout Output EVM ACPR (dBc)
(dBm) PAPR (dB) (%) −5 MHz 5 MHz 33.0 6.23 3.11 −50.7 −50.6 32.0 6.85 2.04 −52.5 −52.2 31.0 7.36 1.97 −53.2 −52.8 30.0 8.05 1.85 −55.4 −54.9
4.3. GaN Doherty PA with LTE Signal
Our proposed technique can work for the amplifiers in different classes, and it can also work for higher modulation level such as 32-QAM and 64-QAM which are often applied in the latest 3G and 4G signals. In this experiment, we have employed a typical amplifier of GaN Doherty PA, which was driven by a 15-MHz LTE signal which modulated with 64-QAM, and the LTE signal has a PAPR of 11.18 dB.
Figure 9 presents the output spectra under different cases of no linearization, combination of CFR-DPD, combination of CFR-DPD-CM, and DPD only. From Figure 9, it can be seen that the linearization performance of the proposed technique is much better than the combination of CFR-DPD. Figure 10 shows the CCDF for different cases when the proposed CFR-DPD-CM is applied. According to Figure 10, CFR reduces the PAPR of the input signal by 3.66 dB, which is beneficial because the transistors within the output region of the PAs are stressed less.
2.61 2.62 2.63 2.64 2.65 2.66 2.67 2.68 2.69 Frequency (GHz)
DPD OFF CFR-DPD CFR-DPD-CM DPD Only
-60 -50 -40 -30 -20 -10 0
Power Spectrum Density (dBm/Hz)
Figure 9. PA output spectrum with the 15-MHz LTE signal.
0 2 4 6 8 10 12
10 10 10 10 10
PAPR (dB)
X-DPD X-CFR
y X-in
Probability (%)
-4 -3 -2 -1 0
Figure 10. CCDF plots under the structure of CFR-DPD-CM with the LTE signal.
Table 4. Comparison results under the LTE signal.
Combined Output EVM ACPR (dBc)
approaches PAPR (dB) (%) −5 MHz 5 MHz DPD OFF 9.27 5.36 −35.2 −35.1 CFR-DPD 7.14 3.37 −52.3 −51.8 DPD Only 11.79 1.91 −58.2 −57.7 CFR-DPD-CM 7.31 1.98 −57.8 −57.4
Table 5. Comparison results with conventional CFR-DPD techniques and proposed CFR-DPD-CM technique.
Conventional CFR-DPD in [14]
Conventional CFR-DPD in [17]
Proposed CFR-DPD-CM
PAE (%) 46.28 46.56 46.73
ACPR (dBc) −52.5/−51.7 −53.1/−52.3 −57.8/−57.4
Power (dBm) 38.45 38.69 38.71
EVM (%) 3.52 3.07 1.98
the proposed CFR-DPD-CM technique in terms of the performance of power-added efficiency (PAE), ACPR, average output power, and EVM. Furthermore, they have used the same device and the same excitation signal. According to Table 5, lower ACPR and EVM can be acquired using the proposed CFR-DPD-CM technique, without sacrificing the performance of PAE and output power.
5. CONCLUSION
ACKNOWLEDGMENT
This work was supported in part by the National Basic Research Program of China (973 Program, No. 2014CB339900), National Natural Science Foundation of China for the Major Equipment Development (No. 61327806), and National Natural Science Foundation of China (No. 61201025).
REFERENCES
1. Hashmi, M. S., Z. S. Rogojan, and F. M. Ghannouchi, “A flexible dual-inflection point RF predistortion linearizer for microwave power amplifiers,” Progress In Electromagnetics Research C, Vol. 13, 1–18, 2010.
2. El Maazouzi, L., A. Mediavilla, and P. Colantonio, “A contribution to linearity improvement of a highly efficient PA for WIMAX applications,” Progress In Electromagnetics Research, Vol. 119, 59–84, 2011.
3. Du, T., C. Yu, Y. Liu, J. Gao, S. Li, and Y. Wu, “A new accurate Volterra-based model for behavioral modeling and digital predistortion of RF power amplifiers,”Progress In Electromagnetics Research C, Vol. 29, 205–218, 2012.
4. Jiang, T., Y. Yang, and Y.-H. Song, “Exponential companding technique for PAPR reduction in OFDM systems,” IEEE Trans. Broadcast., Vol. 51, No. 2, 244–248, Jun. 2005.
5. Krongold, B. S. and D. L. Jones, “PAR reduction in OFDM via active constellation extension,”
IEEE Trans. Broadcast., Vol. 49, No. 3, 258–268, Sep. 2003.
6. Baxley, R. J., C. Zhao, and G. T. Zhou, “Constrained clipping for crest factor reduction in OFDM,”
IEEE Trans. Broadcast., Vol. 52, No. 4, 570–575, 2006.
7. Armstrong, J., “Peak-to-average power reduction for OFDM by repeated clipping and frequency domain filtering,” Electron. Lett., Vol. 38, No. 5, 246–247, 2002.
8. Gilabert, P. L., M. E. Gadringer, G. Montoro, M. L. Mayer, D. D. Silveira, E. Bertran, and G. Magerl, “An efficient combination of digital predistortion and OFDM clipping for power amplifiers,”Int. J. RF Microw. Compu. Aid. Eng., 583–591, 2009.
9. Helaoui, M., S. Boumaiza, A. Ghazel, and F. M. Ghannouchi, “On the RF/DSP design for efficiency of OFDM transmitters,” IEEE Trans. Microw. Theory Tech., Vol. 53, No. 7, 2355–2361, 2005. 10. Sperlich, R., Y. Park, G. Copeland, and J. S. Kenney, “Power amplifier linearization with digital
pre-distortion and crest factor reduction,” IEEE MTT-S Int. Microwave Symposium (IMS), 669– 672, 2004.
11. Nader, C., P. N. Landin, W. V. Moer, N. Bj¨orsell, and P. H¨andel, “Performance evaluation of peak-to-average power ratio reduction and digital pre-distortion for OFDM based systems,” IEEE Trans. Microw. Theory Tech., Vol. 59, No. 12, 3504–3511, 2011.
12. Nader, C., P. H¨andel, and N. Bj¨orsell, “Peak-to-average power reduction of OFDM signals by convex optimization: Experimental validation and performance optimization,” IEEE Trans. Instrum. Meas., Vol. 60, No. 2, 473–479, 2011.
13. Nader, C., P. N. Landin, W. V. Moer, N. Bj¨orsell, P. H¨andel, and D. R¨onnow, “Peak-power controlling technique for enhancing digital pre-distortion of RF power amplifiers,” IEEE Trans. Microw. Theory Tech., Vol. 60, No. 11, 3571–3581, 2012.
14. Hammi, O., S. Carichner, B. Vassilakis, and F. M. Ghannouchi, “Synergetic crest factor reduction and baseband digital predistortion for adaptive 3G Doherty power amplifier linearizer design,”
IEEE Trans. Microw. Theory Tech., Vol. 56, No. 11, 2602–2608, 2008.
15. Zhu, A., P. J. Draxler, J. J. Yan, T. J. Brazil, D. F. Kimball, and P. M. Asbeck, “Open-loop digital predistorter for RF power amplifiers using dynamic deviation reduction-based volterra series,”
IEEE Trans. Microw. Theory Tech., Vol. 56, No. 7, 1524–1534, 2008.
17. Braithwaite, R. N., “A combined approach to digital predistortion and crest factor reduction for the linearization of an RF power amplifier,” IEEE Trans. Microw. Theory Tech., Vol. 61, No. 1, 291–302, 2013.
18. Ding, L., G. T. Zhou, D. R. Morgan, Z. Ma, J. S. Kenney, J. Kim, and C. R. Giardina, “Memory polynomial predistorter based on the indirect learning architecture,” IEEE Global Telecommunications Conference, Vol. 1, 967–971, Nov. 2002.
19. Ding, L., Z. Ma, D. R. Morgan, M. Zierdt, and J. Pastalan, “A least-squares/newton method for digital predistortion of wideband signals,”IEEE Trans. Commun., Vol. 54, No. 5, 833–840, 2006. 20. Hammi, O., S. Carichner, B. Vassilakis, and F. M. Ghannouchi, “Effects of crest factor reduction
on the predistortion performance for multi-carrier 3G RF power amplifiers,” IEEE MTT-S Int. Microwave Symposium (IMS), 1085–1088, 2009.
21. Ai, B., Z. Yang, C. Pan, T. Zhang, and J. Ge, “Effects of PAPR reduction on HPA predistortion,”
IEEE Trans. Consum. Electr., Vol. 51, No. 4, 1143–1147, 2005.