DOI: 10.1534/genetics.106.057281
Design of Microarray Experiments for Genetical Genomics Studies
Ju´lio S. S. Bueno Filho,* Steven G. Gilmour
†and Guilherme J. M. Rosa
‡,1*Departamento de Cieˆncias Exatas, Universidade Federal de Lavras, Lavras, Minas Gerais 37200-000, Brazil,†School of Mathematical Sciences, Queen Mary, University of London, London E1 4NS, United Kingdom and‡Department of Animal Science and
Department of Fisheries and Wildlife, Michigan State University, East Lansing, Michigan 48824-1225 Manuscript received February 15, 2006
Accepted for publication July 19, 2006
ABSTRACT
Microarray experiments have been used recently in genetical genomics studies, as an additional tool to understand the genetic mechanisms governing variation in complex traits, such as for estimating heritabilities of mRNA transcript abundances, for mapping expression quantitative trait loci, and for inferring regulatory networks controlling gene expression. Several articles on the design of microarray experiments discuss situations in which treatment effects are assumed fixed and without any structure. In the case of two-color microarray platforms, several authors have studied reference and circular designs. Here, we discuss the optimal design of microarray experiments whose goals refer to specific genetic questions. Some examples are used to illustrate the choice of a design for comparing fixed, structured treatments, such as genotypic groups. Experiments targeting single genes or chromosomic regions (such as with transgene research) or multiple epistatic loci (such as within a selective phenotyping context) are discussed. In addition, microarray experiments in which treatments refer to families or to subjects (within family structures or complex pedigrees) are presented. In these cases treatments are more appropriately considered to be random effects, with specific covariance structures, in which the genetic goals relate to the estimation of genetic variances and the heritability of transcriptional abundances.
M
ICROARRAY technology allows the monitoring ofmessenger RNA (mRNA) abundance in cells for thousands of genes simultaneously (Schenaet al. 1995; Lockhart et al. 1996). Microarray experiments have been used extensively to provide a surrogate measure of gene activity to compare expression levels of treatment groups (within either experimental or observational contexts), such as different tissues, cell types (e.g., dis-ease and normal cell) in a specific tissue, different de-velopmental stages, or experimental conditions (e.g., different drugs or stress conditions).
The application of this technology however, especially for two-color platforms (either cDNA or long oligonu-cleotide arrays), poses some experimental design chal-lenges. As samples are assayed in a pairwise competitive hybridization fashion on each slide, microarray experi-ments using two-color systems impose a block structure with blocks of size two. Whenever more than two groups are compared, this defines an incomplete block design, in which estimated treatment effects and differences between slides are partially confounded. In addition, as each sample is labeled with a different dye on each slide, microarray experiments involve an additional blocking factor to be accounted for, which leads to a row–column, or two-way blocking, structure (slide–dye combination).
Many articles on design for two-color microarray ex-periments make some comparison of efficiency or power (Kerr and Churchill 2001; Yangand Speed 2002; Kerr2003; Rosa et al. 2005; Steibeland Rosa 2005; Tempelman 2005; Vinciottiet al. 2005) of dif-ferent designs. Most of them focus on the comparison of a discrete set of designs, such as reference and circular structures. Wit et al. (2005) present a more general approach, searching for optimal designs given specific experimental conditions and optimality criteria. It is shown that the optimal microarray design for a spe-cific optimality criterion may refer to a more complex experimental layout than simple reference or circular structures.
The objective of the experiment guides the choice of the treatment structure, whereas the definition of the experimental units leads to the blocking structure of the experiment. As discussed throughout this article, the treatment choice in microarray experiments is gen-eral for any platform (e.g., high-density short oligos, cDNA, or long oligonucleotide technologies), whereas the blocking structure depends on the microarray tech-nology, such as two-color arrays (in which slides refer to a blocking factor) or single-color arrays such as Affymet-rix (in which each sample is hybridized to a different slide). The treatment structure (as well as the number of replications) depends also on the practical/logistical constraints of the experiment, such as limited biological samples (limited either by the number of individuals to 1Corresponding author:456 Animal Sciences Bldg., 1675 Observatory Dr.,
University of Wisconsin, Madison, WI 53706. E-mail: [email protected]
be assayed or by the amount of mRNA from each in-dividual) or number of slides available. The choice of the experimental unit, which can be an individual (such as a plant or animal, hereinafter denoted as a subject) or a group of subjects (such as a family or mRNA pool), may impose some spatial or genetic structure among units, which should be taken into account when assign-ing treatments to units.
Microarray experiments have been recently used on genetical genomics studies, as an additional tool to understand the genetic mechanisms governing varia-tion in complex traits, such as disease susceptibility in human medicine or production traits in agriculture. Microarray experiments using related subjects can be utilized, for example, to infer heritabilities of mRNA transcript abundances (Monkset al. 2004). In addition, gene expression profiling can be combined with marker genotype information for mapping expression quanti-tative trait loci (eQTL; Jansen and Nap 2001; Brem
et al. 2002; Darvasi2003; Schadtet al. 2003) and to infer regulatory networks controlling gene expression (Chesleret al. 2004; Bystrykhet al. 2005).
In this article we discuss the optimal design of micro-array experiments whose goals refer to specific genetic questions, such as the comparison of expression levels of different genotypic groups, eQTL studies, or estima-tion of heritabilities of mRNA transcript abundances. This goes beyond the scope of earlier work on fixed, unstructured treatments.
The experimenters’ interest might be in specific treatment comparisons,e.g., referring to additive and dominance effects. Treatments may refer to families or to subjects (within family structures or complex pedi-grees) in a given experiment. In these cases treatments are more appropriately considered to be random ef-fects, with specific covariance structures. These covari-ance structures should then be taken into account when planning microarray experiments, so that the efficiency of broad inferences to the population of interest is maximized.
The high cost of microarrays greatly limits the sample sizes of heritability or gene-mapping studies of mRNA abundance traits ( Jinet al. 2004). Therefore, a careful design of such experiments is extremely important to make the most of the limited number of slides that are generally available in a single experiment.
This article is organized as follows. In the next section we review some experimental design concepts, such as treatment choice, treatment-to-unit allocation, design optimality criteria, and some useful methods and results on optimal designs. The third section presents genetic research goals that can motivate microarray studies with two or more treatments, such as genotypic groups. Treatments are considered fixed, but the genetic com-ponent that defines the treatments provides a natural structure (which is translated into genetic parameters of interest, such as additive and dominance effects),
which should be explored when designing the experi-ments. In the fourth section, the design of microarray experiments with random treatments is discussed. Treat-ments in this case may refer to related individuals or families, and the main goal of the experiments relates to inference on genetic variances and heritabilities. Fi-nally, some concluding remarks are presented in the last section.
DESIGN PRINCIPLES AND CRITERIA
The general statistical principles of the design of ex-periments apply to exex-periments of any kind, including microarray studies. The general procedure for choosing a good design involves the following steps (see also Bailey1981, 1997; Mead1990):
1. The objectives of the experiment lead to the choice of a set of treatments (groups to compare).
2. The experimental units (here the combination of slides and dyes) that can be used are identified and any expected patterns of variability among them lead to a choice of blocking structure (here a row–column structure).
3. Consideration of any restrictions on which treat-ments can be applied to which units might lead to complex structures such as split-plot designs. 4. Given 1–3, a combinatorial, algorithmic or ad hoc
method is found to construct a design.
The block structure is already clear and we do not dis-cuss complex structures here, so the two main tasks in developing a design are treatment choice and treatment-to-unit allocation.
to the variances of the estimated parameters of the model. Then we must find a method of searching for a design that optimizes the criterion, e.g., using the optimal continuous (approximate) design theory de-veloped from Kieferand Wolfowitz(1960) or a com-puter algorithm that searches for the optimal exact design, such as those developed from Fedorov(1972). As stated earlier, the treatment choice in microarray experiments is independent of the array platform, so the same procedure can be used for single- or two-color technologies.
Treatment-to-unit allocation:A given set of treatments (and their respective replication numbers) should be combined in an optimal way within a given experi-mental setup. In the context of two-color microarray experiments, for example, this setup is given by the number of slides and the two labels (Cy3 and Cy5 dyes). Again, construction of the design might require optimal design theory, this time most likely using a computer search.
The treatment-to-unit allocation applications dis-cussed in this article are specific to two-color array plat-forms (cDNA or long oligos), in which samples should be allocated in pairs to the slides (blocks). With single-color microarrays (such as Affymetrix), on the other hand, each sample is hybridized to a different slide, so this is not an issue and allocation should be done completely at random.
Linear mixed models for microarray experiments:
The outcomes of a microarray experiment are luminous intensities of thousands of genes, which are propor-tional to their mRNA transcrippropor-tional abundances. After suitable normalization, the response intensities from gene g in a two-color microarray experiment can be represented by the model
ygijk¼mg1dgi1agj1tgk1egij; ð1Þ
(Wolfinger et al. 2001), whereygijk is the normalized intensity of the gene expression measured by the dye (label)iof the array jthat received treatmentk,mg is a common experimental constant,dgiis the effect of dye i(green or red),agj is the effect of array (or slide)j,tgk is the effect of the treatment k, and egij is a residual term. We consider a single gene at a time for design purposes, as the same model is generally used to analyze all genes in a single experiment, and so the subscript g is dropped. Different experimental layouts may need extra terms in the model for the appropriate modeling of the data. With Affymetrix data, for example, there is no dye effect in the model, but a hierarchical structure could be used to model intensities at the probe level, by including the effects of probe sets (clones) and of probe pairs within clones. Model choice should then be closely connected to treatment and block structures of the experiments (Rosaet al. 2005).
As additional assumptions of model (1), residual terms can be modeled as being normally distributed
with variance s2
e; likewise, as arrays come from a pop-ulation of possible assembled arrays, their effects can be modeled as random normal variables centered around zero, with variance s2
a. The term ‘‘treatment’’ here is used in a very broad context, representing either experi-mental groups (such as genotypic classes) or families (and subjects within families) in quantitative genetics studies to estimate heritabilities. Therefore, treatment effects can be modeled as fixed or random, depending on the objective of the experiment.
The usual matrix notation for linear mixed models such as model (1) is
y¼Xb1Zu1e; ð2Þ
where y and e are vectors with elements yijk and eij, respectively,bis the vector of fixed effects,Xis a known (design) matrix that relates y to b, u is the vector of random effects, andZis the matrix that relatesytou. An extra assumption is that uNð0;UÞ, where U is the covariance matrix of the random effects.
Note that the treatment effects can be taken as being either fixed or random and so they can be contained in eitherboru, depending on the experimental context. In the examples discussed in this article, whenever treatment effects are considered random, they are as-sumed normally distributed; i.e.,tNð0;Gs2
tÞ, where
Gis a matrix of known constants representing, for ex-ample, genetic relationships among the elements in t
(such as a numerator relationship matrixA; Henderson 1976), ands2
t is the variance among treatments, such as an additive genetic variance.
Design criteria: The covariance matrix of the param-eter estimates for model (2) is the inverse of the in-formation matrixM, where
M} X9X Z9X
X9Z Z9Z1s2eU1
:
Almost any sensible criterion defining design efficiency is a function of the information matrixM.
chose the design; if their ratio turns out to be small, then the interblock information will give us estimates of treatment effects better than expected when we chose the design.
In this context, Kerrand Churchill(2001) used the so-called A-optimality criterion to compare block de-signs for microarray studies with simple treatment structures, and Yangand Speed (2002) discussed the efficiency of alternative designs for specific contrasts of interest in factorial and time course experiments. Kerr (2003) later argued in favor of double reference designs as being suboptimal but more robust when compared to loop designs. Glonek and Solomon (2004) studied some alternative designs for factorial treatment struc-tures. More general work on two-level factorial designs in blocks of size two, which has some relevance, has been
done by Draper and Guttman (1997), Yang and
Draper(2003), Wang(2004), and Kerr(2006). Similar sorts of experiments are now being used for understanding the genetic basis of mRNA transcript abundances, with a variety of experimental settings. For example, fixed treatment effect models arise in genetic analysis when comparing multilocus genotypic groups, including interaction (epistasis) terms. In addition, random treatment effect models may be used in quan-titative genetics to infer genetic variances and heritabil-ities. No work, however, has been published on optimal design for microarray experiments in situations where the treatments have any of these structures.
In each of the following sections we present different experiments and discuss possible parameter contrasts of interest, as well as the variances of their estimates, sometimes weighted to correct for scale problems. In each situation, alternative optimality criteria are dis-cussed. We assume that all power comparisons have a monotonic (inverse) relation with the variances of the desired comparisons and describe treatment structures in microarray experiments for some common goals in genetic studies. The resulting designs are depicted by a set of arrows representing the slides, with heads and tails denoting alternative dye labeling (Cy3 and Cy5). Arrows (slides) refer always to different biological replications from each experimental group, unless otherwise stated.
GENETIC STUDIES WITH FIXED TREATMENT EFFECTS
Two treatment groups in microarray experiments:
Genetic motivation: One of the simplest scenarios that results in two-treatment experiments arises with a single candidate gene (with alleles B and b) and a backcross (BC) or double-haploid (DH) experiment. In these cir-cumstances, individuals belong to one of two possible genotypic groups, namely Bb or bb if in a BC experi-ment and BB or bb if in a DH scenario. In both situations one is interested in the additive effectðaÞof the candidate gene on the expression of each gene
represented in the microarray slide,i.e., how polymor-phisms at a specific site of the genome affect transcrip-tion activity of other genes in the genome. Such effects are generally referred to astrans-acting factors ( Jansen and Nap2001).
The model (1) for such a simple treatment structure can be written withtk¼qka. For the BC situation,qkis a design index on genotypes assuming valuesq1¼0 (for genotype bb) andq2 ¼1 (for genotype Bb). In this sit-uation, one wants to estimatea¼t2t1 and the vari-ance of this contrast is given by Varð^t1^t2Þ ¼Varð^t1Þ1
Varð^t2Þ 2 Covð^t1;^t2Þ. For the DH situation,q1 ¼0 (for genotype bb) and q2 ¼2 (for genotype BB). In this situation, one wants to estimatea¼1
2ðt2t1Þ, and the
variance of this comparison is given by one-quarter of the right-hand side of the above variance. As these two variances are proportional, the same optimal design minimizes both of them.
In a microarray experiment, such a simple two-treatment group situation can arise within a selective phenotyping approach based on a single locus (or small chromosomic region), as proposed by Jinet al. (2004), or within a candidate gene context in which one is interested in the effect of a specific locus (e.g., trans-gene) on the expression of other genes in the genome (see, for example, Noueiryet al. 2000).
Another example is to define two experimental groups by taking the extremes of the phenotypic distribution of a quantitative trait of interest (Lander and Botstein 1989). By comparing the allelic frequencies of molecu-lar markers between the two groups, candidate regions containing genes contributing to variation of the phe-notypic trait can be pinpointed. In the context of mi-croarrays, candidate genes are generated by searching for differential transcript abundances between the two groups. In any situation, the proportions of the selected individuals should be made small enough so that the two phenotypic groups are quite distinct (Darvasiand Soller1992).
Microarray experiments with two experimental groups define row–column designs obtained from multiple copies of a 232 Latin square (in the case of two-color systems), for which extensive literature is available.
Three treatment groups in microarray experiments:
Genetic motivation: In some situations there are three possible genotypes in a segregating population, for ex-ample, with F2 populations and codominant markers. The genotypes for each marker can then be described by an additive–dominance model. Here we discuss the case of a single locus (such as a candidate gene sit-uation) and itstrans-acting effect on the expression of other genes. The case of multiple loci is discussed later in this article, with factorial and fractional factorial treatment structures.
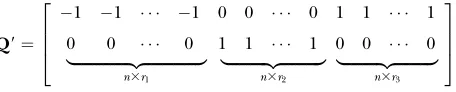
for genotypes bb, Bb, and BB, respectively. Denote by rkthe proportion of the nobservations that represent each genotypic group (k¼1, 2, 3). The model can be rewritten asy¼m1n311QðadÞ1e, where1n31is a
col-umn vector of ones and Q gives the incidences of
genotypes bb, Bb, and BB as
Q9¼
1 1 1 0 0 0 1 1 1
0 0 0 1 1 1 0 0 0
|fflfflfflfflfflfflfflfflfflfflfflfflfflfflffl{zfflfflfflfflfflfflfflfflfflfflfflfflfflfflffl} n3r1
|fflfflfflfflfflfflfflfflfflfflffl{zfflfflfflfflfflfflfflfflfflfflffl} n3r2
|fflfflfflfflfflfflfflfflfflffl{zfflfflfflfflfflfflfflfflfflffl} n3r3
2 6 6 4
3 7 7 5:
Both parameters can be optimally estimated using the same proportion for each homozygous genotype (bb and BB), in which caser1¼r3¼randr2¼12r. The information matrix is then given by
M¼
1 0 12r
0 2r 0
12r 0 12r
2 4
3 5n
s2 e
and the covariance matrix is
M1¼
1
2r 0
1 2r
0 21r 0
1
2r 0
1 2rð2r1Þ 2
6 4
3 7 5s
2 e n:
Figure 1 plots changes in the variances of the pa-rameter estimates with the proportion (r) of each homozygous group. If one is interested solely in the (trans-acting) additive effects, just homozygotes should be considered in the design. To estimate (trans-acting)
dominance only, half of the observations should be taken from the heterozygotes and one-quarter from each of the homozygotes. To estimate additive and dom-inance effects simultaneously, it is necessary to define an optimality criterion. Throughout this article, we use the A-efficiency on this scale,i.e., the mean of the variances of the estimates, but in any real experiment careful thought should be given to whether a weighted mean of the variances would be a more appropriate criterion. The A-optimal proportion of each homozygote is the irrational numberropt¼1
ffiffiffi
2
p
=2. As no possible num-ber of arrays satisfies this optimum exactly, an approx-imation is needed. It is reasonable to use 0.293 of the observations for each homozygote and the remain-ing 0.414 of the observations for the heterozygote group.
Suppose, for example, that we are interested in the best design that can be made with only 10 slides using a two-color microarray platform. We proceed as follows. To estimate just additive effects, each homozygous genotype (BB or bb) will have 10 replications. The het-erozygote group, in this case, is not included in the experiment. To estimate only dominance effects there will be 5 replications of each homozygous genotype and 10 replications of the heterozygote group. Finally, for estimation of both additive and dominance effects, the A-optimal design has 6 replications for each homozygote and the remaining 8 replications for the heterozygote.
experiment is the treatment-to-unit allocation,i.e., de-scribing which treatment should be applied to each unit, when array and color effects are in the model. The optimal design for estimating just additive effects with 10 slides is shown in Figure 2A, in which all slides have the two homozygous genotypes only, with alternating directions of the Cy3 and Cy5 labeling. If one is con-cerned with estimating dominant effects, all of the slides should have one of the homozygous genotypes cohybridized with the heterozygous genotype, as shown in Figure 2B. Finally, if both additive and dominance effects are to be estimated, combinations of the two
types of slide should be used (Figure 2C). It is worth mentioning that the designs of Figure 2, A–C, are, respectively,100, 50, and 9% more efficient than the classical loop structure. When compared to the refer-ence design, their relative efficiencies are 6.6, 4.7, and 3.4, respectively.
Generalization of these results for multiple loci:
The effect of multiple candidate genes on the overall genome transcriptional activity can be investigated at once in a single microarray study. With simple line-crossing experiments, each gene (locus) may have ei-ther two or three levels (possible genotypes), depending on the mating system used (BC or DH and F2, re-spectively). Therefore, the treatment structure forLloci is a factorial of the series 2Lor 3Lfor two or three possible
genotypes in each locus, respectively. A suitable model for the expression of the treatments in such a system, including epistasis, is given by
tk1k2;...;kL¼
XL
l¼1
qklal1
XL
l¼1
ð1jqkljÞdl1
X L1
l¼1
XL
l9.l
qklqkl9aall9
1X
L1
l¼1
XL
l9.l
qklð1jqkl9jÞadll91
X L1
l¼1
XL
l9.l
ð1jqkljÞqkl9dall9
1X
L1
l¼1
XL
l9.l
ð1jqkljÞð1jqkl9jÞddll9:
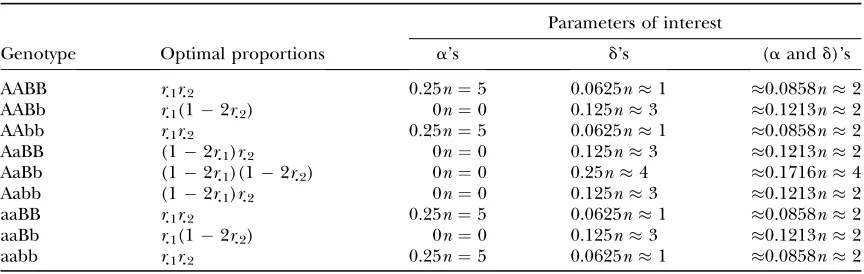
If necessary, higher-order interloci interactions (ad-ditional epistatic effects) can also be included in the model. A parsimonious version of this model can be ob-tained by reducing the order of the estimable epistatic effects. For example, in a situation with two loci with three possible genotypes each, only five parameters would be needed to model phenotypes (i.e., transcrip-tional profiling) from the nine possible genotypes if no epistasis is to be estimated.
A matrix representation of a two-locus version (alleles A/a and B/b, respectively) without epistasis is given by
y¼m1n311Q1 a1 d1
1Q2 a2
d2
1e;
where Ql ðl ¼1;2Þ is a representation of the design matrix for each locus. If total sampling control of the population of genotypes is possible, equal representa-tion of each homozygote genotype for each locus could be considered. Letrjlrepresent the proportion of geno-type jfor locusl. In this case, assuming equal propor-tions of homozygotes within each locus, we haver11¼
r31¼r
:1
andr12¼r32¼r:2
. Table 1 presents the num-ber of observations for each genotype and the expected phenotypic values.The information matrix for this model is given by
M¼n
s2 e
1 0 12r:1 0 12r:2
0 2r:1 0 0 0
12r:1 0 12r:1 0 ð12r:1Þð12r:2Þ
0 0 0 2r:2 0
12r:2 0 ð12r:1Þð12r:2Þ 0 12r:2
2 6 6 6 6 6 4
3 7 7 7 7 7 5
and so the covariance matrix of the estimated model parameters is
M1¼s
2 e n
r:11r:22r:1r:2
2r:1r:2 0
1
2r:1 0
1 2r:2
0 1
2r:1 0 0 0
1
2r:1 0
1
2r:1ð2r:11Þ 0 0
0 0 0 1
2r:2 0
1
2r:2 0 0 0
1 2r:2ð2r:21Þ 2
6 6 6 6 6 6 6 6 4
3 7 7 7 7 7 7 7 7 5
:
The optimal designs for this situation are a straight-forward extension of the optimal proportions for each genotype:r
:
l¼12,r:
l¼14, and r:
l¼1ffiffiffi
2
p
=2, if one is interested in estimating additive, dominance, or both effects for each locusl, respectively.
As an example, Table 2 gives the optimal number of replications of each genotype in a two-locus experiment with 10 slides. For estimating additive effects only, the treatments compose a 22factorial set, equally replicated.
For estimating dominance or both additive and domi-nance effects, the treatments correspond to 32factorial
designs with different replications in the two cases. It
can be seen that the design obtained by continuous techniques can be directly implemented only for ad-ditive effects; in the other two situations an approxima-tion is needed. For dominant effects, the continuous optimal design gives 0.0625320¼1.25 and 0.01253
20 ¼ 2.5, which were approximated by 1 and 3, re-spectively. This reflects a decrease in the relative im-portance of homozygote combinations as compared to values for the optimal large sample design. On the other hand, the genotype AaBb has only four replicates (in-stead of 0.25320¼5). This specific treatment choice does not allow a straightforward application of the con-tinuous optimal design theory and the design chosen might not actually be optimal. The same problem hap-pens when estimating both additive and dominant effects: either the approximation of 0.0858 3 20 ¼
1.7162 or the truncation of 0.1213320¼2.4262 forces the final treatment choice away from the large-sample optimal genotype proportions.
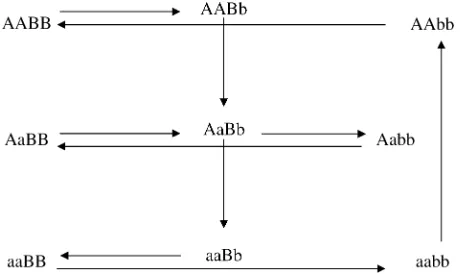
After the treatment choice is performed, the design of the experiment is completed with the treatment-to-unit allocation step. Optimal two-color microarray de-signs (with 10 slides) for inferring additive, dominance, or both effects are shown in Figure 3. Similarly to the situation with a single locus, a clear pattern of allowing only the important contrasts within each slide arises from these pictures as well. It can be seen that all the comparisons for estimating additive effects are done among homozygotes for each locus. For estimating dom-inance effects, all slides bring a comparison of a homo-zygous with the heterohomo-zygous genotype, for both loci. Moreover, for the simultaneous estimation of additive and dominance effects, the two types of comparison are needed. The relative efficiencies of the designs of Figure 3, A–C, are, respectively, 1.5, 2.9, and 2.1 when com-pared with the loop design and5.1 compared with the reference design.
Note that these designs are still optimal for estimating thea- andd-effects for one locus (say for gene A/a) even if the other locus considered (say B/b) has no effect at
TABLE 1
Expected phenotypic value and number of observations for each genotype in a two-locus experiment with
an F2population
Genotype Expected phenotypic value No. of observations
AABB m1a11a2 r.1r.2n AABb m1a11d2 r.1(12r.2)n
AAbb m1a1a2 r.1r.2n
AaBB m1d11a2 (12r.1)r.2n AaBb m1d11d2 (12r.1)(12r.2)n Aabb m1d1a2 (12r.1)r.2n
aaBB ma11a2 r.1r.2n
aaBb ma11d2 r.1(12r.2)n
aabb ma1a2 r.1r.2n
TABLE 2
Optimal number of replications of each genotype in a two-locus experiment with no epistasis, using 20 experimental units
Parameters of interest
Genotype Optimal proportions a’s d’s (aandd)’s
AABB r.1r.2 0.25n¼5 0.0625n1 0.0858n2
AABb r.1(12r.2) 0n¼0 0.125n3 0.1213n2
AAbb r.1r.2 0.25n¼5 0.0625n1 0.0858n2
AaBB (12r.1)r.2 0n¼0 0.125n3 0.1213n2
AaBb (12r.1)(12r.2) 0n¼0 0.25n4 0.1716n4
Aabb (12r.1)r.2 0n¼0 0.125n3 0.1213n2
aaBB r.1r.2 0.25n¼5 0.0625n1 0.0858n2
aaBb r.1(12r.2) 0n¼0 0.125n3 0.1213n2
all! Similar conclusions can be generalized to situations with more than two loci and larger numbers of slides.
It is interesting to note how different the designs of Figure 3, which explore a natural structure on treat-ment groups, are from the optimal designs for two-color microarray experiments involving unstructured treat-ments, which tend toward symmetry whenever possible. For example, Figure 4 depicts two experiments, one involving four treatments and 10 slides (Figure 4A) and the other with nine treatments and 9 slides (Figure 4B). The experiment with nine treatments is an example of the so-called loop (or circular) design commonly found
in the literature, whereas the experiment with four treatments consists of two loops with reverse-dye label-ing plus two additional interwoven connections.
Multiple loci with epistatic effects: Suppose that in this situation (two loci with three genotypes each and 10 slides of a two-color microarray system), we would like also to estimatetrans-acting epistasis (i.e., how the joint effect of two loci changes the expression of other genes in the genome) with the following model:
tk1k2;...;kL¼qk1a11qk2a21ð1 jqk1jÞd11ð1 jqk2jÞd2
1qk1qk2aa121qk1ð1 jqk2jÞad121ð1 jqk1jÞqk2da12 1ð1 jqk1jÞð1 jqk2jÞdd12:
In selecting an optimal design, careful thought must be given to which classes of designs are considered as candidates. In this situation, it is reasonable to insist on choosing a treatment set that is symmetrical with respect to the two gene loci, i.e., that is genewise balanced. The best genewise balanced design is given in Figure 5. Note that in all slides one locus has its genotype repeated while the other varies. This allows us to infer each genomic expression and interaction independently but at the expense of decreasing precision for the main effects parameters previously of interest (additive and dominance effects).
Figure3.—Optimal designs for estimatingtrans-acting ad-ditive effects (A), dominance effects (B), and both adad-ditive and dominant effects (C) of two nonepistatic genes, with 10 slides in a two-color microarray experiment. Dashed arrows connect the homozygous genotypes in the corners.
GENETIC STUDIES WITH RANDOM TREATMENT EFFECTS
Multiple-treatment microarray experiments: Apart from those situations in which 2L or 3L factorials arise
from targetingLgenes, there are other genetic objec-tives that need many treatments. One common goal in genetic studies is to obtain good estimates of genetic var-iances and heritabilities. Within a genetical genomics context this means studying the heritability of the mRNA abundance of thousands of genes, having only a sample ofnsubjects (with a specific relationship struc-ture among them) to look at.
In genetic models with random treatments, the treat-ment effects are often the subject effects. This is the case, for example, with the so-called animal models (Lynchand Walsh1998), which have been extensively used in animal breeding and more recently in plant breeding (mainly in forestry). For a comprehensive pre-sentation of modern analytical techniques for such models refer to Sorensenand Gianola(2002).
For these situations we have the problem of finding good designs to obtain estimates using the best linear unbiased predictors of breeding values, given a known pedigree or family structure. The best designs are very specific for each pedigree and estimation objective, as discussed below.
Design criterion:BuenoFilhoand Gilmour(2003) argued that a suitable criterion for selecting among related treatments can be obtained as a weighted average of the variances of all pairwise contrasts. This criterion has a broad relevance and estimating genetic variance components and heritabilities is one of the possible goals. In the following examples we apply this criterion to two small experimental situations to illus-trate some features of optimal designs. In Table 3, two situations are presented, involving nine animals com-ing from either a hierarchical or a factorial matcom-ing system.
These two different pedigrees result in the additive (numerator) relationship matrices
Ah¼
1 0:25 0:25 0 0 0 0 0 0
0:25 1 0:25 0 0 0 0 0 0
0:25 0:25 1 0 0 0 0 0 0
0 0 0 1 0:25 0:25 0 0 0
0 0 0 0:25 1 0:25 0 0 0
0 0 0 0:25 0:25 1 0 0 0
0 0 0 0 0 0 1 0:25 0:25
0 0 0 0 0 0 0:25 1 0:25
0 0 0 0 0 0 0:25 0:25 1
2 6 6 6 6 6 6 6 6 6 6 6 6 4 3 7 7 7 7 7 7 7 7 7 7 7 7 5 and
Af¼
1 0:25 0:25 0:25 0 0 0:25 0 0 0:25 1 0:25 0 0:25 0 0 0:25 0 0:25 0:25 1 0 0 0:25 0 0 0:25 0:25 0 0 1 0:25 0:25 0:25 0 0
0 0:25 0 0:25 1 0:25 0 0:25 0 0 0 0:25 0:25 0:25 1 0 0 0:25 0:25 0 0 0:25 0 0 1 0:25 0:25 0 0:25 0 0 0:25 0 0:25 1 0:25 0 0 0:25 0 0 0:25 0:25 0:25 1 2 6 6 6 6 6 6 6 6 6 6 6 6 4 3 7 7 7 7 7 7 7 7 7 7 7 7 5
(Lynchand Walsh 1998), where the indices h and f refer to the hierarchical and factorial mating systems, respectively.
Restricting our discussion to the estimation of addi-tive variance components, it can be seen that in such cases we need to find both the best replication for each treatment and the best treatment-to-unit allocation. It is worth noting that in this case ‘‘treatments and rep-lications’’ can refer either to families and sibs within families or to biological individuals and technical samples from the same individual.
As an illustration, consider two replications of each treatment (individual). For this kind of group-divisible treatment set, it is suggested (Bueno Filho and Gilmour2003) that the best designs are in the class of regular graph designs (e.g., loop designs), but the allo-cation of treatments to treatment labels is important. The best design is one that avoids relatives (in this case, paternal or maternal half-sibs) in the same array, as much as possible. Therefore, the resulting optimal de-signs are more restrictive for the factorial than for the Figure5.—Optimal design for estimatingtrans-acting
ep-istatic effects between two genes, with 10 slides in a two-color microarray experiment.
TABLE 3
Examples of hierarchical and factorial mating systems with nine progeny
Hierarchical Factorial
Progeny Dam Sire Dam Sire
1 1 1 1 1
2 2 1 2 1
3 3 1 3 1
4 4 2 1 2
5 5 2 2 2
6 6 2 3 2
7 7 3 1 3
8 8 3 2 3
hierarchical setup. In Figure 6 optimal designs for these two situations are depicted.
More complex situations can be found in practice, in which larger numbers of individuals can be considered and some other important measures can be taken. Lynchand Walsh(1998) discuss simple pedigrees in which analytical results are possible and suggest the best number of families and individuals within families to use in the experiment. For more complex pedigrees, however, a general search algorithm should be utilized, as sometimes it is the only way to get a useful design. The algorithm we have used is a simple modification of the exchange algorithm of Fedorov(1972). This has the following general form:
1. List the possible candidate treatments.
2. Choose a random set ofntreatments, which becomes thecurrentdesign.
3. If the current design does not allow the model to be fitted, return to step 2.
4. Systematically exchange each treatment in the cur-rent design with each (diffecur-rent) treatment in the candidate set. Accept any exchanges that improve the criterion to get a new current design, continuing until no exchange improves the design.
5. When no improvement is possible, the current design becomes the final design returned by the algorithm.
It is common practice to restart the algorithm with several random starting designs and to choose the best design found overall.
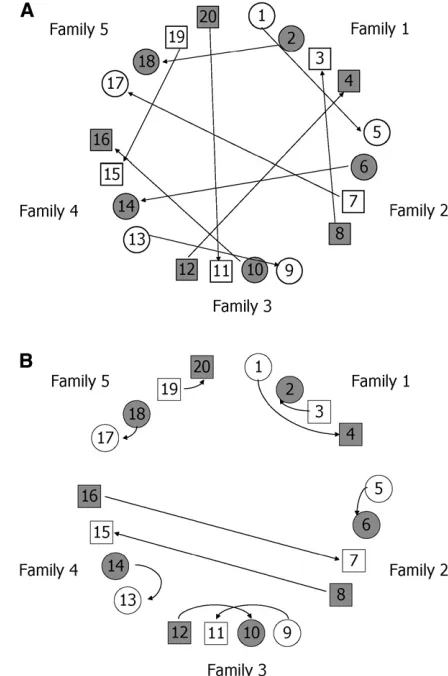
As an illustration, consider a treatment choice prob-lem with a microarray experiment with a limited num-ber of slides, for which a subset of 40 subjects needs to be chosen among a population of 80 animals with the pedigree given in Figure 7. An R function was developed to search for optimal designs when treatment effects are random, with any covariance structure among them (i.e., any pedigree setup), such as in this situation. The treatments (animals) selected in the resulting design are indicated by solid circles in Figure 7. Such a design is good only for this very specific situation and it is not possible to produce deep generalizations. The only clear message with messy pedigrees is that a search algorithm may be the only way to reach a good (if not optimal) design for these experiments.
In another very common situation in animal exper-imentation, related individuals are subjected to differ-ent experimdiffer-ental procedures (such as differdiffer-ent diets, drugs, etc.). In these circumstances both random and fixed treatment effects are present in the experiment. Such experiments may have multiple objectives and variance component (or heritability) estimation can be one of them. One should be aware, however, that Figure 6.—Optimal design for a microarray experiment
with nine treatments, having random effects, representing nine progenies from hierarchical (A) and factorial (B) mating systems (Table 3). (A) Different circle shadings refer to differ-ent paternal half-sibs. (B) Each shape and shading denote a different dam and sire, respectively. In both cases, each geo-metric figure represents a subject (biological replication), which is assayed in two slides each (technical replication).
designs that are optimal for some of these objectives might not be so for others. An example of such a sit-uation is given in Table 4. The experiment consists of 20 pigs from five full-sib families of size four, to be arrayed on a limited set of 10 two-color system slides. The four individuals in each family (litter) refer to two male and two female sibs that were selected at random. One ani-mal from each sex was submitted to one of two experi-mental treatments (placebo and drug). Two different objectives of the study were considered: (a) estimation of heritability and (b) estimation of the fixed effects of drug and sex, as well as the interaction between them. Optimal designs for each of these situations for a spe-cific configuration of variance components are pre-sented in Figure 8.
It can be seen that in the first situation (estimation of heritability) the search algorithm converged to a design in which all slides connected individuals from different sibs. Also, all slides have individuals of the same sex and/or same experimental group (placebo or drug). Conversely, if the experiment goal is to infer the ef-fects of sex, drug, and their interaction, the genetic covariance among sibs becomes another blocking fac-tor, which the search algorithm tended to confound or combine with the blocking effect of arrays. In this case, the slides now tend to assay genetically related individ-uals. As expected, to infer the main effects of drug and sex, some of the slides compare individuals of the same sex, but different experimental groups (such as those of family 5), while others compare individuals of the same
group, but different sex (such as those of family 3). In addition, a third set of slides compares individuals of different sex and experimental groups (e.g., family 1) to infer the interaction between sex and drug effects.
CONCLUDING REMARKS
This article discusses the design of microarray experi-ments whose goals refer to a variety of genetic questions, such as the comparison of expression levels of different genotypic groups, eQTL studies, or estimation of heri-tabilities of mRNA transcript abundances.
The general approach adopted for choosing a good design consists of a first step oftreatment choice, in which subjects (as well as their experimental group labels) are selected to be included in the experiment. This first step is general and common to any microarray experiment, regardless of platform. In the case of two-color micro-array systems, however, the design choice is followed by treatment-to-unit allocation, in which mRNA samples are assigned in an optimal way to slides and dye labeling.
Figure8.—Optimal designs for the estimation of heritabil-ity (A) and fixed effects of drug and sex and their interaction (B), in a two-color microarray experiment with five full-sib swine families of two males (squares) and two females (cles), submitted either to a placebo (open squares and cir-cles) or to a drug treatment (shaded squares and circir-cles).
TABLE 4
Litter, treatment (drug), and sex of 20 piglets available for microarray experiments for inferring the effects
of sex, drug, and the interaction between sex and drug, as well as the heritability
Progeny Litter Drug Sex
1 1 Yes F
2 1 Yes M
3 1 No F
4 1 No M
5 2 Yes F
6 2 Yes M
7 2 No F
8 2 No M
9 3 Yes F
10 3 Yes M
11 3 No F
12 3 No M
13 4 Yes F
14 4 Yes M
15 4 No F
16 4 No M
17 5 Yes F
18 5 Yes M
19 5 No F
It has been shown how the design choice should be intimately related to the goal of the experiment, such as the contrast between fixed effects (e.g., the comparison of alternative drugs or the expected phenotypic value of different genotypes), or inference regarding variance components (such as genetic variances), or heritability of transcriptional levels.
Sometimes it is possible to have an analytical solution for the optimality problem, but in many situations a numerical solution is needed. Whenever a numerical solution is implemented, a complete search (comparing all possible designs) guarantees the optimal finding. A complete search, however, is often unattainable due to the size of the search problem involved. In these si-tuations algorithms are needed that can find optimal or near-optimal designs. R functions were developed for searching and comparing the different designs discussed in this article; they can be obtained directly from the authors.
As a final remark, it is important to note that this article considers a single gene at a time for design pur-poses, as the same model is generally used to analyze all genes in a single experiment. This is not an issue for fixed-effects models (such as for the examples compar-ing genotypic groups) as the optimal design criteria for fixed-effects models depend only on the design matrix. This is not true in mixed- or random-effects models, as in these cases optimal designs depend on both the design matrix and the variance components parame-ters. Since the variance parameters vary among genes, the optimal design for one gene may be different from that for another gene. As a consequence, caution is needed before we simplify the optimal design for the microarray to an optimal design for a single gene if random- or mixed-effects models are considered.
This is a very interesting topic, which deserves further research. A possible approach to this issue would be to use an empirical distribution for the genetic variances or heritabilities to weight the decision function that yields the design criterion. Alternatively, ‘‘robust’’ de-signs could be sought by focusing on the high herita-bility genes. This could be achieved by putting more weight on the higher heritabilities than suggested by an empirical distribution or by even ignoring the region of low heritability when searching for good designs. An extreme version of this approach would be by taking genetic effects as fixed, but in general this would be an inefficient strategy. Moreover, while modeling genetic effects as fixed may be simple with experiments in-volving family structures such as half- or full-sibs, it is not clear how this approach could be easily extended for complex pedigrees.
This work was supported by the Michigan State University Intra-mural Research Grant Program, by grant 2004-33120-15204 from the United States Department of Agriculture to G.J.M.R., and by grant 474787/2004-4 from the Conselho Nacional de Desenvolvimento Cientı´fico e Tecnolo´gico-Brazil to J.S.S.B.F.
LITERATURE CITED
Bailey, R. A., 1981 A unified approach to design of experiments. J. R. Stat. Soc. A144:214–223.
Bailey, R. A., 1997 Statistics and mathematics: the appropriate use of mathematics within statistics (with discussion). Statistician47:
261–271, 273–290.
Brem, R. B., G. Yvert, R. Clintonand L. Kruglyak, 2002 Genetic dissection of transcriptional regulation in budding yeast. Science
296:752–755.
BuenoFilho, J. S. S., and S. G. Gilmour, 2003 Planning incomplete block experiments when treatments are genetically related. Biometrics59:375–381.
Bystrykh, L., E. Weersing, B. Dontje, S. Sutton, M. T. Pletcher
et al., 2005 Uncovering regulatory pathways affecting hemato-poietic stem cell function using ‘‘genetical genomics.’’ Nat. Genet.37:225–232.
Chesler, E. J., L. Lu, J. Wang, R. W. Williamsand K. F. Manly, 2004 WebQTL: rapid exploratory analysis of gene expression and genetic networks for brain and behavior. Nat. Neurosci.7:
485–486.
Darvasi, A., 2003 Gene expression meets genetics. Nature422:269– 271.
Darvasi, A., and M. Soller, 1992 Selective genotyping for determi-nation of linkage between a marker locus and a quantitative trait locus. Theor. Appl. Genet.85:353–359.
Draper, N. R., and I. Guttman, 1997 Two-level factorial and frac-tional factorial designs in blocks of size two. J. Qual. Technol.
29:71–75.
Fedorov, V. V., 1972 Theory of Optimal Experiments. Academic Press, New York.
Glonek, G. F. V., and P. J. Solomon, 2004 Factorial and time course designs for cDNA microarray experiments. Biostatistics 5: 89– 111.
Henderson, C. R., 1976 Simple method for computing inverse of a numerator relationship matrix used in prediction of breeding values. Biometrics32:69–83.
Jansen, R. C., and J. Nap, 2001 Genetical genomics: the added value from segregation. Trends Genet.17:388–391.
Jin, C., H. Lan, A. D. Attie, G. A. Churchill, D. Bulutogluet al., 2004 Selective phenotyping for increased efficiency in genetic mapping studies. Genetics168:2285–2293.
Kerr, M. K., 2003 Design considerations for efficient and effective microarray studies. Biometrics59:822–828.
Kerr, M. K., 2006 2^k factorials in blocks of size 2, with application to two-color microarray experiments. UW Biostatistics Working Paper Series No. 227 (http://www.bepress.com/uwbiostat/paper227). Kerr, M. K., and G. A. Churchill, 2001 Statistical design and the
analysis of gene expression microarray data. Genet. Res.77:123– 128.
Kiefer, J. C., and J. Wolfowitz, 1960 The equivalence of two extre-mum problems. Can. J. Math.12:363–366.
Lander, E. S, and D. Botstein, 1989 Mapping Mendelian factors underlying quantitative traits using RFLP linkage maps. Genetics
121:185–199.
Lockhart, D. J., H. L. Dong, M. C. Byrne, M. T. Follettie, M. V. Galloet al., 1996 Expression monitoring by hybridization to high-density oligonucleotide arrays. Nat. Biotech. 14: 1675– 1680.
Lynch, M., and B. Walsh, 1998 Genetics and Analysis of Quantitative
Traits. Sinauer, Sunderland, MA.
Mead, R., 1990 The nonorthogonal design of experiments (with dis-cussion). J. R. Stat. Soc. A153:151–201.
Monks, S. A., A. Leonardson, H. Zhu, P. Cundiff, P. Pietrusiak
et al., 2004 Genetic inheritance of gene expression in human cell lines. Am. J. Hum. Genet.75:1094–1105.
Noueiry, A. O., J. Chenand P. Ahlquist, 2000 A mutant allele of essential, general translation initiation factorDED1selectively in-hibits translation of a viral mRNA. Proc. Natl. Acad. Sci. USA97:
12985–12990.
Rosa, G. J. M., J. P. Steibeland R. J. Tempelman, 2005 Reassessing design and analysis of two-color microarray experiments using mixed effects models. Comp. Funct. Genomics6:123–131. Schadt, E. E., S. A. Monks, T. A. Drake, A. J. Lusis, N. Cheet al.,
Schena, M., D. Shalon, R. W. Davisand P. O. Brown, 1995 Quan-titative monitoring of gene-expression patterns with a comple-mentary-DNA microarray. Science270:467–470.
Sorensen, D., and D. Gianola, 2002 Likelihood, Bayesian, and MCMC
Methods in Quantitative Genetics. Springer, New York.
Steibel, J. P., and G. J. M. Rosa, 2005 On reference designs for mi-croarray experiments. Stat. Appl. Gen. Mol. Biol.4(1): Article 36 (http://www.bepress.com/sagmb/vol4/issl/art36/).
Tempelman, R. J., 2005 Assessing statistical precision, power, and ro-bustness of alternative experimental designs for two color micro-array platforms based on mixed effects models. Vet. Immunol. Immunopathol.105:175–186.
Vinciotti, V., R. Khanin, D. D’Alimonte, X. Liu, N. Cattiniet al., 2005 An experimental evaluation of a loop versus a reference design for two-channel microarrays. Bioinformatics21:492–501.
Wang, P. C., 2004 Designing two-level fractional factorial experi-ments in blocks of size two. Sankhya66:327–342.
Wit, E., A. Nobileand R. Khanin, 2005 Near-optimal designs for dual channel microarray studies. Appl. Stat.54:817–830. Wolfinger, R. D., G. Gibson, E. D. Wolfinger, L. Bennett,
H. Hamadeh et al., 2001 Assessing gene significance from cDNA microarray expression data via mixed models. J. Comp. Biol.8:625–637.
Yang, Y. H., and T. Speed, 2002 Design issues for cDNA microarray experiments. Nat. Rev. Genet.3:570–588.
Yang, Y. J., and N. R. Draper, 2003 Two-level factorial and fractional factorial designs in blocks of size two. J. Qual. Technol.35:294– 305.