Transactions of the 17th International Conference on Structural Mechanics in Reactor Technology (SMiRT 17) Prague, Czech Republic, August 17 –22, 2003
Paper # G07-3
Optimum Local Failure Model of Cracked Steam Generator Tubes with
Multiple Axial Through-Wall Cracks
Seong In Moon1), Young Jin Kim1), Jin Ho Lee2), Youn Won Park2), Myung Ho Song2) 1) Sungkyunkwan University, Korea
2) Korea Institute of Nuclear Safety, Korea
ABSTRACT
It is commonly required that steam generator tubes wall-thinned in excess of 40% should be plugged. However, the plugging criteria are known to be too conservative for some locations and types of defects and its application is confined to a single crack. In the previous study, a crack coalescence model applicable to steam generator tubes with two collinear axial through-wall cracks was proposed and a coalescence evaluation diagram was developed which can be used to determine whether the adjacent cracks detected by NDE coalesce or not. In this paper, a total of 9 local failure models including flow stress model, necking-based model, stress-based model, reaction force model and plastic zone contact model were introduced to determine the optimum local failure model. Plastic collapse tests and finite element analyses using thin plates with two collinear through-wall cracks were performed for the selection of the optimum local failure model. By comparing the test results with the prediction results obtained from local failure models, the reaction force model and plastic zone contact model were determined as the optimum local failure models.
KEY WORDS: Crack Coalescence, Local Failure Model, Plastic Collapse, Plugging, Steam Generator Tube, Tube Rupture
INTRODUCTION
It is commonly requested that steam generator tubes with defects exceeding 40% of wall thickness in depth should be plugged [1~3]. However, this criterion is known to be too conservative for some locations and types of defects. Many defects detected during in-service inspection show that the formation of multiple cracks at the top of tube sheet is typical but there is no reliable plugging criterion for the tubes with multiple cracks [4~10]. There have been studies for multiple cracks but most of them are limited to elastic analyses and only few studies have been done on the steam generator tubes failed by plastic collapse [11,12].
In the previous study, authors proposed a coalescence model of two collinear axial through-wall cracks existing in steam generator tubes and developed a coalescence evaluation diagram by performing finite element analyses which can be used to determine whether the adjacent cracks detected by NDE (Non-Destructive Examination) coalesce or not under the given operating condition [9]. It is assumed in the model that coalescence occurs when the ligament between cracks is fully yielded. A given material was assumed to show elastic-perfectly plastic behaviour and the mid-plane of the tube wall was selected as a reference plane for the estimation of crack coalescence. Thus, the accuracy of the determined coalescence loads depends on the definition of the flow stress of tube material and the selection of a reference plane.
The objective of this study is to optimise the coalescence model of two collinear axial through-wall cracks existing in steam generator tubes using local failure prediction models proposed by the authors and other researchers. The first step for this study is to develop an optimum local failure model to predict the coalescence of two through-wall cracks existing in thin plates. Plastic collapse tests were carried out for the thin plates containing two collinear through-wall cracks that the crack length, 2c, is 5, 8, and 13mm and the distance between cracks, d, is 1, 2, and 4mm, respectively. Each coalescence load was also predicted with 9 local failure models proposed by authors and other researchers and the optimum failure model was determined by comparing the estimated results with the experimental results. The second step of this study, which will be covered in another paper, is to apply the developed optimum failure model to steam generator tubes with multiple collinear axial through-wall cracks.
COALESCENCE MODEL OF MULTIPLE AXIAL THROUGH-WALL CRACKS
applicable to the case of large scale yielding because the failure of the cracked steam generator tubes is dominated by large scale yielding.
In our previous study, the following coalescence prediction model was introduced to estimate the local failure behavior of steam generator tubes with two collinear axial through-wall cracks [9].
,
0
=
cr iP
P
Rt
c
f
δ
(1)where δ0 is the distance between two adjacent cracks at the onset of coalescence, c is the half crack length, R is the mean radius of tube, t is the thickness of tube, Pi is the applied pressure, and Pcr is the failure pressure of the tube with
a single through-wall crack. Unlike small scale yielding, δ0 depends on the plastic zone size in large scale yielding, and thus becomes a function of the geometry, crack size, and applied load as expressed in Eq. (1). In this model, it is assumed that crack coalescence occurs when the ligament between cracks along the mid-plane of the tube wall is fully yielded. It is also assumed that the given material behaves in an elastic-perfectly plastic manner and its yielding takes place at a flow stress level.
A coalescence evaluation diagram shown in Fig. 1 was generated by performing finite element analyses and by applying the coalescence model. This diagram can be used to determine whether the adjacent cracks detected by NDE coalesce under the given loading conditions. It can also be used to evaluate a coalescence load of the adjacent cracks detected by NDE. The accuracy of the coalescence model and the usefulness of the coalescence evaluation diagram depend on the definition of the flow stress of tube material and the selection of a reference plane. As a first step to optimise the previously proposed coalescence model, a total of 9 local failure models proposed by the authors and other researchers were reviewed in this study. Plastic collapse tests and finite element analyses were also performed with the thin plates containing two collinear through-wall cracks.
PLASTIC COLLAPSE TESTS OF THIN PLATES
For the comparison with the prediction results mentioned in the next chapter and the selection of an optimum local failure model, plastic collapse tests are carried out using thin plates with two collinear through-wall cracks.
Material and Specimen
Test specimens were made of Inconel 600 plate material. The thickness of the plate is 1.6mm and the chemical composition and tensile properties of the material are given in Table 1 and 2, respectively. Fig. 2 shows the geometry of the specimen. Specimens were fabricated in T-L direction and notches were wrought by EDM (Electro-Discharge Machining) method. Plastic collapse tests were carried out for the plates containing two parallel through-wall cracks that 2c is 5, 8, and 13mm and d is 1, 2, and 4mm, respectively.
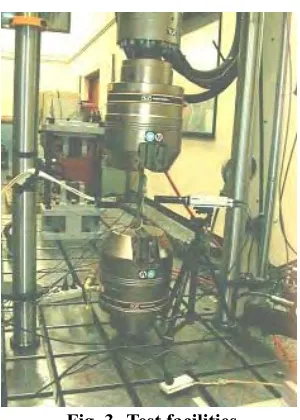
Test Facilities and Method
Plastic collapse tests were performed by displacement control and the universal testing machine of 25ton capacity (Instron model 8802) was used. Both ends of the specimen were fixed using the hydraulic grips as shown in the test facilities of Fig. 3. When the applied load increases, the crack coalescence behavior was observed using a high-resolution camera with a magnifying power of 100. Strain gauge, COD gauge, and extensometer signals were continuously stored in a notebook PC via A/D converter.
Test Results
Fig. 4 shows a typical failure process of the thin plate with two collinear cracks, which is monitored using the high-resolution camera. As load increases, crack tips are blunted and tearing occurs at the adjacent crack tips. A local failure of the ligament existing between cracks occurs and two cracks coalesce into one main crack. Then, the crack tips of the main crack tear and the outside ligaments collapse plastically. Finally the specimen is broken into two parts. Table 3 indicates the coalescence loads of two collinear cracks. The exact coalescing point was determined using the high-resolution camera.
LOCAL FAILURE PREDICTION MODELS OF THIN PLATES OR TUBES
(1) Flow Stress Model I (FSM-I) [9, 16~17]: It is assumed that coalescence occurs when the ligament between cracks is fully yielded. A given material is assumed to show elastic-perfectly plastic behavior and be yielded at the flow stress level, which is defined as the mean value between the yield strength and the ultimate tensile strength.
(2) Flow Stress Model II (FSM-II): The same definition with the FSM-I model is used but the flow stress is defined as the ultimate tensile strength of a given material.
(3) Necking-Based Model (NBM) [18]: It is assumed that coalescence occurs when the average ligament thickness between cracks begins to decrease rapidly. A true stress-true strain curve is used in this model. (4) Stress-Based Model I (SBM-I) [19]: It is assumed that coalescence occurs when the average effective stress in
the ligament equals the ultimate tensile strength. A true stress-true strain curve is used in this model.
(5) Stress-Based Model II (SBM-II): The same definition with the SBM-I model is used but an engineering stress-engineering strain curve is used in this model.
(6) Reaction Force Model (RFM) [20]: It is assumed that coalescence occurs when the reaction force in the ligament between cracks begins to decrease following the increase. A true stress-true strain curve is used in this model.
(7) Plastic Zone Contact Model I (PZC-I): It is assumed that coalescence occurs when plastic zones developed from the crack tips come into contact. This model is based on the contour plot of the effective stress, which comes to the yield strength. A true stress-true strain curve is used in this model.
(8) Plastic Zone Contact Model II (PZC-II): The same definition with the PZC-I model is used but this model is based on the contour plot of the effective stress, which comes to the ultimate tensile strength.
(9) Plastic Zone Contact Model III (PZC-III): The same definition with the PZC-I model is used but this model is based on the contour plot of the effective stress, which comes to the true stress value of the ultimate tensile strength.
ESTIMATION OF LOCAL FAILURE LOADS USING FINITE ELEMENT ANALYSIS
For the selection of the optimum failure prediction model of thin plates or tubes with two collinear through-wall cracks, the coalescence loads are estimated by using the local failure models mentioned above and their results are compared with the experimental results.
Finite Element Analysis
The deformation behavior of two collinear through-wall cracks was estimated by performing three-dimensional elastic-plastic finite element analyses. ABAQUS Version 5.8 package was used in this analysis. Fig. 5 shows the finite element mesh used for FE anaysis. An eighth of the specimen was modeled using the symmetry. The finite element mesh consists of 20-node quadratic brick elements with reduced integration points. The notch tip was rounded with the same radius of curvature as the specimen, ρ=0.15mm. Finite element analyses were carried out for the cases that the crack length, 2c, is 5, 8, and 13mm and the distance between two adjacent cracks, d, is 1, 2, and 4mm, respectively. The coalescence loads of thin plates were estimated by using each of three failure prediction models. The analysis results are summarized in Table 4.
RESULTS AND DISCUSSION
The coalescence loads obtained from the plastic collapse tests for double-cracked plates were summarized in Table 3. The coalescence load of two adjacent cracks decreases as the crack length increases and the ligament length decreases.
experimental results in Fig. 11. The accuracy of the coalescence models is in the order of PZC-III, RFM, PZC-II but the difference is small.
A little or quite conservative estimation results were observed regardless of the model when two crack are close contact. To investigate the cause of conservatism, stress analyses were performed with a full stress-strain curve derived from the experiment. Fig. 12 shows the strain fields in the ligament between two adjacent cracks of 2c = 8mm and d = 1, 2, and 4mm, respectively, as the applied load increases. For d = 1 and 2mm, the coalescence loads are 29.60kN and 30.08kN, respectively. High strain fields were formed in the ligament between two adjacent cracks as shown in Fig. 12 (a) and (b). For d = 4mm, however, two cracks coalesce in 31.33kN and a relatively low strain field was formed in the inner ligament as depicted in Fig. 12 (c). When the deformation in the inner ligament existing between two adjacent cracks increases, the stress fields near crack tips are redistributed. The stress level is reduced in the inner ligament and increased in the outer ligaments to satisfy a geometric compatibility condition. Stress redistribution is also affected by crack growth. And it is accelerated by the combination of the crack growth and deformation in the inner ligament. The stress relaxation caused by stress redistribution is affected more greatly when two crack are close contact. But the crack growth was not considered in the finite element analysis performed here. It is thought that the conservative prediction results were produced by not considering crack growth effects.
A total of 9 failure prediction models were introduced in this study to estimate the coalescence loads of thin plates and tubes with two collinear through-wall cracks and their estimation results were compared with the experimental results. The accuracy of the local failure models, i.e., the coalescence models is in the order of the III, RFM, PZC-II, SBM-PZC-II, SBM-I, NBM, FSM-PZC-II, FSM-I, and PZC-I model. From the above results, the PZC-PZC-II, PZC-IPZC-II, and RFM model were selected as the optimum failure prediction models of thin plates and tubes with two collinear through-wall cracks.
CONCLUSIONS
In this study, the plastic collapse tests using Inconel 600 plate specimens with two collinear through-wall cracks were performed. And a total of 9 failure prediction models were introduced to estimate the coalescence of two collinear through-wall cracks existing in thin plates and tubes. From the comparison results between the estimated and experimental results, the following conclusions are obtained.
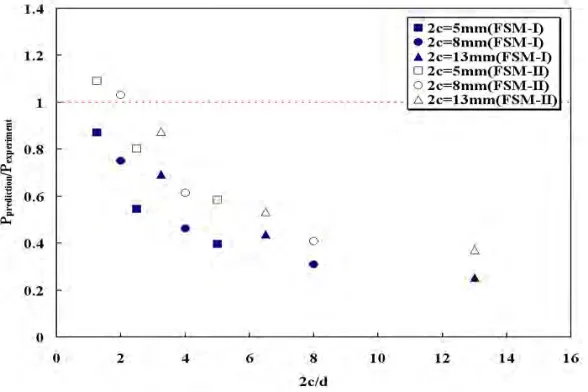
- The flow stress models predict the coalescence loads too conservatively when two adjacent cracks are close contact.
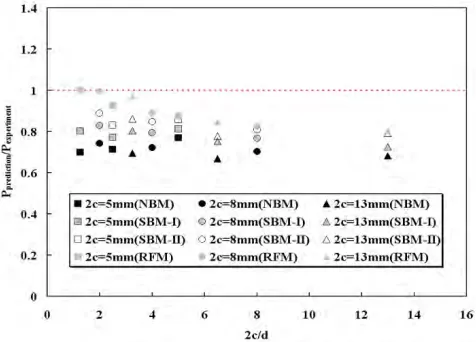
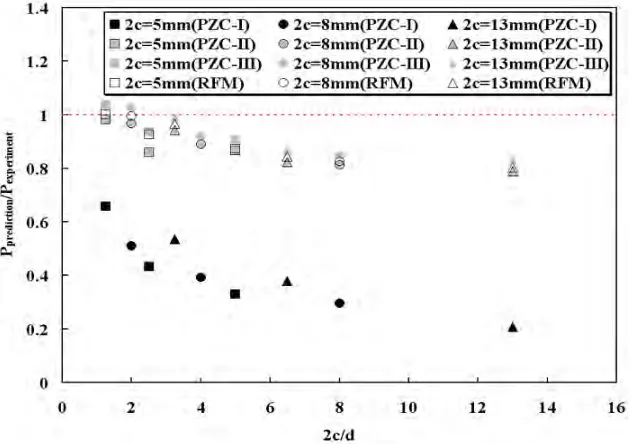
- The results of the reaction force model and the plastic zone contact model based on the contour plot of the tensile strength showed a good agreement with the experimental results.
- The accuracy of the local failure models is in the order of the PZC-III, RFM, PZC-II, SBM-II, SBM-I, NBM, FSM-II, FSM-I, and PZC-I model.
- The reaction force model and the plastic zone contact model based on the contour plot of the tensile strength can be used as the optimum local failure prediction models for the integrity evaluation of steam generator tubes.
NOMENCLATURE
a - Crack depth c - Half crack length
d - Distance between two adjacent cracks R - Mean radius of tube
t - Thickness of specimen Pi - Applied pressure
Psc - Failure pressure of tube with surface crack
Pcr - Failure pressure of tube with through-wall crack
δ0 - Distance between two adjacent cracks at the onset of coalescence
ρ - Radius of curvature
REFERENCES
1. USNRC, “NUREG/CR−6365, Steam Generator Tube Failures,” April, 1996
2. USNRC, “Regulatory guide 1.121, Bases for Plugging Degraded PWR Steam Generator Tubes,” August, 1976 3. ASME, “Rules for Construction of Nuclear Power Plant Components,” ASME Bolier and Pressure Vessel Code,
Sec. III, 1998
Vol. D, pp.413-419, 1987
5. Yu, Y.J., Kim, J.H., Kim, Y., and kim, Y.J., “Development of Steam Generator Tube Plugging Criteria for Axial Crack,” ASME PVP, Vol, 280, pp.79-83, 1994
6. Kim, H.D., Chung, H.S., and Hong, S.R., “Discussion on Operation Leakage Criteria of Ulchin Unit 1&2 Steam Generators,” Proceedings of the Korean Nuclear Society Autumn Meeting, 1999
7. Kim, H.D, Kim, K.T., and Chung, H.S., “Structural integrity assessment on axial PWSCC of steam generator tubes,” Proceedings of the Korean Nuclear Society Autumn Meeting, 1999
8. Gorman, J. A., Harris, J. E., and Lowenstein, D.B., “Steam Generator Tube Fitness-for-Service Guidelines,” AECB Report No. 2.228.2, pp. 220, 1995
9. Lee, J.H., Park, Y.W., Song, M.H., Kim, Y.J., and Moon, S.I., “Determination of Equivalent Single Crack based on Coalescence Criterion of Collinear Axial Cracks,” Nuclear Engineering and Design, Vol.205, pp. 1-11, 2000 10. Kim, J.S. et al., “Investigation Report for Steam Generator Tubes Pulled out from Ulchin #1,” October, 1999 11. Y. Murakami, “Stress Intensity Factors Handbook,” pp.204-205, 1987
12. Cho, Y.J., “A Study on the Interaction Effect of Adjacent Semi-Elliptical Crack,” Master’s Thesis, 1990
13. Kim, Y. J., Choy, Y. S., and Lee, J. H., “Development of Fatigue Life Prediction Program for Multiple Surface Cracks,” ASTM STP 1189, pp.536-550, 1993
14. Shibata, K., Yokoyama, N., Ohba, T., Kawamura, T., and Miyazono, S., “Growth Evaluation of Fatigue Cracks from Multiple Surface Flaws (I),” J. Japanese Nuclear Society, Vol. 28, No. 3, pp.250-262, 1985
15. Shibata, K., Yokoyama, N., Ohba, T., Kawamura, T., and Miyazono, S., “Growth Evaluation of Fatigue Cracks from Multiple Surface Flaws (II),” J. Japanese Nuclear Society, Vol. 28, No. 3, pp.258-265, 1986
16. Park, Y. W., Song, M. H., and Lee, J. H., "Steam Generator Tube Integrity Program," KINS/RR-001, 2000
17. Lee, J.H., Park, Y.W., Song, M.H., Kim, Y.J., and Moon, S.I., "Evaluation of Plugging Criteria an Steam Generator Tubes and Coalescence Model of Collinear Axial Through-Wall Cracks," J. Korean Nuclear Society Vol. 32, pp.465-476, 2000
18. Diercks, D. R., "Steam Generator Tube Integrity Program Monthly Report," ANL, August, 2000 19. Diercks, D. R., "Steam Generator Tube Integrity Program Monthly Report," ANL, September, 2000
Table 1 Chemical composition of Inconel 600 plate
Element C Mn Si P S Ni Cr
Wt. % 404* 0.22 0.37 N.D. N.D. 74.4 15.7
Element Co Ti Al Cu Fe N
Wt. % 0.05
6 0.16 0.26 0.09 9.7 69.6*
*Unit: ppm
Table 2 Mechanical properties of Inconel 600 plate Yield strength (MPa) Tensile strength (MPa) Young’s modulus (GPa) Elongation (%) Poisson’s ratio
329 662 213 44 0.3
Table 3 Coalescence load of two cracks (experiment) Crack (mm) Coalescence load (kN)
2c=5, d=1 33.34
2c=5, d=2 36.16
2c=5, d=4 36.64
2c=8, d=1 29.60
2c=8, d=2 30.08
2c=8, d=4 31.33
2c=13, d=1 23.47
2c=13, d=2 25.05
2c=13, d=4 25.62
Table 4 Coalescence load of two cracks (finite element analysis and experiment)
Coalescence load (kN) 2c & d
(mm) FSM-I FSM-II NBM SBM-I SBM-II RFM PZC-I PZC-II PZC-III Exp.
Results 2c=5,
d=1 13.22 19.49 25.64 27.06 28.63 29.12 11.02 28.90 30.20 33.34
2c=5,
d=2 19.76 29.05 25.78 27.85 30.04 33.47 15.66 31.07 33.81 36.16
2c=5,
d=4 31.89 39.98 25.62 29.37 X 36.70 24.08 35.98 38.04 36.64
2c=8,
d=1 9.15 12.11 20.83 22.7 23.9 24.42 8.73 24.08 25.09 29.60
2c=8,
d=2 13.94 18.47 21.73 23.86 25.48 26.75 11.83 26.75 27.65 30.08
2c=8,
d=4 23.52 32.28 23.28 25.94 27.86 31.15 15.97 30.31 32.16 31.33
2c=13,
d=1 5.96 8.71 16.04 17.05 18.59 18.85 4.86 18.53 19.54 23.47
2c=13,
d=2 10.97 13.35 16.76 18.86 19.48 21.17 9.49 20.64 21.79 25.05
2c=13,
Fig. 1 Coalescence evaluation diagram
Fig. 2 Geometry and size of test specimen
Fig. 4 Process of plastic collapse
Fig. 5 Finite element mesh of plate specimen with two cracks
Fig. 7 Changes of the average ligament thickness
Fig. 8 Changes of reaction force in the ligament between two cracks
(a) 17.41 kN (b) 17.73 kN
(c) 18.29 kN (d) 18.53 kN
Fig. 10Contour plots of Mises stress on the mid-plane ((a), (b)) and surface plane ((c), (d))
(a) 2c = 8 mm, d = 1 mm
(b) 2c = 8 mm, d = 2 mm (c)
(d) 2c = 8 mm, d = 4 mm