©
DOI: 10.1534/genetics.104.035709
Quantitative Trait Locus Analysis Using Recombinant Inbred Intercrosses:
Theoretical and Empirical Considerations
Fei Zou,* Jonathan A. L. Gelfond,* David C. Airey,
†,‡,1Lu Lu,
†,‡Kenneth F. Manly,
†,§Robert W. Williams
†,‡and David W. Threadgill,**
,2*Department of Biostatistics and**Department of Genetics and the Carolina Center for Genome Sciences, Lineberger Comprehensive Cancer Center and Center for Environmental Health and Susceptibility, University of North Carolina, Chapel Hill, North
Carolina 27599 and†Center for Genomics and Bioinformatics,‡Department of Anatomy and Neuroscience and §Department of Pathology, University of Tennessee, Memphis, Tennessee 38163
Manuscript received September 1, 2004 Accepted for publication March 18, 2005
ABSTRACT
We describe a new approach, called recombinant inbred intercross (RIX) mapping, that extends the power of recombinant inbred (RI) lines to provide sensitive detection of quantitative trait loci (QTL) responsible for complex genetic and nongenetic interactions. RIXs are generated by producing F1hybrids between all or a subset of parental RI lines. By dramatically extending the number of unique, reproducible genomes, RIXs share some of the best properties of both the parental RI and F2mapping panels. These attributes make the RIX method ideally suited for experiments requiring analysis of multiple parameters, under different environmental conditions and/or temporal sampling. However, since any pair of RIX ge-nomes shares either one or no parental RIs, this cross introduces an unusual population structure requiring special computational approaches for analysis. Herein, we propose an efficient statistical procedure for QTL mapping with RIXs and describe a novel empirical permutation procedure to assess genome-wide significance. This procedure will also be applicable to diallel crosses. Extensive simulations using strain distribution patterns from CXB, AXB/BXA, and BXD mouse RI lines show the theoretical power of the RIX approach and the analysis of CXB RIXs demonstrates the limitations of this procedure when using small RI panels.
A
LTHOUGH significant progress has been achieved often not robust enough to accurately localize the under-in the identification of human genes underlyunder-ing lying genetic differences associated with the traits under many pathological conditions, the vast majority of genes study. However, in both experimental and domesticated have been limited to simple Mendelian traits and well- species, where large collections of molecular and genetic defined quantitative traits with relatively large and con- markers have been used to develop detailed genetic maps sistent effects (NadeauandFrankel2000;Korstanje and from which large numbers of recombinantindividu-andPaigen2002). However, the vast majority of mam- als can be generated, statistical analysis of the association
malian phenotypic variation, whether it is morphologi- between phenotype and genotype for the purpose of cal or susceptibility to various pathological conditions, localizing genomic regions affecting complex traits is is polygenic and influenced by complex interactions with plausible. Nonetheless, the regions harboring quantita-environmental factors. Traits that have been historically tive trait loci (QTL) are usually mapped to broad inter-difficult to analyze include those with incomplete pene- vals and identifying candidate genes after initial map-trance or expressivity such as behavior, cancer susceptibil- ping has proven to be a difficult task.
ity, and physiological responses to environmental stimuli Because of the genetic resources and manipulations as well as those traits that change with age. Complicating available and because of the biological similarity to hu-the analysis of hu-these types of traits is hu-the prediction that mans, the mouse has become the de facto model organ-many are also controlled by genes that have small effects ism to genetically dissect medically important complex individually, but whose cumulative action is the cause traits. However, the most widely used experimental map-of significant interindividual variation. Consequently, a ping approaches, particularly intercrosses and back-single phenotypic measurement per unique genome is crosses, lack the genetic reproducibility to efficiently perform multivariant analyses across traits and environ-mental conditions (Darvasi1998). This is a particularly 1Present address:Department of Pharmacology, Vanderbilt Univer- acute problem when one wants to examine numerous
sity, Nashville, TN 37232.
gene-environment interactions or study disease progres-2Corresponding author:Department of Genetics, CB 7264, University
sion at many stages and ages. Chromosome substitution
of North Carolina, Chapel Hill, NC 27599.
E-mail: [email protected] strains (CSS) were recently shown to be powerful
sources to genetically dissect additive-effect loci (Nadeau genotypes will be known in advance by imputing from the parental RI lines; RIX are especially useful for
long-et al. 2000; Singer et al. 2004). However, when used
without additional crossbreeding, they lack the genetic term collaborative research because their genotypes are renewable, making the phenotypic data cumulative complexity to detect genetic interactions between
non-syntenic genomic regions. Another powerful resource, within the research community; and, since RIX ge-nomes are easily replicated, experiments with different recombinant congenic strains (RCS), has the ability to
dissect nonsyntenic genetic interactions but lacks the environmental variables or temporal relationships can be performed on the same genotypes.
reproducibility to efficiently investigate
gene-environ-ment interactions because of the backcrosses required In this study, the novel RIX method that builds upon classical RI panels is evaluated and tested. While subjects to identify the interacting genomic intervals (van
Zut-phenet al.1991;Grootet al.1992). in traditional QTL mapping using backcross or inter-cross populations all have an identical genetic relat-Recombinant inbred (RI) lines are another of the
major resources that have contributed to genetic dissec- edness to one another, this is not the case for the RIX design; some RIXs share a common parental RI line, tion of simple and complex traits (Bailey1971;Swank
and Bailey 1973; Watson et al. 1977; Plomin et al. making them genetically more related to each other
than those RIX that do not share parental RI lines. 1991b). A major advantage of RI panels over other
com-monly used mapping approaches is their ability to sup- Specifically, RIX can be viewed as the last generation of a pedigree originating from two inbred founders port genetic mapping and correlations among many
traits, even under different environmental conditions or the diallel designs widely used in plant genetics. To control for this complex relationship structure, we
(Plominet al.1991a). However, mouse RI panels
gener-ally have low power and precision compared to other adapted a mixed model for RIX mapping that was origi-nally proposed to handle human pedigree data (Amos
resources because of their small size; typical mouse RI
panels have only 15–35 strains from a single pair of 1994). Similarly, we show that the widely used direct permutation procedure to assess significance in QTL parental inbred lines. The situation is significantly
dif-ferent in other species like plants and invertebrates mapping is not applicable to the RIX design but requires adaptation to maintain proper relationships among where hundreds to thousands of RI lines may exist
be-cause of the quick generation time and ease of mainte- traits and polygenes. Using these new methods, we com-pare the relative power of RI panels ranging from 13 nance (Johnson and Wood 1982; Burr et al. 1988;
Reiteret al.1992;Fryet al.1998). to 34 lines and demonstrate that, although small RI
panels and their derivative RIXs suffer from a lack of We recently proposed a novel derivative of RI lines,
called recombinant inbred intercrosses (RIX), that per- power, the RIX approach adds significant power for larger RI panels.
mits repeated interrogation of a fixed, but complex genotype to reduce nongenetic variance while increas-ing the power of the original RI panel (Threadgillet al.
MATERIALS AND METHODS 2002). Although isogenic, a group of RIX individuals
has a genetic structure that is remarkably similar to that Mouse breeding and sample collection:CXB1 through CXB13 RI breeding stock, originally produced from BALB/cByJ crossed of an F2 intercross, except that individuals from the
to C57BL/6ByJ (Dux et al.1978), were obtained from The same RIX can be viewed as clones of F2individuals that
Jackson Laboratory (www.jax.org). The F1intercrosses between
inherit all the advantages of RI strains. Moreover,
com-pairs of CXB RI lines were set up to generate all 78 non-pared to RI, the advantages of RIX include twice the reciprocal matings by crossing low-numbered female strains number of recombination sites in a single individual by higher-numbered male strains. This simple low-by-high breeding scheme results in a systematic bias: CXB1 is always since each is derived from two parental RIs, albeit there
used as a maternal strain and CXB13 is always used as a pater-are no new recombination sites; that dominance effects
nal strain. To assess the role of parental effect we generated 14 can be estimated; a large expansion of different RIX
pairs of reciprocal RIXs. Progeny for each RIX were produced genomes over the parental RI; and, because of the buf- from at least two litters for each cross. We did not use cross-fering capacity of their heterogeneous genome struc- fostering of litters or standardize the numbers of animals within litters. All RIX mice were produced in a pathogen-free ture, that RIX genomes should provide more reliable
barrier facility at one site (University of Tennessee Health trait means than the parental RIs. However, the
non-Science Center) over a 1-year period. Mice between 50 and 100 syntenic associations present in RI panels, particularly
days of age were weighed, anesthetized, and perfused trans-those with a small number of lines (Williams et al. cardially with 0.1mphosphate buffered saline (PBS) followed
2001), are retained and even exacerbated in the RIX. by 4% paraformaldehyde (PFA) in 0.1m PBS. Bodies were stored in 50-ml conical tubes in 1% PFA at 4⬚until dissection. The RIX approach also has advantages over classical
Data on body and brain weight, age, sex, litter size, and parity crosses like the F2 design since each RIX has a higher
were collected. For the parental RI mice we often did not recombination density because of the map expansion
Figure1.—Production of RIX hybrids. The relationship between the parental strains and the derivative RIs along with the relationships between RIXs is shown.
tion for Assessment and Accreditation of Laboratory Animal positive rates are likely to result (Zouet al.2001). Thus any appropriate analysis should take this special structure of RIX Care-approved facility under specific pathogen-free conditions.
Crosses to generate an F2population were between BALB/ genomes into consideration. Furthermore, in some situations there is interest in estimating parental contributions to traits, cByJ and C57BL/6ByJ. A total of 184 animals, between 49 and
89 days of age, were collected. Measurements were obtained which also requires consideration of the special architecture of RIX genomes.
for body and brain weights, log-transformed, and adjusted for
covariates as described above. Interval mapping, using R/qtl Calculating thresholds and power are important practical issues in the design and analysis of any QTL study. However, (Bromanet al.2003), was performed to detect loci
modulat-ing body and brain weights for comparison to the CXB RI and the usual pointwise significance level based on chi-square ap-proximation is inadequate because the entire genome is tested RIX results.
Genotypes:The genotypes of all RI lines used in the simula- for the presence of a QTL. Empirical permutation procedures to estimate genome-wide threshold values for traditional inter-tion studies were previously reported (TaylorandPhillips
1995;Williamset al.2001). For analysis of the CXB RIs, 382 val mapping have been proposed (ChurchillandDoerge 1994). These procedures can be easily extended to other, markers, representing unique strain distribution patterns (SDPs),
were used. The RIX genotypes were imputed from the RI geno- more complicated situations such as combined crosses where the permutation can be restricted within each class (Liuand types automatically with QTX (Manlyet al.2001) while the
CXB F2progeny were genotyped for 72 simple sequence length Zeng2000). However, the appropriate procedure to extend permutation analysis to RIXs is not straightforward because polymorphism (SSLP) markers.
Three pairs of the AXB/BXA RI strains have highly simi- the mating scheme used to produce different RIX genomes introduces correlation between related RIXs (those sharing a lar SDPs (Williamset al.2001); the high degree of identity is
strikingly different from the 50% expected for independently parental RI line). Ignoring the correlation between related RIXs is problematic and leads to large biases in estimating derived RI strains. We therefore used only one representative
from each of these pairs in the simulation studies. Otherwise, thresholds. Intuitively, the data should be permuted such that the parental contribution is preserved while the major gene false declaration of linkages and spuriously high and low
re-combination frequency estimates may be produced. effect on the trait is destroyed. To achieve this, we developed a novel permutation procedure.
RIX mapping requires a unique statistical approach:Genetic
mapping algorithms using experimental populations, such as Calculations for the RIX design:The following notations are introduced for later use. Suppose there are L RI lines backcrosses, intercrosses, or RI panels, to localize QTL are well
developed. Many excellent open source software packages, such that produceM⫽(L(L⫺1))/2 nonreciprocal RIXs. Then suppose the RI lines are numbered as RI1, RI2, . . . , RILand
as QTLCart (Bastenet al. 1994), MapManager (Manlyet al.
2001), and MAPMAKER/QTL (Lincolnet al.1992), are avail- denote the nonreciprocal RIXs derived from parental lines RIiand RIjas RIXij, wherei⬍j⫽1, 2, . . . ,Lor, alternatively,
able. Due to the similarity of RIX and F2genome structures,
it would appear that methods developed for F2intercrosses as RIXk, wherek⫽1, 2, . . . ,Mfor ease of notation.
For quantitative traits, it is often assumed that traits are could be directly applicable to RIXs. However, the relationship
between different RIXs is complicated. For F2individuals, the controlled by both poly- and oligogenes, genes with small and intermediate effects, respectively. The effects of polygenes on relationship between any pair will on average be the same
with each individual sharing, on average, 50% of its genetic the ability to map oligogenes have been documented and taken into account in algorithms used for commonly used ge-composition. However, this is not the case for RIX genomes.
Pairs of RIXs sharing one parent are more closely related than netic crosses (VisscherandHaley1996). Within single crosses, such as backcrosses or intercrosses, the progeny have identical those RIXs that do not share a parent. For example, a RIX
produced by crossing RI1and RI2(RIX12) is expected to be relationships given the QTL genotypes, resulting in a compound symmetry structure (Yandell1997). Thus, unbiased estimates more similar to a RIX produced by crossing RI1 and RI3
(RIX13) than to a RIX from crosses between RI3and RI4(RIX34) of QTL effects are obtained even when polygenic effects are ignored. Nonetheless, the power to detect QTL is influenced since RIX12and RIX13share a parental RI (RI1) while RIX12
and RIX34do not share any parental RI lines (Figure 1). From by the magnitude of the polygenic effect. The situation be-comes problematic for complicated pedigree structures. Meth-a stMeth-atisticMeth-al point, if the relMeth-ationship Meth-among individuMeth-als is
different correlations between related individuals have been Consider a toy example where there are four parental RI developed for analyzing human pedigrees and diallel mating lines, RI1, RI2, RI3, and RI4, which produce six nonreciprocal designs (Goldgar1990;Amos1994;ZhuandWeir1996;Xu RIXs: RIX12, RIX13, RIX14, RIX23, RIX24, and RIX34. Now suppose 1998). For the RIX design, a similar approach can be used we get RI3, RI1, RI2, and RI4 after permuting RI1, RI2, RI3, since RIX can be viewed as the last generation of a pedigree and RI4; then the permuted marker genotypes of RIX12, RIX13, originating from two inbred founders or the diallel designs RIX14, RIX23, RIX24, and RIX34are the corresponding genotypes widely used in plant genetics. of RIX13, RIX23, RIX34, RIX12, RIX14, and RIX24, respectively.
Mixed-model analysis:Assume the existence of major QTL Note that instead of permuting the genotypes of RIXs di-and polygenes, all affecting a trait of interest. In aggregate, rectly, we permute the genotypes of the parental RIs and then the polygenic effect is normally distributed and acts indepen- create the new genotypes for each RIX; this preserves the orig-dently of the major QTL. For simplicity, a model with one inal relatedness between RIXs, which is equivalent to main-major QTL is considered; an extension to a multiple-QTL model taining the relationship between the trait and the polygenes. is straightforward. We fit the following mixed-effect model, After we randomly reassign marker genotypes to RIXs, we can treat the permuted data sets in the same way as the original Y⫽X1a1⫹X2a2⫹Z␣ ⫹e, (1) data and repeat the analysis using model (1).
where a1is a fixed effect due to nongenetic factors such as age;a2⫽(a,d) is a fixed effect withaanddcorresponding
to the additive and dominant effects of the major QTL, respec- RESULTS tively;␣(L⫻1) is a random effect due to polygenes and other
nonmodeled QTL and isⵑN(0,2
a); andeis a random error Power analysis of RIXs: Extensive simulations were
and isⵑN(0,2
e).Zis anM⫻Lmatrix with performed to investigate the properties of the RIX
map-ping method. Rather than simulating hypothetical ge-zkj⫽
冦
1 if one of thekth RIX individual’s parents isRj
0 otherwise, notypes of parental RI lines, we choose three panels of
existing, widely used mouse RI lines and their associated fork⫽1, 2, . . . ,M, j⫽1, 2, . . . ,L.
genotypes for the simulations to more accurately reflect Obviously,兺jzkj⬅2 for allk⫽1, 2, . . . ,M since each individ- those in practice. The three RI panels are CXB (13 lines
ual has two and only two parents. Although this model can derived from a BALB/cByJ⫻C57BL/6ByJ cross), AXB/ be extended to parental effects through the generation of
BXA (22 lines derived from an A/ J⫻C57BL/6 J cross genetically identical RIXs using reciprocal RI crosses as noted
and the reciprocal C57BL/6 J⫻ A/ J cross), and BXD later, we assumed no parental effects in our analyses.
(37 lines derived from a C57BL/6 J⫻ DBA/2 J cross); The hypotheses for whether any major QTL exists at a given
locus are these three provide a good range of RI panel sizes. Most
RI panels have well-documented nonsyntenic linkage as-H0:a⫽d⫽0 vs. H1:a⬆0 andd⬆0.
sociations that are caused by correlated genotypes that AnF-statistic or likelihood-ratio test statistic or equivalent LOD make correct QTL localization impossible when by chance score can be used to test this model. In all subsequent analyses,
one of the highly correlated markers is linked to the the model was tested in SAS with Proc Mixed (SAS code is
pro-QTL (Williams et al. 2001). When this occurs, other vided as a supplement at http://www.genetics.org/supplemental/
or can be downloaded at http://www.mouselab.org; SAS Insti- follow-up studies are required to determine which
re-tute, Cary, NC). gion is actually linked to the QTL. As would be expected,
Permutation test:Obtaining appropriate threshold values the smaller RI panels are more severely affected by the for RIX analysis using model (1) is quite complicated. We have
problem of high nonsyntenic correlation. Furthermore, found that the threshold depends on the magnitude of the
back-having a small number of parental RI lines makes it ground polygenic effects when all else is equal, especially when
the number of parental RI strains is small, such as with the difficult to separate major QTL effects from polygenic CXB set where only 13 parental RI lines are available. Thus, to effects. Conversely, we would expect that the larger the minimize genome-wide type I errors, appropriate permutation
RI panel, the greater the power is for mapping major procedures must be used to control for polygenic effects when
QTL and for separating major QTL effects from poly-detecting major QTL.
Ideally, when testing the existence of major QTL, the per- genic effects. Thus, the three RI panel sizes can be used mutation procedure should not destroy the relationship be- to investigate the effect of the number of parental RI tween the trait and the polygenic effect, but only the relation- lines on QTL mapping using the RIX method. ship between the trait and the major QTL. If data are permuted
The 13 extant CXB RI lines can produce 78 nonrecip-directly (ChurchillandDoerge1994), the relationship not
rocal RIX genomes, while the 22 AXB/BXA (after strains only between the major QTL and the trait but also between
the polygenes and the trait is destroyed. Since this relationship whose genotypes are highly correlated with other strains is destroyed with the RIX, permutations performed according are excluded) and the 34 BXD RI lines will allow the toChurchillandDoerge(1994) give artificially low
thresh-generation of 231 and 561 RIX unique genomes, respec-olds, resulting in enormously high false-positive rates in the
pres-tively. The total markers used in our simulations were ence of polygenic effects.
382, 591, and 552 for CXB, AXB/BXA, and BXD, respec-To avoid this problem, we extended the permutation method
of Churchill and Doerge in such a way that the special correla- tively (Williamset al.2001).
tion structure of the data is maintained after permutation. Our simulations were intended to answer the follow-We first permute 1, 2, . . . ,L, the parental strain number, and
ing questions: (a) How does the proposed model per-then suppose we getφ(1), . . . ,φ(L). Then the permuted marker
form under different scenarios?, (b) How do the paren-genotypes of RIXijwill be the corresponding marker genotypes
power?, and (c) How does the empirical permutation procedure perform?
To achieve these, two general scenarios were simu-lated: (a) no major QTL, with polygenes and random error; and (b) one major QTL, with polygenes and ran-dom error. Scenario a can be viewed as the null of b. For all simulations,2
e ⫽ 1 and2ais set to 0.25. A series
of additive and dominant effects of major QTL were simulated, which are explained in subsequent tables and figures.
For CXB and AXB/BXA, the sample sizes of RIXs are 78 and 231, respectively, which is equal to the maximal number of unique, nonreciprocal RIXs that can be pro-duced from the parental RIs. For BXD, in practice, using all 561 RIXs may be too large so we decided to set the RIX sample size to 340 with each sample generated by a clockwise mating scheme. That is, RI1was mated with the
following 10 RI lines, RI2, . . . , RI11; RI2was mated with
the next 10 RI lines following it, RI3, . . . , RI12; and RIL
was mated with RIL⫹1, . . . , RIL⫹10. To compare RIXs
with RIs, the same number of RI animals was used. Thus, for the CXB simulations, we used a single RIX sample for each of the 78 possible RIX genomes but six replicas for each parental RI line, giving 78 total individuals for both populations. The same phenotype-generating mechanism used for RIXs was applied to the parental
RIs. Instead of analyzing phenotypes from individual Figure2.—Power comparison of RI and RIX. A QTL with a series of additive (a) and dominant (d) effects was simulated RIs, we averaged the phenotypes within each line and
using genotypes from (A) CXB and (B) BXD. Thresholds used the RI line means for all analyses. For RIs, the
were determined using 10,000 simulations and 2000 experi-following model was fit:
ments were performed for each level of additive effect. The solid line (2) is the RI power curve and dashed lines are the
Y⫽ X1a1⫹X a⫹enew. (2)
RIX power curves corresponding to different dominant ef-The symbols used both in this equation and in Equation fects: (1) no dominant effect; (3)d⫽a/2; (4)d⫽a/√3; (5)
d⫽a/√2; and (6) d⫽a. 1 have the same meaning. The differences between the
two models are that (a) for RIs, the polygenic effects are nonestimable and have been lumped into the random
sets. The empirical threshold can be, in some degree, errorenew, that is,2enew⫽ 2e ⫹ 2a, and thus only the
fixed-viewed as the true threshold. For power calculations effect model is necessary; and (b) in RIs, only the
addi-under the alternative, if any of the 20 markers adjacent tive effectacan be tested andX⫽1 or⫺1, an indicator
to the QTL had a LOD score greater than the empirical for the two homozygous genotypes.
threshold, the QTL was considered detected. The over-Since the parental RI lines are fixed, it is more
reason-all power was the average power across the 10 sets of␣’s. able to fix the polygenic effect for a specific trait than
A direct comparison of the power of the RI compared to allow it to be totally random each time in the
simula-to the RIX under the model with one major additive QTL tion. It is also important to generate different polygenic
and a polygenic effect shows that the RI has slightly more effects to investigate how these effects influence the
power than the RIX to detect additive QTL for both CXB genome-wide thresholds to obtain a more generalized
and BXD (Figure 2). However, in the presence of QTL picture because polygenic effects vary for different traits.
with dominant effects the power of the RIX is higher; Thus, in all simulations 10 different realizations (or 10
the intermediate-sized AXB/BXA RI set gives similar sets of␣’s) of the polygenic effect were generated. These
power curves (data not shown). Due to the lack of power ␣’s were held fixed within the CXB (or AXB/BXA or
to detect dominant effects using the RI, it is expected that BXD) cases for comparisons between RIXs and RIs.
with increasing dominant effects, the power of the RIX Thresholds and power were determined by simulating
increases and we have observed that the RIX has sub-10,000 data sets under the null and 200 data sets under
stantially higher power than the RI when dominant ef-the alternative (one major QTL) hypoef-thesis for each
fects are large. set of␣’s. For data simulated under the null, the highest
To evaluate the performance of the permutation pro-LOD score among all markers was recorded and the
em-cedure in assessing the genome-wide significance level, pirical threshold was set to the 95th percentile of the
Figure3.—Comparison of permuted and empirical thresh- Figure4.—Significance thresholds and permutation distri-olds for RIXs. Ten different realizations of the polygenic effect bution of LOD scores for RIXs. Distributions are shown of maxi-(x- axis) were simulated for RIXs generated from the (A) AXB/ mal LOD scores of the data set used to generate Figure 3 for BXA and (B) BXD RI sets. The empirical 95th percentile thresh- RIXs generated from (A) AXB/BXA and (B) BXD using 5000 old was estimated from the maximal LOD score obtained from permutations of one data set (additive effect⫽1.7) that was 10,000 simulations where data were simulated under the null simulated with one major QTL (results from other simulated with every realization of the polygenic effect. For permutation, data sets show similar patterns). The solid line is the maximal 10 data sets for each realization of the polygenic effect and their unpermuted LOD score; the dotted line is the 95th percentile 95th percentile permuted thresholds were calculated.⫹, per- of the permuted maximal LOD scores.
muted thresholds of 1000 simulated data sets under different realizations of the polygenic effect; E, empirical thresholds under
different realizations of the polygenic effect. with one major QTL was compared to the maximal LOD scores for the 5000 permutated data sets. Since the orig-inal maximal LOD score exceeds all of the 5000 permu-each of the 10␣’s with a total of 100 simulated data sets.
tation maximal LOD scores, one would reject the null Within each data set, an additive model is fit and 1000
hypothesis at the 0.05 level. permutations were performed, from which the 95th
per-However, the permutation procedure fails for the case centile permutation threshold was calculated. The
con-of the CXB panel (Figure 5A). As can be observed, the servative nature of the permutation scheme for BXD
95th percentile of the permuted data sets exceeds the and AXB/BXA panels is demonstrated (Figure 3). For
maximal LOD score of the unpermuted data. This indi-the two largest RIX panels tested, indi-the permutation
thresh-cates that the permutation procedure is too conservative olds for significance are generally greater than the
empiri-and one cannot reject the null hypothesis at the 0.05 cal thresholds, indicating conservativeness of the
per-level. To show that the problem is not specific to RIXs, mutation procedure in controlling the type I error rate.
we also ran the permutation for the parental CXB RI However, for the CXB panel where the number of
pa-panel, showing that the potential RI power suffers from rental strain is small, the permutation procedure is too
the same conservativeness (data not shown). conservative and essentially has no power to detect QTL.
The permutation algorithm reveals lack of power for
For AXB/BXA and BXD, where the number of
paren-small RI panels:For the CXB (both RI and RIX), the per-tal strains is relatively large, the conservativeness of the
mutation test is found to be overly conservative at the permutation procedure does not prevent the detection
0.05 level. The maximal LOD scores have a banded of QTL (Figure 4); the conservativeness goes down as
pattern when plotted across different simulations under the number of parental RIs goes up. The unpermuted
BXA and BXD with 591 and 552 markers, the probabil-ity is 6⫻10⫺4and 6 ⫻10⫺8, respectively.
The probability of a perfect match of a permuted re-sponse vector isⱖ0.05 for the CXB, whereas the prob-abilities for the AXB/BXA and BXD are much less than the stated 0.05 nominal level. This suggests that the permutation test will have positive power for the AXB/ BXA and the BXD panels, but the CXB would yield a 95th percentile threshold under the permutation no less than the observed maximal LOD score. Therefore, no QTL can be declared at the 0.05 level for the CXB panel and RI sets of this small size (n⫽13) lack power to distinguish true genetic signals from random associa-tions. However, it is worth mentioning that the CXB panel still reserves power for candidate gene testing where the regions studied are small.
The probabilities presented above for a genome-wide perfect match may be conservative since the true mark-ers are correlated rather than independent; the proba-bilities for a genome-wide match may be less than those where all markers are independent. To be more realis-tic, simulations were performed in which a marker picked at random from the genome was permuted and tested for being a perfect match with all other markers. However, similar conclusions are drawn and the CXB panel still shows lack of power to distinguish true genetic signals from random associations while the AXB/BXA Figure5.—Significance thresholds and permutation
distri-bution of LOD scores for CXB RIXs. (A) Simulations performed and the BXD reserve the power.
for RIXs generated from CXB as described in Figure 4. (B) Per- Empirical analysis of CXB RIs and RIXs:To provide mutation results using body weight to identify the 95th percen- experimental support for the power of RIX analysis, as tile threshold. The solid line is the maximal unpermuted LOD
well as the problems associated with small RI panels, we score. The dotted line is the 95th percentile. Solid and dotted
generated a complete nonreciprocal set of 78 RIXs along lines overlap in B.
with 14 reciprocal RIX hybrid genomes from the 13 CXB RI lines (Table 1). We phenotyped 2891 individuals (900 RIs, X ⫽69; 1714 RIXs, X ⫽ 22; 277 reciprocal RIXs, pattern appears not to depend on the particular values
of2
aor2e, we considered the case wherea2or2eis very X⫽ 20) for adult body and brain weight, both known
to be under complex genetic control. Additionally, 184 small. This scenario corresponds to the case in which
there is no polygenic or random error, an ideal situa- CXB F2mice were generated and phenotyped for
experi-mental comparison with the RI/RIX results. tion with only one QTL and no error. Under this
sce-nario, the responseYn⫻1(nis the number of lines) is a When the parental RI lines were used to map QTL
regulating body or brain weight, specific loci were de-binary vector for the RI case whereYi⫽aMqtli and where
Mqtli 僆 {⫺1, 1} is the QTL genotype of straini. Without tected (Figures 6 and 7). As would be expected from the
small size of the CXB panel, numerous loci are strongly loss of generality, we leta⫽1 so thatYi僆{⫺1, 1}. Now
we permute Y and fit Y to each of the markers indi- associated with the phenotypes. However, there is a gen-eral correlation between the body and brain mapping vidually. The measure of association (like LOD scores
or correlations) will be maximized when any markerM results using RIs and those using RIXs, with the RIXs providing significantly higher LOD scores. Although is a perfect predictor ofY.M is a perfect predictor of
Ywhen the value ofYicompletely determinesMi. That some of these loci are predicted to be false positives
as described above, many of the body weight QTL do is, ifYi⫽Mifor allior ifYi⫽ ⫺Mifor alli, then marker
Mis a perfect predictor ofY. IfYis a random vector of colocalize with locations of verified QTL regulating body weight (PompandNielsen1999).
independent Bernoulli random variables withP⫽0.5,
then the probability of a perfect match between any Interestingly, a comparison between the RI and RIX results with an F2 validation cross revealed significant
likewise random marker would be 2⫺(n⫺1). If the markers
were both random and uncorrelated, then the proba- similarities but also differences. For body weight, a ma-jor locus on chromosome (chr.) 4 is detected with all bility of Y being a perfect match with any one of m
makers would be 1⫺(1⫺2⫺(n⫺1))m. For CXB with 382 three approaches. However, two highly significant QTL
detected in the F2, on chrs. 6 and 12, were not detected
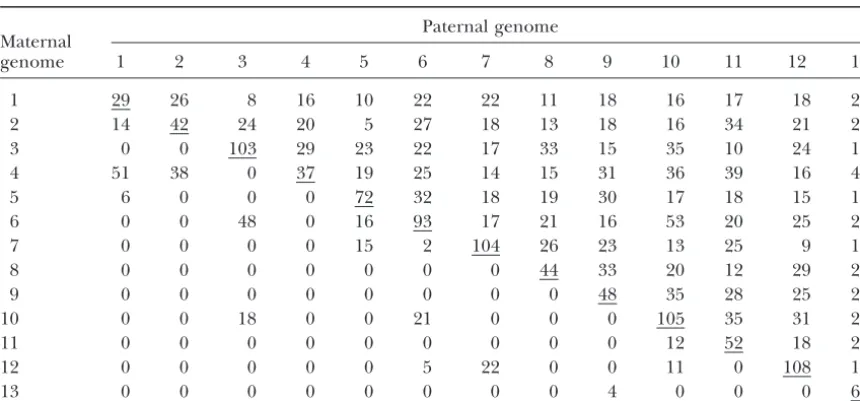
TABLE 1
Numbers of individual CXB RI and RIX genomes used in the analyses
Paternal genome Maternal
genome 1 2 3 4 5 6 7 8 9 10 11 12 13
1 29 26 8 16 10 22 22 11 18 16 17 18 25
2 14 42 24 20 5 27 18 13 18 16 34 21 22
3 0 0 103 29 23 22 17 33 15 35 10 24 15
4 51 38 0 37 19 25 14 15 31 36 39 16 44
5 6 0 0 0 72 32 18 19 30 17 18 15 18
6 0 0 48 0 16 93 17 21 16 53 20 25 26
7 0 0 0 0 15 2 104 26 23 13 25 9 14
8 0 0 0 0 0 0 0 44 33 20 12 29 25
9 0 0 0 0 0 0 0 0 48 35 28 25 21
10 0 0 18 0 0 21 0 0 0 105 35 31 20
11 0 0 0 0 0 0 0 0 0 12 52 18 22
12 0 0 0 0 0 5 22 0 0 11 0 108 16
13 0 0 0 0 0 0 0 0 4 0 0 0 63
Underlines indicate RI strains. Numbers below the RI diagonal are for reciprocal crosses.
by the RI or RIX analyses. Likewise, several significant identical reciprocal RIXs. For example, CXB1⫻CXB2 RIX animals are typically 2.2 g heavier than CXB2 ⫻ loci were detected in the RI and RIX that were not
de-tected in the F2. A similar finding occurred with brain CXB1 RIX animals, even after correction for litter size
and the mother’s parity (data not shown). In contrast, weights, where the single significant locus detected in
the F2was also detected in the RI and RIX. Contrastingly, body weights of the CXB1 and CXB2 mothers do not
differ significantly. numerous highly significant loci were detected for brain
weight in both the RI and the RIX, with the RIX detect- The 10 reciprocal RIXs with at least 10 offspring from each reciprocal cross were tested for parental effects (Ta-ing more putative loci that were not replicated in the F2.
Permutation results using the body weight data dem- ble 2). For body weight, four reciprocal RIXs gave highly significant differences (P⬍0.005) while for brain weight, onstrate that the CXB RIX lacks power to distinguish true
QTL from random associations since the maximal un- three reciprocal RIXs were highly significant. Unlike con-ventional F1hybrids between two inbred strains, the
re-permuted LOD score is identical to the 95th percentile
of the permuted LOD scores (Figure 5B); this verifies ciprocal RIX hybrids have identical mitochondrial ge-nomes and also share the same sex chromosomes. The the simulation results previously described.
Further-more, these results show that the banded pattern pro- conclusion that emerges from this comparison is that trait means derived from conventional inbred strains duced by the permutations and observed in the
simu-lated data is not an artifact of the simulation but rather can be modulated to a great extent by parental origin effects. The RIX design exposes this parental effect and due to the inadequate power of the CXB set. As such,
the additional loci detected in the CXB RI and RIX, also makes it possible to reduce its impact on a mapping study by using means derived from the two reciprocal although potentially valid, may also be due to spurious
associations with random markers. However, it is also RIXs. Consequently, if specific loci are contributing to the parental effect, they should be mappable in a set important to realize that although the same parental
strains were used for the F2validation cross as were used of reciprocal RIXs.
Comparison of inbred and hybrid trait means: Previ-to generate the CXB RI set, they have been separated
by an interval of⬎25 years. Thus, the failure to exactly ous studies comparing inbred lines and their hybrid off-spring have shown that environmental variance increases replicate all positive signals could also be related to
ge-netic drift since the development of the CXB RI lines. with inbreeding, where decreased heterozygosity likely causes increased developmental sensitivity or decreased
Parental origin effects:Fourteen reciprocal RIX
hy-brids were also tested to determine the power to detect environmental buffering capacity (Leamy1982a,b). Con-sistent with these results, the variance for the body and parental origin effects. We found that parental effects,
contributed by either maternal uterine or nursing envi- brain weights in RIX hybrids is 10–20% lower, on aver-age, when compared to the parental RI lines (Figure 8). ronments or parental origin of alleles, are a particularly
Figure6.—Localization of body weight QTL. Results for are shown (B) RIs and (C) RIXs generated from CXB and (D) F2’s from the same parental strains compared to (A) locations of known body weight QTL. Body weight data were adjusted for age, sex, and the interaction between age and sex. Lines in A are regions known to harbor body weight QTL detected in crosses from many different strains. Lines in B–D represent LOD scores. Dotted lines distinguish individual chromosomes. The significance thresholds determined from permutations are not marked since they are higher than any of the resulting curves.
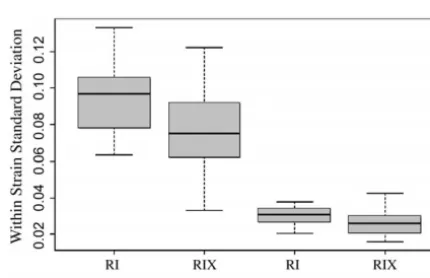
are 0.094 and 0.076, respectively. Similarly, for brain pairs of RI lines, increase the number of available geno-types fromLRIs toL(L⫺1)/2 nonreciprocal RIXs or weight, the standard deviations for RIs and RIXs are
0.030 and 0.026, respectively, after adjusting for the ef- L(L⫺1) using the reciprocal RIXs. RIXs do not need to be genotyped since their genotypes can be inferred from fects of sex, age, and body weight. The difference in trait
variation between RIs and RIXs suggests that fewer RIX the parental RIs. Similar to the parental RIs, experimen-tal error and environmenexperimen-tal variance can be greatly re-individuals are needed compared to RIs to minimize
non-genetic variance (Crusio2004). Thus maternal modula- duced by testing many isogenic RIX animals and data are cumulative, enabling multivariate analyses across phe-tion and developmental noise will have a greater impact
on standard RI line means than on the hybrid RIX notypes, environmental conditions, and developmental timing. Unlike the parental RIs, the genetic structure progeny, probably because the hybrid F1’s as described
are demonstrably better buffered against nongenetic of an RIX resembles that of an F2animal, reducing
phe-notypic anomalies associated with inbred genomes. Like-sources of variation.
wise, a set of RIXs closely resembles a set of F2progeny,
with a 1:2:1 segregation ratio of genotypes permitting DISCUSSION
both additive and dominance effects to be detected and measured. Unlike either RI or F2populations, parental
Recombinant inbred intercrosses, produced by
de-Figure7.—Localization of brain weight QTL. Results for (A) RIs and (B) RIXs generated from CXB and (C) F2’s from the same parental strains are shown. Brain weight data were adjusted for age, body weight, sex, and the interactions between age and sex and sex and body weight. Lines represent LOD scores. Dotted lines distinguish individual chromosomes. The significance thresholds determined from permutations are not marked since they are higher than any of the resulting curves.
tected using RIXs generated from reciprocal crosses be- and Botstein1989) and regression interval mapping
(HaleyandKnott1992). Also in our simulations, we
as-tween RI pairs. All these attributes suggest that the RIX
approach will be highly useful for many traits, particu- sume no maternal or paternal effects and thus only nonreciprocal RIXs are simulated. However, if maternal larly those that cannot be genetically dissected with other
mapping populations. or paternal effects are suspected, reciprocal crosses can be generated and tested for those effects.
A similar approach using RI hybrids to generate
im-mortal F2populations has been performed in rice (Hua From our simulations, we can conclude that the higher
the number of parental RI strains, the greater is the
et al.2003). However, unlike the situation in mice where
limited numbers of RI lines are available, immortal F2’s chance to separate the ma jor QTL effects from
poly-genic effects. Furthermore, due to the low number of pa-can be generated from combinations of rice RI lines that
are randomly mated such that no parental sharing oc- rental CXB lines, we find that the polygenic effects fre-quently correlate with unlinked markers and largely curs in the RIXs. The analysis of this type of population
structure is identical to that for an F2population and, elevate theF- statistic or likelihood-ratio statistic under
the null hypothesis, largely a result of nonsyntenic asso-as such, does not require crosses with parental sharing
or a unique permutation analysis like that proposed ciations observed in small RI panels that will also be present in RIX progeny (Williamset al.2001); thus a here.
Although single-marker analysis was used in our simu- more stringent threshold is needed to control type I error. However, the low number of parental strains also lations, the relative high marker density of the parental
RI, and thus RIX, supports results similar to those that interferes with the permutation procedure, producing a very high threshold and essentially making the mapping would be obtained using more complicated mapping
TABLE 2
Comparison of phenotypes from reciprocal RIX offspring
Reciprocal P- value P- value
RIX cross No. of mice RIX cross No. of mice body weight brain weight
1⫻2 26 2⫻1 14 0.005 0.997
1⫻4 16 4⫻1 51 0.094 0.503
2⫻4 20 4⫻2 38 0.120 0.288
3⫻6 22 6⫻3 48 0.0004 0.166
3⫻10 35 10⫻3 18 0.000006 0.0002
5⫻6 32 6⫻5 16 0.614 0.0005
5⫻7 18 7⫻5 15 0.302 0.000007
6⫻10 53 10⫻6 21 0.005 0.046
10⫻11 35 11⫻10 12 0.382 0.082
10⫻12 31 12⫻10 11 0.514 0.101
Only RIX crosses with at least 10 offspring from each reciprocal cross are shown. Italics indicateP-values⬍0.005.
larger number of parental AXB/BXA and BXD lines, the the greater the power is for mapping QTL and with RI panels equal to or larger in size to the 22 AXB/BXA influence of polygenic effects on the LOD score under
the null hypothesis is much smaller. Additionally, the lines, RIXs can provide substantially increased power, particularly in the presence of dominance and most permutation procedure is slightly conservative and
ap-propriately controls the type I error. likely also with complex epistatic interactions as pre-viously demonstrated with the immortal F2populations
The difference in strategy represented by RIX and
RI lines was anticipated byKnappandBridges(1990). in rice (Huaet al.2003).
A variation of the immortal F2 is to use combined
Their work primarily pertained to plant genetics, where
sets of RI lines exist that number in the hundreds; this crosses sharing at least one parent in common and that generally improve the power of QTL mapping (Liuand provides a choice between changing the number of RI
strains in a QTL mapping experiment and changing Zeng2000; Zouet al.2001). Since all three RI panels used in our simulation studies share one common par-the number of individuals per strain. Knapp and Bridges
ent, C57BL/6, we plan to extend the mixed model de-argued that, for any given QTL model consisting of a
scribed here to handle RIX crosses generated from mul-specified number of QTL at mul-specified locations, the trait
tiple RI panels. We predict that by using multiple RI sets, variance can be divided into three components: (1) the
the increase in the number of parental RIs will better variance explained by the QTL in the model, (2) the
vari-differentiate the major QTL from the polygenic effects. ance explained by QTL not in the model, and (3)
non-Another major use of the RIX approach will be with genetic variance. Furthermore, they showed that
increas-the collaborative cross (CC) proposed by increas-the Complex ing the number of RI strains would decrease variances
2 and 3, whereas, increasing the number of individuals per strain would decrease only variance 3. Further work suggested that the number of F2 individuals required
to produce a similar power provided by a panel of RIs is inversely proportional to the heritability of the trait in the RI lines (Belknap1998). Consequently, a major bene-fit of RIXs is expected for QTL with low heritabilities. Previous studies have suggested that the effectiveness of RI strains in identifying and mapping QTL is limited. Our simulations imply that with RIXs, caution is needed as well, especially when starting with small numbers of parental RI lines, because of nonsyntenic associations be-tween independent RI lines as described above. For ex-ample, CXB may not be a good source for genome-wide
QTL mapping, using either RI or RIX. Nonetheless, the Figure 8.—Distribution of phenotypic variance. Within-strain variance for body and brain weights from RIs and RIXs RIX approach, even for small numbers of RI lines, is
generated using the CXB phenotypic data. Data were adjusted still suitable for ad hoc testing of specific allele
combina-as described in Figures 6 and 7. Plots represent the range of tions to support other genetic data; this is achieved by maximal standard deviations within each representative set making virtual, segregating congenics in the target inter- while shaded boxes show mid-50th percentiles and boldface
Trait Consortium (CTC) (Threadgill et al.2002). A We thank members of our labs for helpful suggestions and critical ma jor goal of the CTC is to establish a community re- review of this article. This work was supported by National Institutes of Health (NIH) grants CA079869, ES011391, and CA105417 to D.W.T.;
source that consists of 1000 multiparental RI lines that
MH070504 to F.Z.; and MH062009, AA013499, and EY01299 to R.W.W.
will support complex trait analysis. With such a large
We also acknowledge the intellectual support provided by the
Univer-pool of RI lines, immortal F2’s could also be considered. sity of North Carolina Center for Environmental Health and
Suscep-In addition to the examples provided above, RIX tibility (ES010126) and the Lineberger Cancer Center (CA016086). panels will significantly improve our ability to geneti- J.A.L.G. is a Howard Hughes Medical Institute Predoctoral Fellow.
cally dissect complex gene-environment interactions. The ability to replicate large numbers of different ge-nomes will facilitate the genetic dissection of
epidemio-LITERATURE CITED logical characteristics that until now could be described
Amos, C. I., 1994 Robust variance-components approach for assessing
only at the population level. Rather, the identification
genetic linkage in pedigrees. Am. J. Hum. Genet.54:535–543.
of specific genomic regions interacting with environ- Bailey, D. W., 1971 Recombinant-inbred strains. An aid to finding
identity, linkage, and function of histocompatibility and other
mental variables will allow population partitioning to
genes. Transplantation11:325–327.
test the level of the interaction on defined groups on
Basten, C. J., B. S. WeirandZ-B. Zeng, 1994 Zmap—a QTL
cartog-the basis of genotype. Classical uses of recombinant rapher, pp. 65–66 inProceedings of the 5th World Congress on Genetics Applied to Livestock Production: Computing Strategies and Software,
model organisms have primarily been used to study very
edited by C.Smith, J. S.Gavora, B.Benkel, J.Chesnais, W.
Fair-coarse traits like morphometric characteristics or
re-fullet al.Organizing Committee, 5th World Congress on
Genet-sponse to nongenetic factors. However, with the devel- ics Applied to Livestock Production, Guelph, Ontario, Canada.
Belknap, J. K., 1998 Effect of within-strain sample size on QTL
opment of sophisticated quantitative molecular tools
detection and mapping using recombinant inbred mouse strains.
like gene expression profiling with microarrays and pro- Behav. Genet.28:29–38.
teome analysis with mass spectrometry, traits can be dis- Broman, K. W., H. Wu, S. SenandG. A. Churchill, 2003 R/qtl: an extensible QTL mapping environment. Bioinformatics19: sected at the molecular level through genetical
geno-889–890.
mics (JansenandNap2001). Because of the innate noise Burr, B., F. A. Burr, K. H. Thompson, M. C. AlbertsonandC. W. present between individuals using these high-through- Stuber, 1988 Gene mapping with recombinant inbreds in
maize. Genetics118:519–526.
put approaches, having the ability to replicate
individu-Churchill, G. A., andR. W. Doerge, 1994 Empirical threshold
als, such as can be done with RI and RIX genotypes, will values for quantitative trait mapping. Genetics138:963–971. dramatically improve the sensitivity for detecting and Crusio, W. E., 2004 A note on the effect of within-strain sample
sizes on QTL mapping in recombinant inbred strain studies.
genetically definingcis- andtrans-regulated gene
inter-Genes Brain Behav.3:249–251.
action networks. Other studies that are currently not Darvasi, A., 1998 Experimental strategies for the genetic dissection possible because of the limited number of replicable of complex traits in animal models. Nat. Genet.18:19–24.
Dux, A., O. MuhlbockandD. W. Bailey, 1978 Genetic analyses
genomes (RI, inbred) or because of high phenotypic
of differences in incidence of mammary tumors and reticulum
variation include traits with low heritabilities and those cell neoplasms with the use of recombinant inbred lines of mice. that have multivariant characteristics. J. Natl. Cancer Inst.61:1125–1129.
Fry, J. D., S. V. Nuzhdin, E. G. PasyukovaandT. F. Mackay, 1998
Although not computed here, the marginal averages
QTL mapping of genotype-environment interaction for fitness
of each RI strain could be used to generate haplome in Drosophila melanogaster. Genet. Res.71:133–141.
phenotypes to test the robustness and influence of ge- Goldgar, D. E., 1990 Multipoint analysis of human quantitative genetic variation. Am. J. Hum. Genet.47:957–967.
netic background on specific allele combinations. This
Groot, P. C., C. J. Moen, W. Dietrich, J. P. Stoye, E. S. Landeret al.,
could be achieved by using the mean phenotypic values 1992 The recombinant congenic strains for analysis of multi-for each parental RI line averaged across all RIX prog- genic traits: genetic composition. FASEB J.6:2826–2835.
Haley, C. S., andS. A. Knott, 1992 A simple regression method
eny of the RI instead of the actual RI strain value. For
for mapping quantitative trait loci in line crosses using flanking
example, the average of RIX12, RIX13, . . . , RIX1Lcould markers. Heredity69:315–324.
be used as the trait mean for RI1. Hua, J., Y. Xing, W. Wu, C. Xu, X. Sunet al., 2003 Single-locus
heterotic effects and dominance by dominance interactions can
No other population structure, such as CSS lines, RCS,
adequately explain the genetic basis of heterosis in an elite rice
or heterogeneous stock lines, provide the robust breadth hybrid. Proc. Natl. Acad. Sci. USA100:2574–2579.
of unique genomes in combination with the ability for Jansen, R. C., andJ. P. Nap, 2001 Genetical genomics: the added value from segregation. Trends Genet.17:388–391.
genome replication. Like RIXs, these other mapping
pop-Johnson, T. E., andW. B. Wood, 1982 Genetic analysis of life-span
ulations have particular strengths and weaknesses. How- in C. elegans. Proc. Natl. Acad. Sci. USA79:6603–6607. ever, the global advantage of RIXs over these other pop- Knapp, S. J., andW. C. Bridges, 1990 Using molecular markers to
estimate quantitative trait locus parameters: power and genetic
ulations for complex genetic structures is due to their
variances for unreplicated and replicated progeny. Genetics126: unique combination of replicability and broad genetic 769–777.
representation of a defined genetic background that will Korstanje, R., andB. Paigen, 2002 From QTL to gene: the harvest begins. Nat. Genet.31:235–236.
be critical when expanded studies are brought to
frui-Lander, E. S., andD. Botstein, 1989 Mapping Mendelian factors
tion to address complex genetic and nongenetic trait underlying quantitative traits using RFLP linkage maps. Genetics 121:185–199.
Leamy, L., 1982a Morphometric studies in inbred and hybrid house 2004 Genetic dissection of complex traits with chromosome substitution strains of mice. Science304:445–448.
mice. I. Patterns in the mean values. J. Hered.73:171–176.
Swank, R. T., andD. W. Bailey, 1973 Recombinant inbred lines:
Leamy, L., 1982b Morphometric studies in inbred and hybrid house
value in the genetic analysis of biochemical variants. Science181:
mice. II. Patterns in the variances. J. Hered.73:267–272.
1249–1252.
Lincoln, S. E., M. J. DalyandE. S. Lander, 1992 Mapping genes
Taylor, B. A., andS. J. Phillips, 1995 Typing recombinant inbred controlling quantitative traits with MAPMAKER/QTL. Technical
mouse strains for microsatellite markers on chromosomes 10, 16, Report, Whitehead Institute, Cambridge, MA.
18, 19, and X. Mamm. Genome6:493–498.
Liu, Y., andZ-B. Zeng, 2000 A general mixture model approach
Threadgill, D. W., K. W. HunterandR. W. Williams, 2002 Ge-for mapping quantitative trait loci from diverse cross designs
netic dissection of complex and quantitative traits: from fantasy involving multiple inbred lines. Genet. Res.75:345–355.
to reality via a community effort. Mamm. Genome13:175–178.
Manly, K. F., R. H. Cudmore, Jr. andJ. M. Meer, 2001 Map Manager
van Zutphen, L. F. M., M. den Bieman, A. LankhorstandP. Demant, QTX, cross-platform software for genetic mapping. Mamm.
Ge-1991 Segregation of genes from donor strain during the produc-nome12:930–932.
tion of recombinant congenic strains. Lab. Anim.25:193–197.
Nadeau, J. H., andW. N. Frankel, 2000 The roads from phenotypic
Visscher, P. M., andC. S. Haley, 1996 Detection of putative quanti-variation to gene discovery: mutagenesis versus QTLs. Nat. Genet.
tative trait loci in line crosses under infinitesimal genetic models.
25:381–384.
Theor. Appl. Genet.93:691–702.
Nadeau, J. H., J. B. Singer, A. MatinandE. S. Lander, 2000
Analys-Watson, J., R. RibletandB. A. Taylor, 1977 The response of ing complex genetic traits with chromosome substitution strains.
recombinant inbred strains of mice to bacterial lipopolysaccha-Nat. Genet.24:221–225.
rides. J. Immunol.118:2088–2093.
Plomin, R., G. E. McClearn, G. Gora-MaslakandJ. M.
Neider-Williams, R. W., J. Gu, S. QiandL. Lu, 2001 The genetic structure
hiser, 1991a An RI QTL cooperative data bank for recombinant
of recombinant inbred mice: high-resolution consensus maps for inbred quantitative trait loci analyses. Behav. Genet.21:97–98.
complex trait analysis. Genome Biol.2:research0046.0041–0046.
Plomin, R., G. E. McClearn, G. Gora-MaslakandJ. M.
Neider-0018.
hiser, 1991b Use of recombinant inbred strains to detect Xu, S., 1998 Mapping quantitative loci using families of line crosses. quantitative trait loci associated with behavior. Behav. Genet.21: Genetics148:517–524.
99–116. Yandell, B. S., 1997 Practical Data Analysis for Designed Experiments.
Pomp, D., andM. K. Nielsen, 1999 Quantitative genetics of energy Chapman & Hall/CRC Press, London/New York/Boca Raton, FL. balance—lessons from animal models. Obes. Res.7:106–110. Zhu, J., andB. S. Weir, 1996 Mixed model approaches for diallel
Reiter, R. S., J. G. Williams, K. A. Feldmann, J. A. Rafalski, S. V. analysis based on a bio-model. Genet. Res.68:233–240. Tingeyet al., 1992 Global and local genome mapping in Arabi- Zou, F., B. S. YandellandJ. P. Fine, 2001 Statistical issues in the dopsis thaliana by using recombinant inbred lines and random analysis of quantitative traits in combined crosses. Genetics158: amplified polymorphic DNAs. Proc. Natl. Acad. Sci. USA 89: 1339–1346.
1477–1481.