CARTER, LYCIA ANNE. Predicting Managerial Performance in Law Enforcement: The Impact of Work Setting and Rater Position. (Under the direction of Mark A. Wilson.)
PREDICTING MANAGERIAL PERFORMANCE IN LAW ENFORCEMENT: THE IMPACT OF WORK SETTING AND RATER POSITION
by
LYCIA ANNE CARTER
A dissertation submitted to the Graduate Faculty of North Carolina State University
in partial fulfillment of the requirements for the Degree of
Doctor of Philosophy
INDUSTRIAL/ORGANIZATIONAL & VOCATIONAL PSYCHOLOGY
Raleigh 2004
APPROVED BY:
___________________________ Chair of Advisory Committee
____________________________ ___________________________
____________________________
Dedicated to my parents Robert and Phyllis Carter,
Biography
Lycia Anne Carter was born on May 25, 1962 in Brockton, Massachusetts, the hometown of Rocky Marciano. Lycia was the youngest of Robert and Phyllis Carter’s seven children. She attended public schools and graduated from Brockton High School in 1980. From 1980 to 1981, Lycia attended Clark University in Worcester, Massachusetts. In 1982, she transferred to the University of Massachusetts at Amherst.
Fascinated by human behavior and individual differences, Lycia decided to major in psychology. Initially, the physiological basis for human behavior captivated her attention and she pursued the neuroscience curriculum available to psychology majors. While at UMass, she conducted research on circadian rhythms with Dr. Richard Gold, minored in Latin, and had the pleasure of reading Virgil’s Aneid as well as works by Pliny and Cicero in the original Latin.
Lycia became interested in Industrial/Organizational Psychology after experiencing first hand the impact of low job satisfaction and low morale on the psychological health of employees during a summer job. During her senior year, she took two courses in Industrial/Organizational Psychology. One year after graduating from UMass, cum laude, she began a Master of Science degree at NC State University in Raleigh, completing it in December of 1989 under the direction of Dr. J. W. Cunningham.
conducting job analyses and developing assessment centers. That same year, she was married to Matthew Goodwin and they had their first child, Noah, in 1996.
Inspired by her boss at ASI, Dr. Seymour Adler, Lycia decided to return to graduate school to pursue her doctorate. In 1997, she returned to NC State and began working on her Ph.D., initially under the direction of Dr. J. W. Cunningham and, upon his retirement, under the direction of Dr. Mark Wilson.
During her doctoral studies at NC State, Lycia continued to develop professionally by telecommuting for ASI, working as an intern at the North Carolina State Highway Patrol, and working with Dr. Mark Wilson on the State Bureau of Investigation Selection Validation Research Project. In October 2001, Lycia accepted the position of Assessment Analyst with the NC State Highway Patrol, overseeing the promotion and performance management processes for sworn members.
Since March of 2004, Lycia has been the Director of Testing and Standards at the Metropolitan Police Department in Washington, D.C. where she is in charge of all promotion and internal selection programs, as well as the performance management process, for the Department’s 3800 law enforcement officers.
Acknowledgements
As those of you who have completed doctorates know, it is a difficult endeavor made easier by the support and encouragement of many people. I have been fortunate to have many people in my life that have been willing to help me achieve my goal of earning a Ph.D. Mine and my husband’s families have been there for us in many ways, and without them, this wouldn’t have been possible. My friends have also been a source of encouragement, cheering me on to the finish line.
But, the person who deserves the most recognition for supporting me in my academic accomplishments is my husband, Matthew Goodwin. It has not been an easy road for either of us but especially for Matthew. He left his job in the diamond industry in New York City to relocate to Raleigh, North Carolina, knowing that there was no diamond industry there. He has taken the kids to visit family when I really needed to study for final exams. He has reassured me that I could, in fact, pass my prelims, and that I would, in fact, finish my dissertation; and, he has listened to, and commiserated with, my complaints.
Whenever people discovered that I was working full time, had four children and working on my dissertation, they would inevitably ask, “how do you do it?” My answer was always the same - I couldn’t do it without my husband.
coining the classic phrase, “Brown Stephanie and Yellow Stephanie,” as a method of distinguishing between Stephanie Tarrant and Stephanie Sloan, respectively. He has made me happy and driven me crazy, but most of all made me really proud, especially when he announced that he wanted to be a “psylogochist” when he grows up.
Kelley Krokos has been a true friend to me during graduate school. She has been a source of companionship and understanding from the beginning. She convinced me not to bail during those first, panicky weeks in 1997 (when I couldn’t help but wonder, “What was I thinking?”), she was my study partner through all the courses we had together, including the ‘semester from hell’ and the two classes with Dr. Drewes, and she was there for me and my family in many other ways.
Table of Contents
List of Tables ... ix
List of Figures... x
Introduction... 1
Predicting Managerial Performance ... 4
Defining Managerial Job Performance ... 5
Relative weight of components to overall job performance ... 10
Work Context... 11
Integrating predictors and criterion... 12
Summary and Research Questions... 14
Method ... 16
The Promotion Process ... 16
The Policy and Law Exam... 17
The Pre-Supervisor Video Course Exam... 18
The Certification Boards... 19
Performance Appraisal... 20
Education and Experience... 20
Physical Fitness Assessment... 21
Interview Boards... 21
Calculating the Promotion Score ... 22
Sample... 22
The Rating Form ... 25
Procedure ... 30
Analyses and Results ... 31
Predictive Validity of the Promotion Process... 33
Policy-capturing and Relative Weight Analysis... 38
Discussion... 44
Predictive Validity of the Promotion Process... 45
Policy-capturing and Relative Weights ... 50
Integrating the Model... 52
References... 55
Appendix A. Factor structure of promotion process components ….…...………..94
Appendix B. Summary of SME Panel Results………96
Appendix C. Rating Form... 100
Appendix D. Performance Dimensions and Behavioral Statements ... 104
List of Tables
Table 1. Components of the promotion process and their weights... 62
Table 2. Integrated Model of Performance: constructs and manifest variables... 63
Table 3. Reliability coefficients for Policy and Law tests ... 64
Table 4. Reliability coefficients for Pre-supervisor Video Course test ... 65
Table 5. Calculating the Total Promotion Score... 66
Table 6. Summary of Regression Analysis for Research Question 1 ... 67
Table 7. Relationship between predictors and components of job performance ... 68
Table 8. Summary of Regression Analyses for Research Question 3 ... 74
Table 9. Average rating policy by rater position ... 85
Table 10. Average rating policy by work setting... 87
Table 11. Relative weight analysis ... 89
Table 12. Summary of Regression Analyses ... 90
List of Figures
Introduction
Accurate prediction of job performance is of central importance to organizations, for various reasons. Not only is it important to identify those candidates that will become successful employees but determining which incumbents will make effective supervisors is also of significant consequence. Over the years, many potential predictors of job performance have been examined. Currently, the prevailing predictors are the constructs of cognitive ability (Campbell, 1990; Hunter & Hunter, 1984), experience (Borman, Hanson, Oppler, Pulakos & White, 1993), and personality (Barrick & Mount, 1991).
Predicting performance is important, but no more so than a clear understanding of what performance is. In recent years, several models demonstrating the multidimensional nature of job performance have emerged (e.g. Campbell, McHenry & Wise, 1990; Motowidlo & Van Scotter, 1994; Murphy & Shiarella, 1997; Wilson & Grant, 1997). Currently, three broad components are thought to define the performance domain: task performance, citizenship performance and counterproductive performance (Rotundo & Sackett, 2002).
subordinates. Although the number and level of managerial performance dimensions may vary, it is clear that most researchers support the multidimensionality of managerial performance (Fleishman, Zaccaro & Mumford, 1991).
In addition to identifying the predictors of job performance and defining the criterion itself, research has focused on combining these two streams, resulting in various integrated models (Viswesvaran & Ones, 2000). In the early stages of development, these integrated models typically showed general cognitive ability as predicting task performance (Hunter, 1986) and some facet(s) of personality, often conscientiousness, as predicting citizenship performance (Borman & Motowidlo, 1997). However, the relationships between the predictors and the criterion are most likely more complex (Viswesvaran & Ones, 2000).
A major purpose of the current research is to identify the predictive validity of a content-valid promotion process currently in use in a large state police organization in the southeast. As the development of the promotion process was influenced by research on integrated models of job performance, determining its predictive validity may not only help the organization improve its success in selecting supervisors, it may provide additional support for the three-dimensional, integrated model of job performance that influenced its development.
In order to achieve the purposes of this study, predictors and definitions of managerial performance are discussed, followed by a brief discussion of integrated models of job performance. Next, the relative impact of the components of job performance on overall performance appraisal ratings will be addressed, and finally, the impact of work context on these overall ratings will be examined.
Predicting Managerial Performance
personality characteristics, extraversion and conscientiousness, was moderated by the type of work performed. In that study, high performing managers in investigative fields, such as engineering or research and development, scored lower on measures of extraversion than low performing managers in these same occupations. Conversely, high performing manages working in occupations requiring social skills (e.g. personnel and sales) scored higher in extraversion than their low performing counterparts. Conscientiousness also differentially predicted the performance of managers in different fields. Managers performing well in creative fields (e.g. advertising) scored lower on conscientiousness than high performing managers in conventional fields (e.g. accounting). These results indicate that personality can be a valid predictor of managerial performance, however support for a general theory that specific personality characteristics, such as conscientiousness or extraversion, are predictive of managerial performance across all occupations is not supported.
Defining Managerial Job Performance
cumbersome and confusing. Therefore, using overall performance ratings can help to simplify these decision-making processes.
Many organizations continue to collect and utilize supervisory evaluations of overall job performance, yet over the past decade I/O research has focused on the multi-dimensional nature of the job performance construct. Models of job performance have emerged that conceptualize job performance as task performance and another kind of performance, referred to in the literature as extra-role performance (Werner, 1994), contextual performance (Borman & Motowidlo, 1997) organizational citizenship behavior (Organ & Ryan, 1995), and most recently, Citizenship Performance (Rotundo & Sackett, 2002). Task performance has also been broken down into job knowledge (declarative knowledge) and execution of the job (procedural knowledge and skill) (McCloy, Campbell & Cudeck, 1994; Wilson & Grant, 1997).
A third component of job performance, workplace deviance (Robinson & Bennett, 1997) has been gaining prominence in the I/O literature, especially as interest in integrity testing grows (e.g. Brown & Cothern, 2002; Murphy 2000; Luther 2000; Ones & Viswesvaran, 2001). Workplace deviance, also labeled counterproductive performance (Rotundo & Sackett, 2002) and organizational misbehavior (Vardi & Wiener, 1996) is, in some respects, the antithesis of citizenship performance. While definitions of citizenship commonly include descriptions such as, “positively contributes to the…of the organization” counterproductive performance is seen as negatively contributing to the organization in some way.
Vardi and Weiner (1996, pp. 153) define organizational misbehavior as “any intentional action by members of organizations that defies and violates (a) shared organizational norms and expectations, and/or (b) core societal values, mores and standards of proper conduct.” Robinson and Bennett (1995) hold that behavior must meet four criteria in order to be considered workplace deviance. First, current members of the organization must exhibit the behavior, as opposed to members that left the organization or were never officially part of the organization. Second, the behavior must be intentional, rather than accidental or beyond the member’s control. Third, there must be an appropriate standard of acceptable behavior established against which the demonstrated behavior can be measured and determined to be deviant. Lastly, the behavior should be in violation of organizational norms rather than a transgression of a broader societal norm or law.
management have attempted to identify managerial performance dimensions (e.g. Borman & Brush, 1993; Craik et al., 2002; Shipper and Davy, 2002). Using a combination of judgmental sorting and factor analysis, Borman and Brush (1993) derived an 18-factor structure of managerial performance. Their results support a two-dimensional model of the manager job performance criterion including task performance and citizenship performance. They further delineated task performance into two types, technical task performance and supervisory task performance.
Seeking to refine the model of overall job performance even further, Conway investigated the number of factors that comprise both task performance and citizenship performance for managers. He used structural equation modeling to determine the fit of a four-factor model of managerial job performance, two factors that comprise the citizenship construct (job dedication and interpersonal facilitation) and two that comprise the task performance construct (technical/administrative performance and leadership). Van Scotter and Motowidlo (1996) also found that the interpersonal facilitation component of citizenship performance could be distinguished from task performance.
ratings in the leadership dimension, and when leadership is included in the model the results are less clear. Interestingly, Conway found that the distinctions made between citizenship and task performance vary by rating source. An analysis of peer ratings demonstrated that, when task performance was broken into leadership and technical performance, peers distinguished between both the interpersonal facilitation and job dedication aspects of citizenship performance. However, supervisor and self-ratings showed less of a distinction between citizenship performance and task performance in the four-factor model. Neither study included counterproductive performance as a distinct component in a model of managerial job performance.
behaviors such as providing advice and assisting followers with personal development (Antonakis et al., 2003).
Relative weight of components to overall job performance
Research has shown that managers do take both task performance and citizenship performance into consideration when evaluating overall performance and that these components generally have unequal influence on ratings of overall performance. For example, Van Scotter, Motowidlo & Cross (2000) found that supervisors weighted citizenship performance and task performance differently depending on the purpose of the ratings. Citizenship performance was weighted more heavily when determining the distribution of informal rewards whereas task performance was more influential in determining formal rewards. Similarly, Kiker & Motowidlo (1999) found that citizenship performance was valued more highly for high performers than for low performers. These results suggest that supervisors do differentially weight the components of task and citizenship performance and that the purpose for evaluating overall performance as well as the performance level of the individual being evaluated influences the relative weights assigned.
retail cashier, machine operator, and nurse) provided ratings on the three performance components and on overall performance based on information contained in a hypothetical performance profile. Results showed that raters tended to use all three components of performance when assigning overall performance ratings, however they varied in the relative weight assigned to each component. On average, managers in the fields of accounting and machine operator assigned the greatest weight to task performance, administrative assistant and nurse managers equally weighted task and counterproductive performance, and managers of retail cashiers weighted counterproductive performance most heavily, although citizenship was not an insignificant contributor. Moreover, the three components of performance evaluated in this study accounted for nearly two-thirds of the variance in overall performance.
Work Context
would be equally concerned with task performance and counterproductive performance since non-performance of one’s job, either due to malicious intent or lack of skill, could have a huge impact on individual and organizational outcomes (e.g. patient deaths, lawsuits against the health care provider etc.).
On the other side of the equation, research supports the idea that the type of work being done is important when trying to predict performance. Recall that Heckman (1999) found the type of work performed by managers moderated the relationship between personality characteristics and job performance. However, there has been little, if any, research conducted that investigates the impact that different work settings within a single occupation have on the relationship between predictors and the job performance criterion. Neither has research on managerial positions included counterproductive performance as a third component of the job performance criterion. Therefore, this study investigates the relative weights that supervisors assign to task performance, citizenship performance, and counterproductive performance when assigning overall ratings of managerial job performance, as well as the moderating effect of work context on the weighting of the components.
Integrating predictors and criterion
Research that focuses on how best to predict job performance, given its multidimensional nature, has resulted in several models. An oft-studied theory is that personality is a better predictor of citizenship performance while cognitive ability exhibits a stronger relationship with task performance. Supporting this theory, McCloy, Campbell & Cudeck (1994) demonstrated that cognitive ability is a sound predictor of declarative knowledge, while personality is linked to the motivation to perform. Several other studies support this theory (Hattrup, O’Connell & Wingate, 1998; Motowidlo & Van Scotter, 1994; Van Scotter & Motowidlo, 1996; Wilson & Grant, 1997). However, the relationships between predictors and criterion are not that clear cut. Yes, personality characteristics such as conscientiousness show relationships with citizenship performance but relationships between personality and task performance have also been established (Barrick & Mount, 1991; Hurtz & Donovan, 2000).
Desirability and Orderliness) while the two negative correlations were related to integrity-based dimensions (honesty). Related research by Greenberg (2002) indicated that both individual and situational determinants impact the likelihood that employees will engage in one type of counterproductive performance, theft.
Summary and Research Questions
A review of the research has shown that current models of job performance, for both non-supervisory and supervisory personnel, are multidimensional, and that a combination of personality factors, cognitive ability and experience are the best predictors of job performance, while the job performance criterion appears to be comprised of task, citizenship and counterproductive performance. The literature also indicates that the relationships between personality and job performance, and the relative weights that supervisors assign to the dimensions of job performance may be influenced by occupation or work setting. However, the research neither addresses the impact that work setting or rater position has on an integrated model of job performance, nor does it address whether adding these variables to an integrated model of job performance would account for significantly more variance. The research described in this study attempts to provide more information on integrated models of job performance and the variables that may influence them.
implementing the promotion process, for obvious reasons a true predictive validity study was not a viable method for establishing validity. As of 2003, however, the process had been in place for six years and many supervisors were promoted through the process. Therefore, data was available for the conduct of a predictive validity study. In addition to merely conducting a predictive validity study of the promotion process, the current research was designed to address some of the gaps in the supervisory job performance literature.
differently depending on the setting in which the work takes place or the position that they hold. Finally, does a model of supervisory performance that includes work context and rater position account for significantly more variation in job performance than a model without these variables.
Method
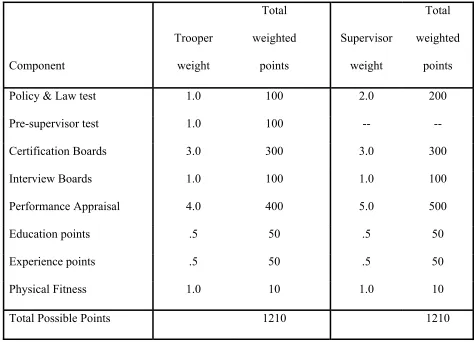
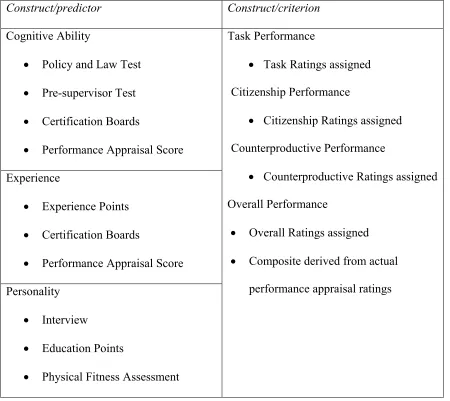
It is important to understand the promotion process in the state police organization that was studied. Table 1 contains each of the components of the promotion process, its assigned weight, and the maximum number of points that can be achieved on each component. The components of the promotion process are discussed below, followed by a discussion of the sample. The model that was tested in this study is presented in Figure 1. This model is based on the three-factor model identified by Wilson and Grant (1997). Table 2 lists the constructs identified in the model along with the components of the promotion process that served as the predictors and criterion manifest variables. These constructs and components were matched judgmentally as initially, the data was not available for any other method. However, after all of the data from the promotion process was collated, a factor analysis of the promotion scores for the supervisors in this study was conducted. The results provide strong support for the initial conceptualization of the model. The resulting factor structure is presented in Appendix A.
The Promotion Process
involves the completion of seven mandatory components, while members vying for promotion from one supervisor rank to the next complete six mandatory components. Both groups are afforded the opportunity to participate in an optional, physical fitness component that allows them to earn additional points. The components are a combination of hurdles and compensatory measures. All members must meet certain eligibility requirements to participate in the process. Troopers must have obtained the rank of Master Trooper, a rank that takes six years to achieve, and Supervisors must have two years in-rank. In addition, members must not be under disciplinary action. A discussion of each of the components of the process follows.
The Policy and Law Exam
The first two components in the process are intended to measure Declarative Knowledge. All participants must pass a rank-specific, multiple-choice examination that tests their knowledge of the organization’s policies and relevant general statutes. The 100-item test has two parts, a closed-book section and an open-book section, with the majority of the questions contained in the closed-book section. Participants must answer 70% of the questions correctly in order to remain in the process.
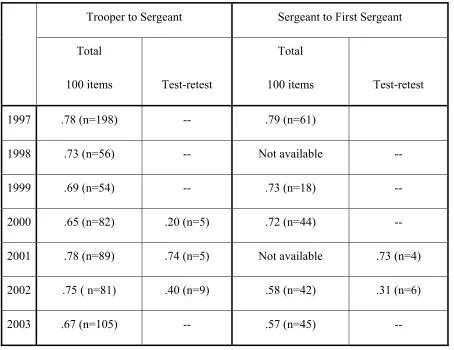
The actual items in the Policy and Law test have varied somewhat over the years, with a major shift occurring in 2000 from fact-based items to application-oriented items. The internal consistency reliability of the tests, as measured by KR20, range from .65 to .78 with a mean of .72 for the Officer rank, and .57 to .79 with a mean of .68 for the Sergeant rank.1 These reliabilities are somewhat lower than is recommended for practical purposes
(Nunnally, 1978), although four are approaching the recommended alpha-level of .80 and more than half meet the criteria of .70 for use in research.
Low reliability coefficients suggest two possibilities: they may indicate that the test is an unreliable measure of job knowledge, or they may suggest that the test is multidimensional. Unfortunately, due to the low number of both items and participants common to multiple administrations, the tests were unable to be factor analyzed to determine dimensionality.
Data was available, however, to calculate one-year, test-retest reliability coefficients (for parallel forms of the test) for three test administrations at the Officer rank, and for two at the Sergeant rank although the sample sizes were very small, ranging from four to nine. The Pearson correlation coefficients, presented in Table 3, were .20, .74 and .40 respectively for Officers and .79 and .31 for Supervisors. The low correlation of .20, between the years 1999 – 2000, may be attributable to the shift in the types of test items. The high correlations of .74 and .79, for Officers and Supervisors respectively, are likely representative of a true test-retest correlation for this sample since the tests administered during these two years were identical and were not parallel forms. Given the small sample sizes, significance in the correlations is difficult to reach. However, correlations of .74 and .79 are quite respectable and suggest that the low reliability coefficients may, in fact, be due to multi-dimensionality.
The Pre-Supervisor Video Course Exam
Troopers must pass a 50-item pre-supervisor test based on a 40-hour video course covering introductory management topics such as performance appraisal, situational leadership, conflict resolution, and communication. As with the Policy and Law test, Troopers must answer 70% of the questions correctly in order to continue in the process.
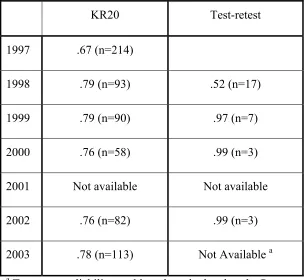
The internal consistency reliabilities of the Pre-supervisor Video Course range from .67 to .78, with an average of .76 across six test administrations. Data are not available for the pre-supervisor test administered in 2001 however, this test was identical to the test administered in 2000 therefore the reliability should be comparable.
Test-retest correlations with one-year intervals are very strong for the Pre-supervisor test. Three of the four correlation coefficients are nearing 1.0. The correlation between the first time the test was administered in 1997 to the second time in 1998 is rather low (r = .57), which may be the result of a lack of adequate preparation on the part of the test takers in 1997 as they may have not known what to expect. In 1998, at the second administration of the test, the test takers would have been more familiar with the requirements and prepared more fully. Therefore, the low correlation between the 1997 scores and the 1998 scores could reflect a difference in study time. As shown in Table 4, the majority of the reliabilities are approaching the recommended level of .80. That, combined with the extremely high test-retest correlations, suggests that this test is uni-dimensional.
The Certification Boards
rank-specific, written exercise developed by subject matter experts with assistance from the organization’s Industrial Psychologist. In addition, participants are required to perform a role-play exercise that involves counseling a subordinate. Participants at supervisor ranks, e.g. line sergeant or above, must also complete a timed in-basket exercise, a type of exercise commonly used in managerial assessment centers.
Performance Appraisal
A performance appraisal score is derived based on the individual’s performance in multiple, job-related performance dimensions. For supervisors, the performance appraisal score is an average derived from the ratings assigned to 11 performance areas. Since the job analysis indicated that these 11 performance areas are common to the job of Line Sergeant, First Sergeant and Lieutenant, they are used to determine the performance appraisal score for participants in these three ranks. For Trooper participants, the performance appraisal score is the average of ratings assigned to five performance areas identified through job analysis as common to Trooper and Supervisor positions.
Education and Experience
education points that a member has earned is then assigned a weight of one-half when calculating the Total Promotion Score, resulting in a maximum education score of 50 points.
To calculate experience points, members are awarded four points for each full year of service with the organization calculated to June 30 of the year in which the promotion process is completed. Partial years of service are calculated to the nearest full month and pro-rated points are assigned. A maximum of 100 experience points can be awarded. These points are then assigned a weight of one-half when calculating the Total Promotion Score for a maximum of 50 points.
Physical Fitness Assessment
Participants may, but are not required to, complete the Cooper Physical Fitness assessment and earn an additional 10-points for scoring at or above the 60th percentile for age and gender. The physical fitness assessment has three segments, including a one-mile run. Participants must complete all three segments within the parameters determined for the 60th percentile for their age and gender in order to earn the 10 additional points. Participation in the Physical Fitness assessment is completely voluntary.
Interview Boards
development of his/her subordinates. Eligibility for the Interview Boards is determined by the subtotal of the candidate’s score up to this point. Candidates that are within 150-points of the top scoring member of the same rank are eligible for an interview. To ensure that a sufficient number of candidates are interviewed the minimum number of interviews conducted, by rank, are as follows: 70 Troopers, 50 Line Sergeants, and 20 First Sergeants. Any candidate that falls outside of this range is no longer eligible to continue in the promotion process.
Calculating the Promotion Score
The total unweighted score for each component, with the exception of the physical fitness assessment, is 100. Each of the components is weighted and the maximum number of points that any participant may receive is 1210, including the ten additional points for the physical fitness assessment. Table 1 shows the weights assigned to each component as well as the maximum number of points that may be assigned to each component in the promotion process. Table 5 details the calculation of the Total Promotion Score for a Trooper with 10 years’ experience and a four-year degree who scored higher than the 60th percentile in the physical fitness assessment.
Sample
analysis. A detailed description of the development of the rating form will be provided in a later section.
Two sets of raters, both in distinct supervisory roles, provided ratings of task performance, citizenship performance, counterproductive performance and overall job performance for first and second line supervisors promoted through the promotion process described. The inclusion of rating source as a moderator in the three-component definition of overall job performance may help to expand our understanding of the complex nature of managerial job performance and the effect of rating source on the model.
A total of 16 lieutenants, two from each of eight troops, served as the evaluating supervisors. These lieutenants provided performance ratings of the line sergeants and first sergeants stationed in their Troop. There are currently 116 line sergeants and 51 first sergeants assigned across the eight troops. In order to maximize the sample size, two first sergeants that were promoted to lieutenant staff positions approximately eight months prior to the data collection were retained and evaluated on their position as first sergeants. Given that they were promoted into staff positions, would not be providing ratings on any of the supervisors in this study, and the period from promotion to data collection was relatively short, they were retained and evaluated on their performance as first sergeants. The final sample size is 169, and is comprised of 29 African Americans, 1 American Indian, and 139 Whites. Three of the 169 supervisors in the sample are female.
ratings, which serve as the criterion measure in this study. The scores attained by the 152 supervisors on the components of the promotion process serve as the predictors.
As stated in the research questions, one goal of this study was to determine differences in the rating strategies of two groups of supervisors in the same organization. In this organization, troop lieutenants either perform administrative duties or operations duties. By having both lieutenants rate every line sergeant and first sergeant in his respective troop, we hoped to identify differences in the assignment of the relative weights.
Work Setting
The state police organization in this study requires field personnel of equal rank to perform similar tasks. However, work settings vary widely and may impact the types of tasks performed. Members may be assigned to a district designated as ‘rural’ or ‘urban’ depending on the population density of the county in which the district is located. Districts also vary by traffic patterns and traffic density. Traffic pattern is a dichotomous variable and is operationalized as whether the District in question has an Interstate Highway that passes through it. Traffic Density is measured by the number of vehicle miles traveled (VMT) daily on different types of roads (e.g. interstate, public access routes, connectors etc.) by motorists in that District.
patrolling a rural part of a county that does not contain an Interstate. Given that variation in the work setting likely influences the tasks performed most frequently, it is possible that the relative weight managers assign to citizenship, task and counterproductive performance when determining overall performance level may also vary. If this is the case, then work-setting variables may, in turn, moderate the relationship between the predictors and the criterion. The Rating Form
The rating form used to gather performance ratings was developed from three sources. First, the task list resulting from a thorough job analysis conducted in 1997 of the positions of trooper, line sergeant, first sergeant and lieutenant was reviewed. Detailed information about the job analysis and resulting task list as well as the performance measurement system can be found in Wilson, Grant, Freund and Levine (1995) and Grant and Wilson (1996) respectively. Two I/O Psychology graduate students familiar with the line sergeant and first sergeant jobs sorted the tasks from the task list into two categories: task and citizenship performance. The task-related statements were then separated into two subcategories, task-technical and task-supervision, in order to determine which tasks are specific to the technical core of the job and which are more general, supervisory duties. Initial agreement between the two graduate students ranged from a low of 41.7% in the area of Selection and Training to a high of 100% in the areas of Citizenship, Knowledge and Application of Policy and Procedures, and Forms and Reports. Overall, agreement across the 11 performance dimensions was 78.9%.
194 tasks for which there was agreement in the initial sort, 143 were considered task-technical by the sorters. Thus, the task list developed in the job analysis certainly provided a sufficient number of technical tasks. However, there were no task statements that could be considered counterproductive, only 16 tasks were coded as citizenship by both analysts, and many of the statements considered supervision did not necessarily overlap with the definitions of leadership found in the literature.
To expand and augment the task list several sources were used. Interviews were conducted with four lieutenants in order to determine what types of behaviors would be considered counterproductive performance in this agency. Next, performance records for line sergeants and first sergeants were reviewed to identify counterproductive behaviors in which members had engaged. The research literature available on counterproductive behavior was also reviewed as were the counterproductive behaviors identified by the California Commission on POST, Patrol Officer Psychological Screening Dimensions. Using all of the information gathered, a list of 65 behavioral statements was developed that could be considered counterproductive performance.
Two objectives, often competing, must be realized in order to develop an effective performance rating form. The desire for the form to be comprehensive must be balanced against issues of rater fatigue. Designing a form that asks supervisors to rate each task performed by a job incumbent is sure to be long and cumbersome, thereby compromising the reliability and accuracy of the ratings. The optimum rating form, therefore, should balance the need to collect enough data to obtain a clear picture of job performance with minimizing rater fatigue.
To create an instrument that was psychometrically sound, five items for each of the 13 performance areas was desired, bringing the total number of items to 66, including a rating of overall performance. As many of the respondents in this study were rating between twenty and thirty supervisors, minimizing rater fatigue was paramount. Therefore, the total number of items was reduced to 48: approximately three items for each of ten performance areas identified in the job analysis, five items for the three broad components of job performance, and an overall job performance rating. Two additional items were included in order to evaluate the consistency of the ratings and to detract attention from the fact that only counterproductive performance items were negatively worded.
Two Lieutenants, three First Sergeants and three Line Sergeants were chosen to participate in the SME panel based on geographic location, ethnic background, gender, experience in a field position, and job performance. Each of the members selected had experience as field supervisors, two of the members were black and one was female. The remaining six members were white males.
The rating form and instructions were emailed to the nine SMEs along with contact information for the researcher. Participants were presented with a table containing the list of 123 statements and two blank columns. They were asked to indicate in column one the frequency and/or importance of each statement using the following scale: 5 = performed daily; 4 = performed weekly; 3 = performed less frequently than weekly but is extremely important; 2 = performed less frequently than weekly and is somewhat important; and 1 = performed less frequently than weekly and is not important.
Five of the nine SME members, two black males, one female, and two white males, completed the rating form and returned it to the researcher. Of the 123 items rated by the SMEs, 116 (94.3%) averaged a rating of ‘3’ or higher, indicating that the majority of the items captured behaviors that line supervisors perform frequently or are very important to the job. The SMEs were unanimous in their categorization of 43 of the 123 (35%) of the behaviors on the list. In total, just over half (50.5%) of the statements were categorized as “B” behaviors (the best supervisors demonstrate these), 27.6% were categorized as “W” behaviors (the worst supervisors demonstrate these) and 19.5% were categorized as “M” behaviors, indicating that most line supervisors exhibit these behaviors. Three behavioral statements were dropped as only four of the five SMEs provided categorical ratings and the categories assigned were evenly split. Two additional items were added by one SME and were retained in the final rating form. A complete summary of the subject matter expert ratings is presented in Appendix B.
The criterion established for retaining behavioral statements was an average rating of ‘3’ or greater, and majority agreement on the categorization of the item. In order to ensure that behaviors exhibited by supervisors at all performance levels could be evaluated with this form, a mix of B, W, and M behaviors meeting the established criteria were retained.
negative statements and use a frequency scale throughout. Thus, respondents ultimately assigned ratings indicating how often a member demonstrates a particular behavior, either positively or negatively phrased, rather than selecting ratings that indicate how well a respondent performs a task that is neutrally worded.
The final step in developing the performance evaluation rating form involved categorizing each of the behavioral statements into one of the 11 performance dimensions from the original job analysis and the two additional dimensions of counterproductive performance and leadership. The only performance dimension not represented by behavioral statements was Forms and Reports. Three behavioral statements were added that better depicted performance in this area as the initial job analysis simply listed forms that are typically completed in the execution of one’s duties. The final rating form is attached as Appendix C.
Procedure
Participants were provided with a stamped, self-addressed envelope, addressed to the researcher’s home address to alleviate any concerns about the confidentiality of the information, and to facilitate the return of the rating forms. Participants were allowed two weeks to complete the forms and return them to the researcher. All forms were completed and returned on time, that is, the return rate in this study for the performance rating forms was 100%.
Analyses and Results
The analyses conducted are presented in two groups. The first group focuses on the predictive validity aspect of the study and addresses research questions one, two and three. The second group focuses on the policy-capturing aspect of the study, assessing the impact that rater position and work context have on the weights assigned to task, citizenship and counterproductive performance, and the amount of variance the model accounts for with these additional variables. These analyses address research questions four and five. Unfortunately, the sample size was not large enough to utilize structural equation modeling. Therefore, multiple-regression was the primary analysis used in this study. Where appropriate, relative weight analysis (Johnson 2000) was used to provide additional information regarding the relative weights assigned to specific variables in relation to the score or evaluation of a broader variable. The analyses conducted and their results are explained in detail in this section.
after having 2-years of time-in-rank as of 1 July of the promotion cycle year. Some members reach a certain rank and choose to remain there while others enter the process as soon as they meet the eligibility criteria. In addition, members are promoted in groups, typically twice annually. Therefore, the amount of experience participants in this sample have in their current rank ranges greatly, from six months to 61 months, measured from the date of promotion to December 31, 2003.
The number of times a member participates in the promotion process prior to being promoted also varies. Some members participate multiple times before they pass the hurdles, or are ranked high enough on the Published List to be promoted, whereas others are promoted after participating only once. The number of times participating in the promotion process prior to being promoted for the members in this sample ranges from one time (n = 57) to six times (n = 2). The majority of the members in the sample participated two (n = 43) or three (n = 33) times before being promoted. It is possible that there would be differences in ability and subsequent performance such that members that have to participate more times before being promoted perform at a lower level than members who are promoted after participating only once or twice in the promotion process. Therefore, the cumulative number of times that a member participated in the process prior to being promoted will be accounted for.
with its somewhat low pass rate of about 65%. However, after collating the promotion data and recognizing that the means and standard deviations of the components varied between years, it was decided to use standardized scores in order to equalize the sample and account for these differences. The exception lies with the physical fitness component, as this is a binary variable in that a member earns 10 points for participating and achieving the 60th percentile for his/her age and gender. Members that do not participate or that do not achieve the 60th percentile are given zero points.
Predictive Validity of the Promotion Process
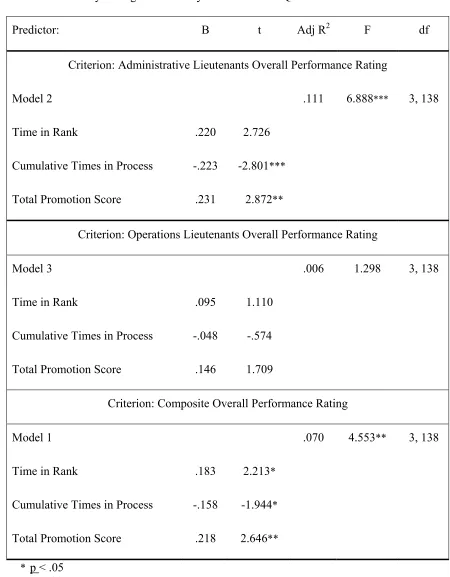
This section addresses research questions one through three, which are related to determining the predictive validity of the promotion process currently in use at the organization. In order to address the first research question, how well the components of the promotion process predict supervisory performance, the overall performance ratings assigned by the Lieutenants in the study, and reverse scored, were regressed on the entire set of promotion process components, represented by the Total Promotion Score. In addition, time in rank, as measured in months to December 31, 2003, and the cumulative number of times a member participated in the promotion process prior to being promoted to his/her current rank were accounted for in this model.
score. The results indicate that the components of the promotion process account for a significant amount of variance in performance as measured by the Overall Ratings assigned by the Administrative Lieutenants (Adjusted R2 = .111, p < .001) and as measured by the Composite Overall Ratings (Adjusted R2 = .070, p = .004). However, the relationship with the ratings assigned by the Operations Lieutenants was not significant (Adjusted R2 = .006, p = .278). The results of these analyses are presented in Table 6.
In order to determine whether a lack of variability on the part of the Operations Lieutenant ratings accounted for the difference in the significance of the models the standard deviations of the ratings of both groups were examined. Strong similarities in the standard deviations between groups were observed, and a t-test indicated that the average variability between groups was not statistically significant (p = .48). This finding suggests that the difference in the significance of the results may be attributable to rater position.
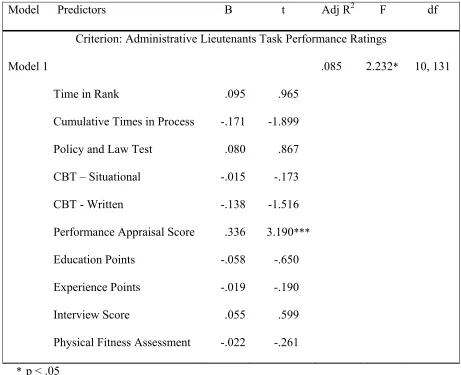
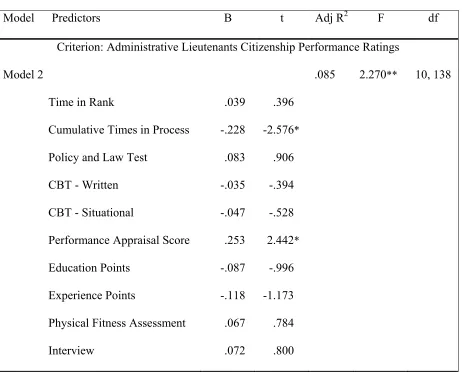
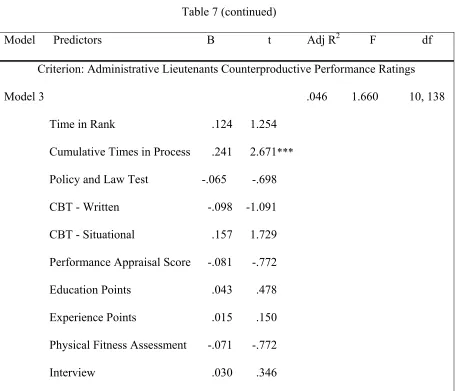
The average score for both the citizenship and counterproductive performance dimensions were derived by taking the average of the ratings of the items written to measure these dimensions. The task performance score was derived by first computing the average score for each of the 10 performance areas identified in the original task analysis plus the leadership performance area. The average dimensional ratings for these 11 performance areas were then averaged to derive the Task performance score. The items on the rating form are categorized into the appropriate performance dimension and shown in Appendix D.
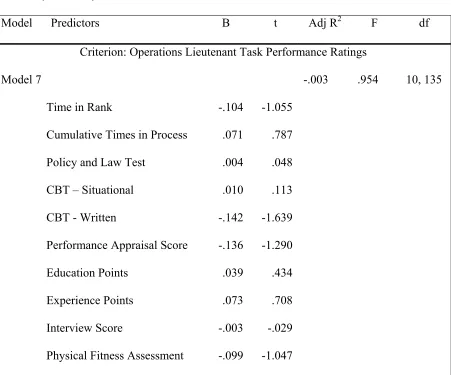
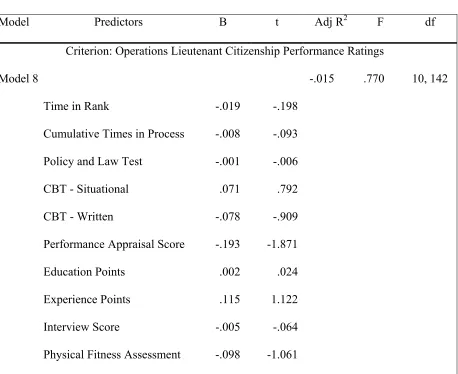
The regression analyses were conducted using the scores from the promotion process components common to both the Line Sergeant and First Sergeant ranks as the predictors. The criterion variables were the task, citizenship and counterproductive performance scores. The models utilizing the task and citizenship performance scores were significant (Task: Adj. R2 = .085, p = .02; Citizenship: Adj. R2 = .085, p = .018). However, the model in which the counterproductive score was the criterion variable was not significant at the p < .05 level (Adj. R2 = .046, p = .097). Table 7 shows the results for these analyses.
A primary concern with the conduct of so many regression analyses containing the same predictors is the increased risk of a Type 1 error (i.e. rejecting the Null Hypothesis although it is true). An alpha level of .05 indicates that approximately one out of twenty times statistical results lead to rejecting the Null hypothesis when in fact it is true. Given that, then performing 11 regressions with the same predictors may significantly increase the probability of concluding, erroneously, a significant relationship between a predictor and the criterion when the significance is actually due to chance. One approach to reducing this possibility is to apply a Bonferroni correction, a procedure in which the alpha level is adjusted downward. How much, of course, depends on the number of variables in the regression. Although the risk of a Type 1 error would be reduced with the Bonferroni correction, the drawback is that the risk of a Type 2 error is increased (i.e. accepting the Null Hypothesis when in fact it is false).
Another approach that can be used when a large data set is available is to split the sample in two, using one half to perform the initial regression analysis and the other to confirm the previous findings. Unfortunately, the projected sample size of 200 subjects was not available to us due to incumbents having been promoted prior to the implementation of the promotion process or having retired prior to the data collection process. Therefore, the Bonferroni correction was applied to the regression analysis described in this section.
cumulative number of times a member participated in the promotion process, the Certification Board Situational Exercise accounted for a significant amount of variance in the Supervision and Evaluation and Special Duties performance ratings. Education accounted for a significant amount of variance in Community Relations performance ratings; and the Interview Board accounted for a significant amount of variance in Personnel Actions and Supervision and Evaluation. The Performance Appraisal Score demonstrated a significant inverse relationship with Citizenship performance ratings, as did the Physical Fitness component with Personnel Actions ratings. The cumulative number of times that a member participated in the promotion process was significantly related to only one performance dimension, special duties, and that relationship was negative.
In addition, the variable “Time in Rank” accounted for a significant amount of variance in each of the regression models, with t-values ranging from 3.559 in the ‘Citizenship’ model to 6.304 in the ‘Personnel Actions’ model. These results indicate that, not surprisingly, supervisors with more time in rank receive higher performance evaluation ratings and may perform more effectively in the job. The cumulative number of times participating in the promotion process was not significant in any of the corrected models and, as stated, was significant in only the uncorrected model in which Special Duties ratings served as the criterion. Therefore, the number of times an individual participates in the promotion process prior to being promoted does not appear to be significantly related to the individual’s performance in the new rank. The results of these analyses are presented in Table 8.
Policy-capturing and Relative Weight Analysis
Overall performance ratings collected from the raters in the study served as the criterion in these analyses while the task, citizenship and counterproductive performance ratings derived from the individual item ratings served as the predictors. Summary statistics are provided for the group of raters as a whole and then separately by rater position and work context. This provides information as to whether, on average, the weights assigned to task, citizenship, and counterproductive performance vary by rater position and work context when evaluating overall job performance.
The results of these analyses indicate that, on average, the rating strategies between the Administrative Lieutenants and the Operations Lieutenants are similar but not identical. Task performance was weighted most heavily by both groups, although assigned relatively greater weight by the Administrative Lieutenants. For the Operations Lieutenants, citizenship performance weighed more heavily in their rating policies than it did for Administrative Lieutenants although neither group weighted citizenship performance as heavily as task performance, nor did they assign much relative weight to counterproductive performance when determining overall performance ratings. The summary statistics for these analyses are shown in Table 9.
strategies. Therefore, the districts were separated into two categories, micropolitan areas (micro) and metropolitan areas (metro). The labels for the population density categories reflect the terminology of Core Based Statistical Areas (CBSA) as established by the U.S. Office of Management and Budget in 1993. Micro areas are those that would formerly be considered rural and, in this analysis, the metro areas include those that would have been labeled either suburban or urban.
When work setting is examined in terms of population density, task performance is again weighted most heavily for both micropolitan and metropolitan areas, with citizenship receiving about half as much weight. Counterproductive performance was weighted more heavily, and the sign is negative, in the micropolitan areas, although it received little consideration in metropolitan areas. These results are presented in Table 10.
Typically, policy-capturing studies use performance profiles of hypothetical employees that have been developed specifically for the research being conducted. In true policy-capturing studies, the performance dimension scores are designed to be uncorrelated. In the policy-capturing analysis conducted in this study, actual performance ratings collected on real, not hypothetical employees, were used. As a result, the performance dimensions are highly correlated ranging from .455 to .796 (absolute values). Johnson (2000) suggests that using the relative weight analysis described in his article does not require that the performance dimensions be uncorrelated. Therefore, additional policy-capturing analyses were conducted using the relative weight analysis.
The results, presented in Table 11, are contradictory to those obtained by averaging rating policies across raters. The results of the relative weight analysis indicate that rating policies differ by rater position depending on whether or not there is an interstate present. In fact, the distribution of the relative weights for Administrative Lieutenants evaluating members that work in districts without an interstate is nearly identical to that of the Operations Lieutenants evaluating members that work in districts with an interstate. The same is true for Administrative Lieutenants evaluating members that work in districts with an interstate - the distribution of weights is nearly identical to that of the Operations Lieutenants evaluating members in districts where there is no interstate present.
However, when rating strategies are examined in terms of the work setting variable, population density, we find that the distribution of relative weights between these two groups of raters are similar with one exception. Administrative Lieutenants assign greater weight to citizenship performance and much less weight to counterproductive performance when evaluating members in metropolitan areas than do Operations Lieutenants. The distribution of the sample working in these different settings is presented in Appendix E. Members are fairly equally distributed between the two population density conditions, with 48% of the sample assigned to a district in a micropolitan area and 52% of the sample assigned to a district in a metropolitan area. With regard to the distribution of members across the traffic pattern conditions, 41% work in districts in which there is no interstate present, while 59% work in districts in which there is an interstate present.
for by the proposed model. The model described previously, in which overall job performance ratings were regressed onto task, citizenship and counterproductive performance ratings, served as the initial model (Model 1). Next, a revised model was run that included rater position (Model 2). Model 3 included the traffic pattern variable and in Model 4, the final model, the population density variable was included. In Models 2 through 4, the rater position and context variables were added last to determine if they account for additional variance.
In order to conduct the analyses that included rater position as a variable, either the Administrative Lieutenant ratings or Operations Lieutenant ratings had to be used, but not both and not a derived composite. Therefore, for this analysis, the sample was split in half, randomly, using the function available in SPSS 12.0 (2003). The Administrative Lieutenants’ ratings were used for one-half of the sample, while the Operations Lieutenants’ ratings were used for the other half. The order was determined in advance of executing the split sample command.
inclusion of the second work context variable, population density, failed to increase the amount of variance accounted for in the criterion. Population density was not significantly related to overall performance (p = .631).
overall performance of members working in micropolitan areas higher than those in metropolitan areas. Conversely, Operations Lieutenants assign higher overall performance ratings to those in metropolitan areas. These results are presented in Table 13.
In the proposal stages of this research, Hierarchical Linear Modeling (HLM) was proposed as an analytical method as HLM can provide a more powerful test to determine whether rater characteristics are predictive of their rating policies than multiple regression. Although Rotundo and Sackett (2002) found that found that certain demographic variables were related to raters’ policies using HLM, it was decided to forego this analysis. In the Rotundo et al. study, demographic variables that were not used in other analyses in the study were used in the HLM procedures. Therefore, by using HLM they were able to gather additional information as to which variables might impact a supervisor’s rating strategy. In this study however, the variables that would have been used in the HLM procedure, namely the rater position and work context variables, have already been examined using multiple regression and relative weight analysis. Therefore, it was decided to forego the HLM analysis since no new variables were to be explored.
Discussion
pertaining to the predictive validity study will be discussed first, followed by the results pertaining to models of job performance.
Predictive Validity of the Promotion Process
The promotion process in use at this state police organization may account for nearly 21% of the variability in supervisor performance ratings, when time rank and the number of times participating in the promotion process are included in the model. This is not a particularly noteworthy result, although it is statistically significant and does support the validity of the promotion process. It should be noted, however, that the results were obtained without correcting for unreliability in the predictors or the criterion, and with no corrections for range restriction.
In addition, the cumulative number of times that a member participated in the promotion process prior to promotion was significantly related to counterproductive performance and citizenship performance, where the latter relationship was negative as would be expected. A possible explanation is that members that participate in the promotion process multiple times without qualifying for a promotion may begin to feel disgruntled and engage in counterproductive behaviors. Or, it may be that these members are already engaging in counterproductive behaviors, or at the least are failing to engage in citizenship related behaviors, thereby decreasing the likelihood of earning high enough performance appraisal ratings to qualify for a promotion. Finally, time in rank demonstrated significant relationships with task, citizenship and overall performance ratings indicating, not surprisingly, that supervisors with more experience in the current rank tend to perform better.
that they were intended to predict supports both the predictive and content validity of the process.
Interestingly, Education Points demonstrated a significant relationship with the Community Relations dimension. Most likely, this relationship is the result of a common, underlying factor such as motivation. The activities associated with Community Relations involve participating in activities that are voluntary, that involve the community and that support and enhance the mission of the organization. Members that earn high ratings in the community relations dimension typically volunteer for the activities rather than being assigned them. This takes a degree of motivation because they are performed in addition to one’s regular responsibilities. As for education, most of the supervisors in this sample entered the organization with little or no post-secondary education. Often, they earned their college credits by taking classes in addition to other commitments such as work and family. Therefore, a great deal of motivation is required to earn these education points.
study receiving the highest performance appraisal ratings were high performers before being promoted and as such, they were afforded opportunities to develop the skills necessary to perform well in the next rank. That could explain why none of the components supposed to measure cognitive ability, such as the policy and law test or the written exercise of the certification boards, were significant.
recommended by the review panel is applied. Members are then afforded an opportunity to appeal the change through the Patrol Commander.
In addition to personnel costs, there are the perception costs. An employee survey conducted in 2002 indicated that only 10% of respondents agreed with the statement, ‘the promotion process is fair’ while 70% either disagreed or strongly disagreed. The majority of respondents to that same survey also disagreed with the statement, ‘members who perform better get promoted.’ In 2000, when a sample of members was asked what they liked and disliked about the promotion process, respondents indicated overwhelmingly that the performance appraisal was given too much weight in the promotion process and that, as a result, the process was ‘unfair.’
To summarize, the results of the predictive validity analyses generally support the use of the current promotion process in this organization. Overall, the total promotion score accounts for a modest, but statistically significant, amount of variance in supervisory performance; and some of the individual components are predictive of their intended performance dimensions. There are limitations with the predictive validity research. Of primary concern is the ‘criterion problem.’ Using performance ratings as the only criterion measure is somewhat limiting. There may be other aspects of supervisory performance that are not captured particularly well by the performance ratings. Perhaps activity data might capture other aspects of performance, establishing validity for other components of the promotion process or strengthening the overall predictive validity.
supported by extensive task lists. Forming dimensional ratings from a small number of items may not accurately capture the supervisors’ performance across the range of tasks associated with the dimension. Moreover, given the study’s small sample size only promotion process components common to both ranks could be used as predictors, rather than utilizing rank specific components (e.g. the Pre-supervisor test). If a larger sample could be obtained, the predictive validity analysis could be rank specific, which might possibly provide more detail regarding the effectiveness of the promotion process.
Policy-capturing and Relative Weights
order to encourage supervisors to provide honest ratings, the behavioral statements designed to measure counterproductive performance were representative of mild workplace deviance.
Results are inconclusive as to whether rater position and work context influence rating strategy. Initially, when rating policies were averaged by rater position, traffic pattern and population density, it appeared that there were few differences in the rating strategies of the two types of lieutenants. Task performance was always weighted most heavily regardless of rater position, the presence of an interstate, or the population density of the area. However, relative weight analysis indicated that the rating strategies employed by the two types of lieutenants were strikingly different when evaluating members assigned to districts in which no interstate is present. In fact, they were the mirror opposites of each other.
The nature of this relationship was obscured by taking an average rating policy within work setting rather than between raters and within work setting. These results would suggest that there is an interaction between rater position and traffic pattern. Furthermore, adding the traffic pattern variable to the regression model in which task, citizenship and counterproductive performance ratings were regressed onto overall job performance ratings resulted in a slight increase of the Adjusted R2, suggesting that traffic pattern, at the least, influences rating strategy.
lieutenants in either type of environment. However, the regression model that included population density did not account for additional variance in the criterion ratings.
The obvious limitation of this portion of the study is insufficient data to clarify the results and evaluate the interactions. Additional data should be collected and analyzed in order to determine the influence that rater position and work context have on an evaluator’s rating strategy. The sample size could be expanded by collecting data from the 2004 and 2005 promotion processes. In addition, collecting data on all first sergeants regardless of whether they were promoted through the promotion process or before its implementation would also expand the sample size and may help clarify the results.
Moreover, asking the actual rating supervisors to code their position as operations or administrative lieutenant when submitting first sergeant performance appraisal ratings would allow the actual performance data to be examined for differences in rating strategy by position and by work context. This would not result in an increased sample size but it may provide useful information since the supervisor would actually be rating his direct report and presumably, would be familiar with the subordinate’s performance.
Integrating the Model
rank and performance appraisal ratings, appears to be the best predictor of future supervisory performance. Given that the direct supervisor often controls or greatly influences the experiences available to the individual as well as his/her performance evaluation, continuing to provide extensive managerial and leadership training through AOMP may enhance the supervisors’ ability to develop his/her subordinates.
The influence of rater position and work environment is suggested on the criterion side of the model as well and reasonably so. Logically, one would expect that supervisors with different roles and responsibilities would differentially value various aspects of subordinate performance. Requiring administrative and operations lieutenants to complete, jointly, the performance ratings for their first sergeant subordinates may provide a fuller, and perhaps more accurate picture, of his/her job performance