AN ANALYSIS O F DATA ON X-RAY-INDUCED VISIBLE GENE MUTATIONS I N DROSOPHILA MELANOGASTER'
H. C. FRYER AND JOHN W. GOWEN Kansas State College, Manhattan, Kansas, and
Iowa State College, Ames, Iowa
Received August I , 1941
INTRODUCTION
T IS well known that the chromatin material of germ cells is subject to
I
spontaneous alterations. These changes may involve large sections of the chromosomes, or they may be localized about a particular gene. Since these alterations are subject to variations, both random and non-random in origin, the methodology by which this variation is analyzed becomes of major importance to any interpretation to be attached to such data.Previous irradiation experiments have shown that changes in the chro- matin can be produced artificially and a t a higher frequency than exists naturally. Differing sources and dosages of radiant energy have been used, and differing types of gene changes have been studied. All those experi- ments likewise involve, as an integral part of their interpretation, the ran- dom and the non-random variation mentioned above, and its proper analysis.
If we have a population of Drosophila in which a certain fraction, p, has mutated from the normal red eye-color to a vermilion eye-color, we say that the probability of observing a mutant fly, on one random observa- tion of this whole population, is p. If the proportion of mutants stays fixed during the period of our interest in the population, it is well known that the probability of observing exactly r mutants in a sample of size n is given by the binomial probability function
n!
(n - r)! r! p'(1 - p y .
The population is determined by p, which, however, is usually unknown. Physical or biological considerations supply certain hypotheses which are then used in the estimation of p. We then have a means of determining what we would expect to obtain during random sampling from the given population. If expectation and observation fail to agree, doubt is cast upon the adequacy of the hypotheses adopted.
For the purpose of measuring the agreement between observation and expectation, it has been thought advantageous to approximate the dis- continuous function, (I), by a continuous function. The Normal distribu-
Journal Paper No. J-914 of the IOWA AGRICULTURAL EXPERIMENT STATION, Ames, Iona Project No. 573.
MUTATION IN DKOSOPHIL.4 213 tion has been used for that purpose, but has not been shown to be a good approximation if the expected numbers, np, are small. The probabilities associated with visible gene mutations are nearly always so small that n would need to be much larger than is experimentally possible before the Normal approximation would be-in the light of present knowledge-a safe one to use in the analysis of such irradiation data. I n spite of this situa- tion, the literature on gene mutations shows that the Normal approxima- tion has been used in the classical large sample manner to test the varia- bility observed in irradiation data. It seems that the error involved in such analyses should be investigated or else a different method of analysis sought.
This paper has the dual purpose of presenting some new data on X-ray- induced, visible gene mutations and of showing how a satisfactory analysis of such data can be made by means of the
x2
distribution.HISTORICAL BACKGROUND
Due to the difficulties attending the collection of data on visible gene mutations, there is not an abundance of such data in the literature. Such data as are found are characterized by large numbers of observations and small numbers of recorded mutations. If the data are analyzed at all, the analysis is accomplished through the Normal approximation described above and upon the basis of large sample theory. These circumstances leave in doubt the conclusions drawn from the data.
The
x2
test is especially designed for enumeration data. Its purpose is to measure the agreement between the numbers actually observed and the corresponding numbers which would be expected mathematically upon the basis of certain hypotheses. Thus this test seems particularly adapted to the general nature of irradiation research on visible gene mutations. Thex2
test has two other advantages: (I) it has a form especially adapted to convenient calculation of 2 Xn classifications, and ( 2 ) its additive property enables one to accumulate evidence on rare events statistically.However, one big disadvantage has been thought to attach to the use of
x2
when small expected numbers are involved. Since an exact test is not practical on most data, it has been approximated by means of a Type I11 Pearsonian curve. This distribution is the one found in the tables. It was thought, until quite recently, that this approximation was so poor, when small numbers such as those which exist in irradiation data are used, that i t could not validly be employed.214 H. C. FRYER AND JOHN W. GOWEN
factory for a test of significance even when the expected numbers are as small as 0 . 5 . This closeness of agreement between the exact and the tabular distributions of
x2
has been demonstrated only empirically; but the validity of that demonstration has no relation to the assumptions accompanying the derivation of the tabular distribution. However the tabular values may have been obtained, they seem to give the exact distribution ofx2
very satisfactorily. These considerations plus the additive property ofx2,
which makes it possible to collect information on rare events, make it appear that thex2
test fits the purposes of irradiation research quite well.THE EXPERIMENT
Materials and methods
with each wave length, and 19 specific gene loci. tained :
(1)
( 2 )
(3
1
(4)
(5)
The experiments involved three wave lengths of radiation, two dosages The following stocks of females of Drosophila melanogaster were main-
sc ec cv v j car
+ +
+
sc v C l B
+
+
+'
+
a1d p pr
cpx
s p ru h st sr ee ca+
+
a1 C y Lqsp
Me' Sbc es+'
+ +
ru h st sr e" ca+
+ +
ru h st sr e" ca+ '
+ +
ru h st sr e" ca+
+ +
Me' Sbc e*+
+
a1d p pr
cpx sp
+ +
+
a1 C y Lqsp
+ +
- -
-.
- -
_.
- -
_.
-; and, - -
- -
- - .
Normal males from a line which had been inbred for several generations were X-rayed a t 2 4 hours, or less, of age. These Drosophila were irradiated with a gas-type X-ray tube of WYCKOFF and LAGSDIN'S (1930) general design, a description of which has been presented by PINNEY (1939). The targets were the pure metals: silver, copper, and chromium. The particular X-rays were filtered heavily by a window of palladium for the silver target, nickel for the copper target, and aluminum for the chromium target. The thickness of this window was adjusted to absorb fifty percent of the radiation.
The peak kilovoltage across the tube was different for the different metals-56.0 for Ag, 39.6 for Cu, and 34.3 for Cr-as measured by a IO cm sphere gap. The current through the tube during the irradiations was held constantly a t 1 2 . 5 milliamperes. The beam intensity a t the time of
MUTATION I N DROSOPHILA 215 Victoreen dosimeter. The ionization chamber was constructed in the IOWA
STATE COLLEGE machine shop after a design by L. E. PINNEY based upon the general plan of TAYLOR and SINGER (1930). The dosimeter was checked frequently with the ionization chamber both for accuracy and for the ab- sorption of the particular rays in the capsule housing the test chamber. The ionizstion readings for the different metals were corrected for a temperature of 2ooC, a barometer reading of 74 cm, and the loss of radia- tion due to the amount absorbed in the 5.5 cm layer of air between the surface of irradiation and the volume giving the ionizing current.
The linear absorption coefficient for the male Drosophila was determined for each wave length used. The sperm-storage organs are found throughout the abdomen, but for the purposes of X-ray dosage, average approximately the mid-position. The energy incident upon the sperm is also corrected for this loss of X-ray as they pass into the body of the fly. These corrected readings are those presented in the tables.
It is essentially true that for a constant thickness of biological material the fraction of the incident dosage absorbed by the material is a constant for a given wave length of irradiation. Hence log I/Io= -px, where
Io
is the incident dosage. The ratio: I/Io, was obtained experimentally as fol- lows : a fly was placed directly over the window of the ionization chamber and then irradiated. The dosage incident upon the fly and that passing through the fly were both measured. When the latter had been expressed as a fraction of the former, and the process repeated on several flies, the average was used as the estimate of I/Io. This gave I/Io =0.53,0.894, and 0.246 for Cu, Ag, and Cr, respectively.These estimates were then used to plot log I/Io against an arbitrary depth scale. From these graphs, it was estimated that 94.4, 72.5, and 49.5 percent of the dosage incident upon the fly was actually incident upon the sperm in the mid-position for Ag, Cu, and Cr irradiation, respectively.
The average effective wave length of the X-rays for the different metals, under the conditions of this investigation, was determined by absorption experiments through successive sheets of aluminum, 0.1308 mm and 0.0072 mm in thickness. These tests showed the average effective wave lengths of irradiation to be as follows: Ag, 0.7& Cu, I . ~ A , and Cr, 2.1 to 2 . 2 A .
216 H. C. FRYER AND JOHN W. GOWEN
Under fortunate circumstances, a progeny test also furnishes a test for a deficiency. Since a t these dosages, many of our mutations are not classi- fiable as “deficient” or “non-deficient,” that distinction has not been made in the data to be presented below.
Results
The data obtained in the above-described experiment are presented in the tables below. In tables 2 , 3 , and 4, only those sets of data which are
TABLE I
Summary of data on visible gene mutations by wave length, dosage, and chromosome.
I I1 I11
TARGET DOSAGE LOCI LOCI LOCI
(runits) EXAMINED v (v+c) EXAMINED v (v+c) EXAMINED v (v+c)
--
CU 3,625 52.101 16 32 18,850 4 8 13,917 3 7
CU 7,250 12,455 1 2 23 37432 0 0 5,451 2 5
Cr 2,475 7 , 0 2 0 o I 8,331 2 7 79478 1 4
Cr 4,950 6,397 2 8 7,576 I 5 6,760 s 4
Ag 3,776 -
Ag 4,720 2,955 2 4 3,416 0 2 4,005 1 5
4,412 0 3 4,389 0
s
-
-80,928 32 68 46,017 7 2 5 41,970 10 30
TABLE z
Summary of specijic mutations on Chromosome I .
Cu3625 cu7960 Crrgeo
LOCUS LOCI LOCI LOCI
EXAMINED V (V+C) EXAMINED V (V+C) EXAMINED (V+C)
sc 7 7 443 3 4 1 I765 2 2 667 ~ o
cv 7 t 443 I 2 1,765 0 0 667 o
ct 7 9 443 4 8 1,765 5 9 667 5
V 79443 3 6 1,765 I 2 667 I
car 7 9 443 I 2 1,765 I 3 667 o
f
ec 7 9 443 3 8 1,765 2 5 667 2
7 ! 443 I 2 1 t 765 I 2 667 o
~~ ~
52,101 16 32 12,455 1 2 23 4,669 8
MUTATION I N DROSOPHILA TABLE 3
Summary of specijc mutations on Chromosome I I .
Cr2476 Cr4950 cu3696
LOCUS LOCI LOCI LOCI
EXAMINED (V+C) EXAMINED (V+C) EXAMINED V (V+C)
a1 1 f 843 2 1,638 0 3 7 483 I I
dP 929 I 860 I 2,971 I 4
Pr 929 2 860 I 2,971 0 0
C 929 2 860 2 2,971 0 0
p.t’ 929 0 860 I 2,971 2 3
S P 1.843 I 1,638 0 3 3 483 0 0
-___
7.402 8 6,716 5 18,850 4 8
TABLE 4
Summary of speci& nmitatiom on Chromosome I I I .
Cuaszs Cu72sa Cr4950
LOCUS LOCI LOCI LOCI
EXAMINED V (V+C) EXAMINED (V+C) EXAMINED V (V+C) -
ru 2 , 2 2 2 0 I 884 2 787 0 0
h 2,222 0 0 884 I 787 0 0
st 2 , 2 2 2 I 2 884 o 787 I 2
sr 2 , 2 2 2 I I 884 o 787 0 0
ea 2,807 I 2 1,031 0 1,638 2 2
ca 2 , 2 2 2 0 I 884 2 787 0 0
13,917 3 7 5,451 5 53573 3 4
ANALYSIS OF THE DATA
The above data furnish some evidence regarding questions of interest in irradiation research. Some of these questions are: ( I ) Are there differ- ential rates of mutation a t the gene loci considered? ( 2 ) Is the mutation
rate of a particular gene directly proportional to the dosage of radiation applied? ( 3 ) After due allowance is made for differences in absorption, does wave length affect mutation rate? (4) I n so far as the sets of genes observed are representative of their respective chromosomes, what evi- dence is there of different rates of mutation among the first three chromo- somes of Drosophila melanogaster?
218 H. C. FRYER AND JOHN W. GOWEN
conclude that the hypotheses used probably are not taking into account all the sources of non-random variation.
The
x2
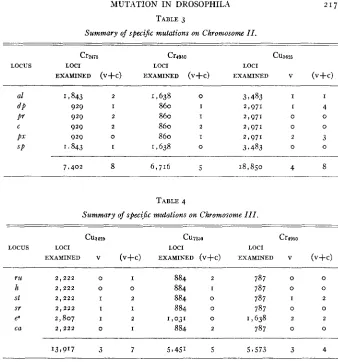
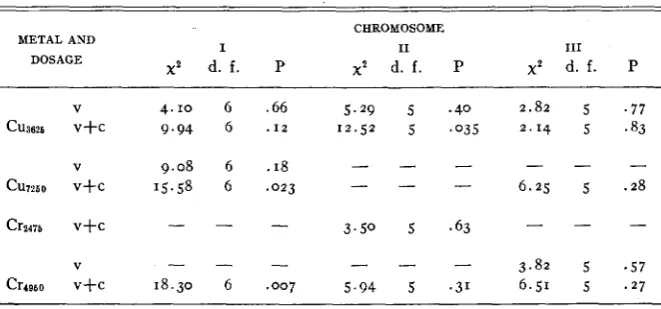
test is used to distinguish between the random and non-random variation described above.The first question stated above leads to this null-hypothesis: for a given wave length, the probability of observing a mutation on one observation of a given gene locus is the same for all the loci considered in that set. The expected numbers under that hypothesis are compared with the cor- responding observed numbers in table 5 . The calculation of the expected numbers is illustrated from table 3 and for Cr2475.
Let p be the estimated probability of observing a mutation a t a par- ticular locus on a single observation. Then we would expect (mathemati- cally) 1843 (p) mutations a t “al” and “sp” and 929 (p) mutations a t each of the other loci listed. Hence, keeping the total number of mutations ex- pected the same as the number observed, we must have 2(1843p) + 4 ( 9 q p ) =8. This requires that p=.o01081; or, the estimated rate of muta- tion for each locus is 1081 per million observations. One then obtains
O = 1843(.001081) = 2 . 0 as the expected number of mutations a t the locus “al.”
As pointed out by FRYER (1940), we can use
N (Xi - % i ) 2
1 2;
x2
=c
and disregard the numbers of non-mutants, since the deviations squared are very small compared to the expected numbers of non-mutants.
The tests described above were made on the data of tables 2 , 3, and 4.
The results for each test separately are given in table 5 .
x2
offers a meansTABLE 5
Tests of the hypothesis thet basic rates of mutetions of genes within sets are the same.
CHROMOSOME
I I1 I11
METAL AND
DOSAGE x2
d. f . P x2 d. f . P xz d. f. P
V 4.10 6 .66 5.29 5 .40 2.82 5 . 7 7
MUTATION I N DROSOPHILA 219
of combining the results of separate tests if that is desired. A pooling of the data into one test occasionally yields misleading results. For example, the pooled
x2
for the first chromosome has six degrees of freedom and is far beyond the 0 . 1 percent level of significance; but during the copper irradia-tion-where we obtained our best set of data-the
x2
is well above the five percent level of significance. Also, on the second chromosome, the pooledx2
is definitely non-significant. This hides the fact thatx2
was sig- nificant for the results of the copper irradiation.One sees from table 5 that but three of the fourteen values of
x2
are sig- nificant and but one is highly so. All three of the significant values came on the (v+c) data. It is found from the amounts contributed tox2
by the various genes that the “ct” locus is causing the largex2
in two of the three significant cases. For example, for Cr4950 on I, the expected number of mu- tations a t each locus was 1.14. Actually five mutations were observed at “ct.” Then (5-
I . I ~ ) ~ / I . I ~ = 13.07 of the 18.30 found for thex2
in this case was produced by the deviation of the observed number of “ct” mutations from the number of such mutations expected if all of the sex-linked genes considered have the same mutation rate.In the remaining case, “dp” and “px”-both more subject to misclassifi- cation than most of the genes observed-are contributing most of the deviations from expectation. Assuming that neither wave length nor dosage
of irradiation interact with mutation rate, it is proper to use a combined
x2
test on the data of table 5. Adding the values ofx2
for “v” mutations, if possible, one obtains: x2=59.10, d. f.=48, P=.o5. If this same pro- cedure is used on “v” mutations only, x2=25.11, d. f . = 2 7 , P=.57. Hence one concludes that, in general, the genes in a chromosome group have about the same mutation rate. However, there is evidence in our data to indicate that the rates of change a t the “ct” locus might be greater than the rates of mutation of the other genes in the corresponding chromosome set. The data in table I furnish evidence regarding the proportionality ofmutation rate to dosage. If one makes the comparisons: cu3625 with cu7250 on the first and third chromosomes, and Cr2475 with Cr4950 on the second and third chromosomes by assuming that mutation rate is proportional to dosage applied, one obtains these results in that order, using rr2?7 mutations:
X2=I.37, d. f . = I , P = . z ~ , x2=0.032, d. f . = I , P=.85, x2=1.16, d. f . = I , P = . z 9 , and x2=0.176, d. f . = I , P=.68.
2 2 0 H. C. FRYER AND JOHN W. GOWEN
In studying the effect of wave length on mutation rate by means of
x2,
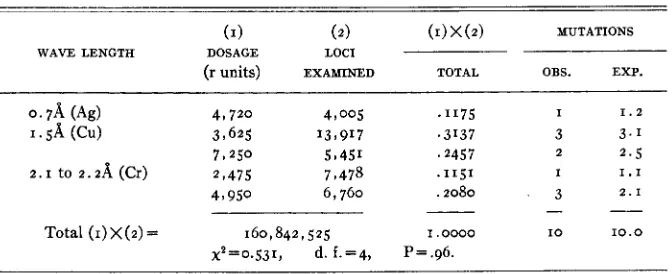
we shall assume that wave length-for a given dosage and gene locus-has no effect on mutation rate. That is the hypothesis to be tested against the observed data. Since previous analyses cast no doubt on the hypothesis that mutation rate and dosage of radiation are proportional, we have assumed that to be true in the analyses below. Using the appropriate parts of table I , we have derived the contents of tables 6 and
7.
TABLE 6
Comparison of wave-lengths using ( v ) frequencies and sex-linked mutations.
MUTATIONS
-
(2) (1) X(2)
-
(1)
WAVE LENGTH DOSAGE LOCI
(r units) EXAMINED TOTAL OBS. EXP.
0.7! ( A d 47 7 2 0 2,955 ,04295 2 1 . 4
I . SA (Cu) I 3,625 52,101 16 18.6
7 7 250 12,455 . 2 7 8 0 I 2 8 . 9 2.1 to 2 . 2 A (Cr) 47950 6,397 .09755 2 3 . 1
Total (1)X(2)= 324,777,625 I . 00000 32 32.0
x2=2.09, d.f.=3, P=.56.
The results in table 6 indicate that the hypotheses adopted account for the variation among the data quite well.
TABLE 7
Comparison of wane lengths using ( v ) frequencies and third chromosome mutations.
(1) (2) (I)X(2) MUTATIONS
WAVE LENGTH DOSAGE LOCI
(r units) EXAWINED TOTAL OBS. EXP.
. I 1 7 5 I 1 . 2
.3137 3 3 . 1
'2457 2 2.5
.I151 I 1 . 1
.2080 3 2 . 1
I . 0000 I O 10.0 P=.96.
While the agreement between observation and expectation is abnormally good for these data, it is not excessively so. I n consideration of previous analyses, this result seems to confirm that in table 6.
MUTATION IN DROSOPHILA 221
These assumptions are: (I) that the sets of genes we have observed are
equally representative of their respective chromosomes, and ( 2 ) that
differences among the stocks of flies used do not spoil the comparisons being made.
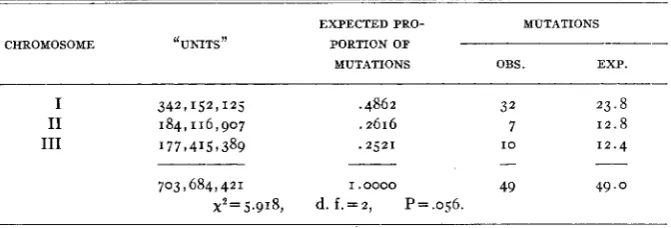
In view of the results of previous analyses, we may use all the data in table I in an analysis similar to that used in tables 6 and 7. This is done
in table 8.
TABLE 8
Comparison of mutation rates on the .first three chromosomes of Drosophila melanogaster.
EXPECTED PRO- MUTATIONS
___-
CHROMOSOME ‘UNITS” PORTION OF
MUTATIONS OBS. EXP.
-
I 342,152,125 .4862 32 23.8
I1 184,116,907 .2616 7 1 2 . 8
I11 177,4157389 .252I I O 1 2 . 4
-- - __
703 I 684,42 1 I . 0000 49 49.0
x2=5.918, d . f . = = z , P=.056.
Although the probability, P, in table 8 is not quite down to the con- ventional five percent level, one must conclude that the variation from expectation probably is not just random. We cannot say whether the non- random element is produced by stock differences, or by different mutation rates on the chromosomes.
ANALYSES OF ALLIED DATA
The literature contains a number of sets of data which are closely related to this study. A few of these sets have been analyzed in order to illustrate the kind of information they can yield. The data selected for analysis per- tain to these subjects : ( I) continuous versus interrupted administration
of the dosage of radiation; ( 2 ) the effectiveness of heat in producing sex-
linked lethals in Drosophila; ( 3 ) the effectiveness of heat in producing visible gene mutations ; (4) differential mutation rates among different species of Drosophila; (5) rates of reverse mutation; that is, from recessive to normal, and (6) mutation rates of the alleles in “white” series of Droso- phila melanogaster.
The data for the first illustration are from PATTERSON (1931) and are presented in table 9.
2 2 2 H. C. FRYER AND JOHN W. GOWEN TABLE. 9
Continuous versus interrupted administration of the radiation as it affects rate of lethal mutation in Drosophila.
NUMBER OF TIME INTER-
TOTAL DOSAGE NUMBER
VAL OF LETHALS NON-LETHALS
TIME (r units) OF FLIES INTERRUPTION
OBS. EXP. OBS. EXP.
o hrs. 1 2 hrs. 6 hrs.
0 hrs.
1 2 hrs.
o hrs. 24 hrs. I 2 hrs. 8 hrs. I hrs. 30 mins. 0 I 2 16 mins. 16 mins. 16 mins. 8 mins. 8 mins.
I O mins. IO mins. IO mins. IO mins. IO mins. IO mins.
1 2 hrs. 1 2 hrs.
1,654 971
1,654 993
1,654 981
2,558 518
2,558 345
1,234 863
1 , 2 2 0 876
1 , 2 2 1 936
1,219 856
1 , 2 2 0 1,014 1,234 96 2
radium 544
radium 452
Xia=3.92, d. f . = 2 , P = . I ~
xt2=6.63, d. f . = ~ , P=.oI
x?=2.31, d. f.=5, P=.80 49 62 71 39 45 28 3' 40 34 32 33 58 48 X12=.000425, d. f . = I , P=.98
xi4=12.86, d. f.=8, P=.12
a 1 60 61 61 5 0 34 3' 32 34 31 36 35 57.9 48. I
922 931 910 479 300 835 845 896
8 2 2
'982 929 486 404 911 932 920 468 311
83 2 844 902 825 978 927
486. I
403.9
TABLE IO
Summary of an investigation of the production of sex-linked mutations by temperature shocks.*
SEX-LINKED LETHALS GAMETES
EXAMINED TYPE OF INVESTIGATION TREATMENT
OBS. EXP.
Lethals Controls 6,495 I O 15.7
(using C1B Method) 3, 35'38°C 49 635 19 1 1 . 2
0, 35"-38"C 7 , 0 5 2 15 17.1
- _.
Visible mutations (with attached-X stocks)
18,182 44 44.0
x2=7.76, d. f . = 2 , P = . o ~
VISIBLE MUTATIONS
Controls 84,015 8 12.8
07, 35O-38OC 88,198 1 7 '3.4
0 , 35O-38OC 64,300 I 1 9.8 -
__
236,513 36 36.0
x2=2.91, d. f . = 2 , P=.24
MUTATION I N DROSOPHILA 2 2 3
drawn from the above data would be that interruption of the process of irradiation probably does not affect the production of lethal mutations.
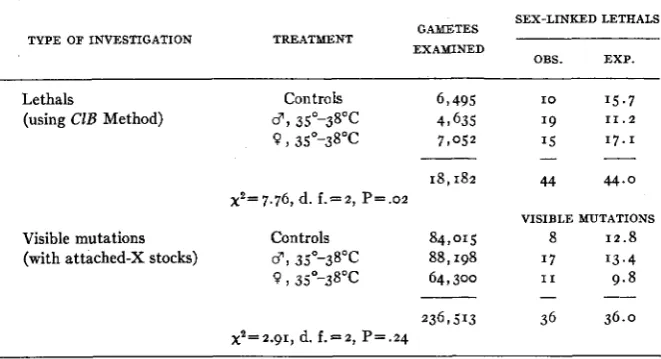
On the subject of heat-induced mutations, BUCHMANN and TIMOFEEFF- RESSOVSKY (1936) have reported an investigation during which they pro- duced sex-linked lethals in one stock of Drosophila and visible gene mu- tations in an attached-X stock of Drosophila. They used both X-rays and heat, but only the data from the latter treatments are given here.
TABLE I I
Comparison of rates of lethal, sex-linked mzdation in D. funebris and D . melanogaster (from TIMOFEEFF-RESSOVSKY r937).
'
-
LETHALS NON-LETHALS NUMBER
EXAMINED SPECIES TREATMENT
OBS. EXP. OBS. EXP.
funebris controls 2,869 2 1 . 8 2,867 2,867.2
X-rayed 1,037 84 96.8 953 940.2
melanogaster controls 1,837 I 1 . 2 1,836 1,835.8
X-rayed 73 I 81 68.2 650 662.8
~"4.57, d. f . = 2 , P = . I I
TABLE 12
Comparison of rates of lethal sex-linked mutation in D. simulans and D. melanogaster (from KOSSIKOV 1935).
LETHALS NON-LETHALS NUMBER
EXAMINED SPECIES TREATMENT
OBS. EXP. OBS. EXP.
-
simzilans Controls 1,446 I 2 10.6 1,434 1,435.4
X-rayed 842 42 38.0 800 804.0
melanogaster controls 469 2 3 . 4 46 7 465.6
X-rayed 1,019 42 46.0 977 973.0
X2=1.57, d. f . = 2 , P=.47
It appears from table I O that the variability between control 3 and
0 could very well be random as far as the visible mutations are concerned.
As regards the sex-linked lethals, it seems logical to conclude that heat treatments probably did increase their rate of mutation somewhat.
The third type of comparison we shall make concerns different species of Drosophila. The rates of mutation of these species are compared in tables 11 and 1 2 , using lethal mutations for the comparison.
It is seen from tables 11 and 1 2 that the variability exhibited by those
2 24 H. C. FRYER AND JOHN W. GOWEN
may reasonably be supposed to be random variability rather than being due to species differences in mutation rate. However, it is of interest to note that if in table 11 one omits the controls from consideration, one ob-
TABLE 13
Rates of mutation from visible recessive to normal.
(A) (4
DATA FROM TIMOFEEFF-RESSOVSKY DATA FROM JOHNSON AND
I937* WINCHESTER 1934
3975 r.
LOCUS
NUMBER OF MUTATIONS NUMBER OF MUTATIONS GAMETES
OBS. EXP. GAMETES OBS. EXP.
Y 21,897 0 1.9 69 I 923 I 2.9
SC 17,676 3 1.6 101,042 5 4 . 3
W 297 233 2.6
We 23,472 2 . 1
- - 69,302 0 2.9
zcia
ec 17,676 0 1 . 6 57 I323 0 2.4
CV 16,460 1.4
2
2
- -
-
- - -
-
2 - - -
ct
m
V
12,914 0 1 . 1 57,323 I 2.4
29 I384 2 2.6 61,119 I 2.6
- 39 I 923 2 1 . 7
- -
Total
ru
h th
St
PP
CU
ss sr
ea
216,437 I 9 19.0 713,001 30 30.0
~ 1 ~ = 1 5 . 8 0 , d. f.=9, P=.08,~2'=27.24, d. f.=9, P s . 0 0 2 X1'+X2~=43.03, d. f.= 18, P<.OOI
12,755 0 0.6
2 7 1 '55 I 1 . 2
5,681 0 0 . 2
2 7 , I55 I 1 . 2
21,474 4 1.0
5,681 0 0 . 2
2'7474 0 1 . 0
5,681 0 0 . 2
2 7 , IS5 I 1 . 2
* TIMOFEEFF-RESSOVSKY'S data are based on two or more experiments having different ex-
posures to X-rays: Doses in Mutationsforschung in der Vererbungslehre 3,900 and 5,000 r.
MUTATION I N DROSOPHILA 2 2 5
by the control data. The results of this further analysis suggest the possi- bility that the two species, fulzebris and melamguster, may react differently to the X-rays even though their normal rates of mutation are apparently quite similar. The data on the normal rates of mutation for each of the two species being considered are too scant to allow a more definite con- clusion to be drawn.
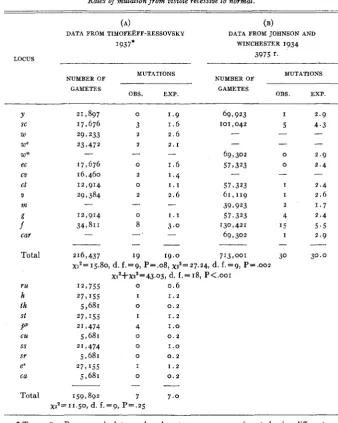
The next type of data to be considered is from two sources-(I) TIMO- FEEFF-RESSOVSKY (1937) and (2) JOHNSON and WINCHESTER (1934)-
and is on the subject of reverse mutations. These data include both v and c types of observations.
TABLE 14
Summary of all muktions i n different directions within the while series of Drosophila melanogaster, produced by X-ray treatment (dosage approximately 4,800 r ) .
MUTATED TO
TOTAL
-
ORIGINAL GENE
w wbf we wa a16
w
W , wild
2 ~ ~ 0 , coral
wb, blood wc cherry
e, apricot w”, eosin
whJj buff wt, tinged
w, white
2 5 I 3 I 2 5
I
3 I
I
2 I
I 3 I 2 2
I I
I I I
The conclusions to be drawn from table 13 are essentially those of the corresponding analyses of our own data with the exception that the
‘7’’
locus now appears to possess the higher rate of mutation in the JOHNSON-WINCHESTER data. It was found that 24.74/43.03 of the combined
x2
for the sex-linked genes was contributed by the‘if”
locus.If one uses TIMOFEEFF-RESSOVSKY’S data to test the rate of reverse mutation on chromosome I against that rate on chromosome 111, he ob- tains
x 2 =
I .93, d. f. = I, P =.17.
This is essentially the same result as that obtained from our own data for direct mutations.TIMOFEEFF-RESSOVSKY’S study (1933) of the mutation rates of the alleles in the white locus of Drosophila is adapted to the
x2
test in inter- preting the significance of the observed differences.2 2 6 H. C. FRYER AND JOHN W. GOWEN
0.00~35. Seven degrees of freedom are available for deviations from ex-
pectation. One finds that the
x2
is7.55
and is associated with a probabilityof .35. There seems to be nothing in the above data to indicate that the
different alleles are significantly different in their rates of mutation to “white.” ( 2 ) Are the frequencies with which the various alleles change to
genes other than “white” fundamentally different? To answer that ques- tion, we test the homogeneity of the rates of mutation for all nine genes, omitting the data of column one. There are 188,000 observations and 2 2
mutations, which gives an estimated mutation rate of o.oo012. Eight de- grees of freedom are now available,
x2
is 11.8, and P is .16. It thus appears that no significant difference in rate of mutation to genes other than “white” is indicated by these data.SUMMARY
The data obtained from irradiation research on visible gene mutations follow binom :a1 distributions .which are defined by probabilities less than 0.01. HOEL (1938), SUKHATME (1938), COCHRAN (1936), NEYMAN and PEARSON (1931), and FRYER (1940) have given evidence to show that the tabular
x2
test is valid and useful for such data even when the expected numbers are as low as 0.5.New data were obtained on visible mutations a t 19 loci on the first three chromosomes of Drosophila melanogaster. These data are analyzed by the
x2
test on the basis of these hypotheses: (I) that the genes within the setsobserved have the same basic mutation rate, ( 2 ) that the mutation rate
a t a specific locus is directly proportional to the dosage of radiation ap- plied, (3) that in so far as the sets of genes used are representative of their respective chromosomes, the fundamental rates of mutation on these chromosomes are the same, and (4) that for a particular gene and a fixed dosage, the wave-length of X-ray used does not affect the mutation rate. Our data indicate that the first hypothesis is not adequate to explain the variation observed when the “ct” locus and possibly the “dp” and
“px”
loci, are among those observed; but the other hypotheses fit the data quite satisfactorily.
Other sets of data were analyzed by
x2
as illustrations of methodology. These data were on the following subjects: (I) continuous versus inter-MUTATION I N DROSOPHILA 2 2 7
LITERATURE CITED
BUCHMANN, W., und N. W. TIMOFEEFP-RESSOVSKY, 1936 Uber die Wirkung der Temperatur auf den Mutationsprozess bei Drosophila melancgaster, I11 Behandlung der Weibchen mit Temperaturschocks. 2.i.A.V. 71 : 33 5-340.
COCHRAN, W. G., 1936 The xz distribution for the Binomial and Poisson series with small ex- pectations. Ann. Eugen. 7: 207-217.
FRYER,H. C., 1940 A thesis submitted for the degree of Doctor of Philosophy, Iowa Statecollege, Ames, Iowa.
HOEL, P. G., 1938 On the x2 distribution for small samples. Ann. Math. Statist. 9 : 158-165.
JOHNSTON, O., and A. M. WINCHESTER, 1934 Studies on reverse mutations in Drosophila melano-
KOSSIKOV, K. V., 1935 X-ray mutations in Drosophila simulans. Acad. Sci. U.S.S.R., Bull. Inst.
NEYMAN, J., and E. S. PEARSON, 1931 Further notes on the xz distribution. Biometrika 22: 298- PATTERSON, J. T., 1931 Continuous versus interrupted irradiation and the rate of mutation in PINNEY, L. E., 1939 A gas-type X-ray tube. Iowa State COIL J. Sci. 13: 269-273.
SUKHATME, P. V., 1938 On the distribution of xz in samples of the Poisson series. J. Roy. Statist. TAYLOR, L. S., and G. SINGER, 1930 An improved form of standard ionization chamber. Bur.
Stand. J. Res. 5: 507-16.
TIMOFEEFF-RESSOVSKY, N. W., 1933 Ruckgenmutationen und die Genmutabilitat in verschie- denen Richtungen IV. Rontgenmutationen in verschiedenen Richtungen am white-locus von Drosophila melanogaster. 2.i.A.V. 65: 279-292.
1937 Mutationsforschung in der Verebungslehre. Dresden und Leipzig: Theodor Steinkkoff.
gaster. Amer. Nat. 68: 351-358.
Genet. IO: 189-197.
306.
Drosophila. Biol. Bull. 61 : 133-138.