Evaluation of Damaged Corn Grains for Fuel
Ethanol Production
Sheetal B. Gawande 1, Dr. I. D. Patil 2
Research Student, SSBT`s, COET, Bambhori, Jalgaon and Assistant Professor, Department of Food Technology,
L.I.T., RTMNU, Nagpur, MS, India1
Professor and Head, Department of Biotechnology, SSBT`s, COET, Bambhori, Jalgaon (MS), India 2
ABSTRACT: Physiochemical and biochemical characteristics of damaged blackened corn grain meals to ethanol production was evaluated and compared with sound grains. There was 40% and 17% decrease in starch and protein in damaged kernels. Endosperm structure of blackened and control. Corn was examined using Scanning Electron Microscope (SEM). Laboratory dry grind ethanol production process was used to study ethanol production from damaged corn grains. Damaged and fine corn contained 35 g/L and 48 g/L of reducing sugar at the end of liquefaction
with α amylase. Liquefaction of fine corn was completed in 2 h. However, liquefaction progress of blackened corn is slightly slower as compared to control corn. Ethanol yield from damaged and fine corn grains are 0.17 and 0.22 g ethanol/g flour respectively. The blackened corn had 23 % reduced ethanol yields compared with control and this negative result may be due to dry matter loss occurred during storage. The research demonstrates that use of damaged corn kernels is feasible and a good alternative for biorefineries and could reduce the production cost of ethanol.
KEYWORDS:Physiochemical, Damaged, Endosperm, Ethanol.
I. INTRODUCTION
Corn (Zea mays) is grown throughout the year in India. It is predominantly a kharif crop with 85 per cent of the area under cultivation in the season. Maize is the third most important cereal crop in India after rice and wheat. It accounts for ~9 per cent of total food grain production in the country. Various starchy materials such as corn, wheat, sorghum, rice and potatoes produced in surplus quantities has been used for Industrial ethanol production [P. Nigam,D. Singh] to emerge as a renewable energy source for the future. Some qualitative and quantitative losses occur in the postharvest system of cereals. Mainly during drying in the field and storage and biotic factors such as insects, rodents and sprouting causes overall postharvest losses in corn can be around 29%. According to FAO (1993), the range of worldwide postharvest losses is between 10 and 37%. The use of insect, fungi and sprout-damaged grain for human consumption is not always possible and its utilization in other industrial processes could reduce, at least to some extent, the producer losses. A large quantity of different grains is spoiled every year in India because of unfavourable climatic conditions and inadequate transport and storage facilities. Regarding the use of damaged kernels in ethanol production, Yan et al. (2010) tested field-sprouted-sorghum and concluded that the use of these kernels significantly reduced fermentation time and yielded higher ethanol. The detrimental effect of aflatoxins associated with maize mashes was studied by Murthy et al. (2005). These authors concluded that maize containing 775 ppb or less aflatoxins did not affect ethanol yields. C. Chuck-Hernandezet al. (2012) investigated the bioconversion into ethanol of insect (Sitophilus zeamais), mold (Aspergillus flavus) and sprout damaged maize and sorghum. Their research demonstrates that the use of already damaged insect, mold or sprouted kernels is feasible and a good alternative for biorefineries.
suspensions were examined at the microscopic level by SEM studies. Bioethanol yield and productivity, were assessed using SSF process.
II. MATERIALSANDMETHODS II.1 Substrate
The study was carried at Laxminarayan Institute of Technology, Nagpur and Department of Biotechnology, SSBT`s, COET, Bambhori, Jalgaon (MS), India. Fine grains used were commercial yellow dent maize obtained from a local market, Nagpur and used as a control for experiment. These grains were purposely blackened by sprinkling water on them and keeping them in damp conditions spread on a clean jute bag, covered with damp cotton.
II.2 Production of flour
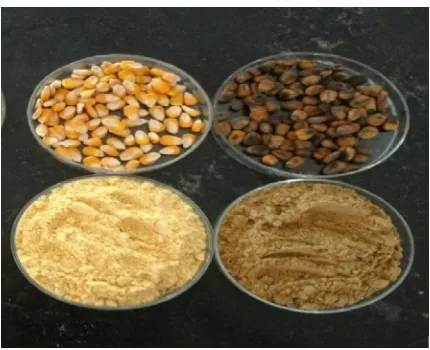
The seeds were dried at 600C in an oven and ground into flour using attrition mill. Each flour sample was passed through a 0.5mm mesh size sieve. These flours are shown in figure 2.1. They were packaged in an air tight polyethylene bags, stored in plastic containers with lids and then stored in cool dry place from where samples were taken for analyses.
Figure 2.1: Flour from fine and damaged Corn
II.3 Microorganism and culture conditions
The glucoamylase producing fungus A. niger (NCIM 1248) was obtained from the National Collection of Industrial Microorganisms, National Chemical Laboratory, Pune, India. The stock cultures were maintained on potato dextrose agar slants. A standard strain of S. cerevisiue MTCC 170 was obtained from the Microbial Type Culture Collection, Institute of Microbial Technology, Chandigarh, India, for using as a control organism. The strains were maintained on
slants of YPD agar medium. Liquefying enzyme diastase (α-amylase) was obtained from Hi-media Laboratories pvt. ltd. II.4 Glucoamylase Production
II.5 Media
Growth medium used for preparing was S. cerevisiae contained in grams per 100 mL glucose, 2; peptone, 1; yeast extract, 0.5; and potassium dihydrogen phosphate, 0.1.
The fermentation medium used for ethanol production from starch was identical to growth medium except that substrate used was damaged corn flour (25%). 1N NaOH and 1N HCl was used to get desired pH. The damaged corn grain flour was pretreated with fungal amylase to extract the starch present in it. The pretreated solution was filtered, and the supernatant was analysed for the reducing sugar concentration. The amount of starch present in the sample was then analyzed by anthrone method.
II.6 Field-emission Scanning Electron Microscopy (FESEM):
The surface morphology of the fracture surfaces of the material were examined by a scanning electron microscope (SEM, model S4800 type 2 HITACHI Tokyo Japan) at 10 keV. Dried solid samples were coated with gold ions to enhance the conductivity of electron beam to sample and obtain clear bright images. The size and shape of the nanoparticle were determined from the FESEM analysis.
II.7 Liquefication
Ground meals (25 % dry basis) were mixed with distilled water to obtain mashes. pH was initially adjusted to 5.6 with 0.1 N HCL and temperature was increased to 850C, and 1% diastase (α-amylase) enzyme (Hi-media) per 100 gm of flour was added. Mashes were maintained at 900C during 200 min. In order to determine the progressive extent of starch hydrolysis, aliquots were taken before enzyme addition and after 100 and 200 min hydrolysis.
Reducing sugars released before and after liquefication process was measured.
II.8 Simultaneous Saccharification and Fermentation
Liquefied slurry was added in 5 L batch fermenter (B-Lite, Lab Fermenter, Satorius, India Pvt Ltd). In the slurry 0.3% peptone, 0.1%KH2PO4 and 0.1%(NH4)2PO4 were added and pH 5.8 was maintained. .Ethanol production from damaged corn grains by SSF using crude glucoamylase preparations and S. cerevisiae MTCC171 was carried out. Ethanol production by coculture of mold and yeast was carried out using cells from 72-h-old slants of A. niger and 24-h-old slants of S. cerevisiae. These cells were inoculated separately into flasks of 250 mL growth medium. These flasks were incubated under a shaking condition of 150 r.min–1, for 72 and 48 h at 30°C, respectively. Cell suspension of A. Niger (5%) and S. cerevisiue (7%) cell culture were inoculated to liquefied corn meal solution in fermenter operated at 300C and 150 rpm for 5 days. The enzyme used for hydrolysis of starch extracted from Aspergillus niger possessing an activity of 44 U/ml. All medium components and laboratory tools used in experimentation were autoclaved (1210C, 15– 30 min). Samples were withdrawn for every 12 hours and centrifuged in a variable speed research centrifuge at 5000 r.min–1. The supernatants were analyzed for reducing sugar and ethanol concentrations. All the experiments were replicated twice and the average values are presented.
II.9 Glucoamylase activity assay
Glucoamylase activity was measured by reducing sugars released from starch. The reaction mixture containing 2 ml 1% starch in deionised water, 1ml 0.1 M acetate buffer (pH 5.8) and 1 ml enzyme solution was incubated at 350C in water bath for 10 minutes (Bergmeyer1983). The reducing sugar released was estimated by 3-5 DNS method (Miller). Enzyme activity was expressed in units (U/ml) (n moles glucose released per ml per min).
III.ANALYTICAL METHODS
constant mass (Official Methods of Analysis, 1995). Lipid concentration was determined according to the Soxhlet method (Official Methods of Analysis,1995). The protein content was estimated as the total nitrogen by the Kjeldahl method multiplied by 6.25 (Official Methods of Analysis, 1995), the ash content was determined in muffle furnace by slow combustion of the sample at 6500C for 2 h (Official Methods of Analysis, 2000), and the fibre content was determined (Official Methods of Analysis, 2000). During the liquefaction and SSF process, the content of reducing sugars, calculated as glucose, was determined by 3, 5-dinitrosalicylic acid (Miller, 1959). A standard curve was drawn by measuring the absorbance of known concentrations of glucose solutions at 570 nm. The ethanol concentration was determined based on the density of the alcohol distillate at 200C and expressed as % w/w (Official Methods of Analysis, 1995). The cell biomass was determined using a pellet of cells obtained by centrifugation, drying them at 70 °C and expressing the dry weight as grams per 100 ml of medium.
IV.RESULTS AND DISCUSSION
IV.1 Physio-chemical characteristics of damaged grains
Thousand-kernel weight was less in damaged grain than in fine corn grains. This parameter is an important quality criterion because a larger grain usually contains a higher proportion of endosperm and starch. Corn kernels were within ranges reported previously (240-370 g for corn) (Serna-Saldivar, 2010). The loss of weight for blackened corn was due to the effect of nutrient consumption because of the insect infestation and the activation of grain metabolism during germination. Compared to sound counterparts damaged corn lost 14.3% of the kernel weight respectively. Damage in corn was due to softer endosperm texture.
The FI was also adversely affected in damaged grains. In damaged grains, an increase of FI was observed because of the reduction of density due to endosperm damage or starch consumption or degradation (Tables 4.1 and 4.2). There is presence of large quantities of air in the endosperm of soft kernels hence soft kernels float more than hard ones. According to Serna-Saldívar, 2010 in ethanol production, as intermediate or soft endosperm texture grains contains higher proportion of starch. Thus these types of grains are preferred in distilleries. Relative density of grain is estimated by floatation index. Thus grain hardness is inversely related to floatation index. Control corn such as the ones used herein, had FI of 18%, respectively whereas damaged grains of corn had FI of 45%.
Colour is one of the critical quality properties of grain flour. Colour parameters, namely L value, chroma and hue angle, of damaged and control grain flour are shown in Table 4.1. The lightness, L*, represents the darkest black at L* = 0, and the brightest white at L* = 100. L* (brightness), a*(redness), b*(yellowness), Chroma and Hue values are reduced in both damaged sorghum and corn grain flour. The results obtained in this study indicate that there are changes in carbohydrate composition in damaged grains. Part of starch is hydrolysed into reducing sugar and subsequently these sugars react with simple nitrogenous compounds forming color species (Maillard reaction). Thus there were reactions that changed the color of the flour, and the most common were non-enzymatic browning reactions such as Maillard and caramalization reactions and degradation of pigments, in which lightness value decreased. Lower values Chroma a* and Chroma b* are due to higher amount of dark pigment present in damaged grain. These changes can be aggravated by thermal treatments.
Table 4.1: Effects of damages on physical properties and color of corn
Table 4.2: Effect of damages on physical and chemical properties of Corn
Corn Moisture content
(%) Starch (%w/w db)
Crude fibre (%w/w db)
Crude Protein (%w/w db)
Lipids (%w/w db)
Ash (%w/w db)
Control 12.5 70.5 2.5 12.8 2.62 0.5
Damaged 16.9 40.3 0.9 10.8 2.6 0.4
Moisture is also an indicator of grain storability. Flour with high moisture content (over 14.5%) attracts mold, bacteria, and insects, all of which cause deterioration during storage. Flour with low moisture content is more stable during
Corn 1000 kernel weight, g Flotation index Color values
L* a* b* Chroma Hue (ho)c
Control 279.80 18 2.25 0.74 2.25 2.37 71.71
storage. Moisture, by far the most important factor influencing the rate of deterioration, increased from 12.5% in the controls to 16.9% in damaged corn. The moisture increment observed in blackened grains is due to insect infestation. Serna-Saldivar (2010) indicates that insects proliferate when the grain moisture exceeds only 1.5% of the critical moisture content (14% in cereals). The degree of insect infestation is mainly affected by the grain moisture, storage conditions (temperature, RH and controlled atmosphere), length of storage and extraneous material among other factors. Damaged kernels, showed all the typical signs of contamination such as discoloration, formation of kernel clusters trapped with a web-like mycelium and an increase in moisture due to its own metabolic activity. Starch is the most important component of the grain for ethanol production and the main substrate consumed by contaminating microflora and insects. Damaged kernels contained 42% less starch compared corn controls, respectively (Table 4.2).
The crude protein was higher in control grain flours compared to damaged 12.8 versus 10.8% in damaged corn. Mold proteolytic enzymes hydrolyzed corn proteins. In relation to crude fiber (Table 4.2), the control kernels were within the ranges reported (2.4-3.5% in dry basis in corn) (Serna-Saldivar, 2010). Crude fiber in damaged kernels was observed less compared to control grains indicating that insects had preference for the starchy endosperm as well as outer bran layer of the grain (as the crude fiber are present in bran). The control and mold-damaged corn contained similar amounts of crude fat. These amounts are below the range indicated in the literature (3.9-5.8%) and can be related to the relative size of germ, where about 80-85% of total fat content is stored (Serna-Saldivar, 2010). Crude fat found to be same in the damaged corn compared with the control indicate that microorganism had preference for starch rather than fat as nutrient source. Most of the minerals are located in the pericarp, aleurone layer and germ; thus, the ash content in damaged kernels was expected to decrease in a negligible amount. The ash in control corn was around 0.5%, corresponding to values previously reported (Serna-Saldivar, 2010). However ash content in damaged kernels decreased to 0.4%. The higher dry matter loss and damage observed in corn is the most reasonable explanation for the observed differences.
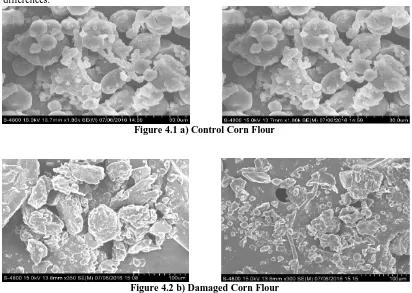
Figure 4.1 a) Control Corn Flour
IV.2 Surface structure Damaged Sorghum and corn grain flour by Scanning Electron Microscope (SEM) Surface structure of damaged corn grains flour was observed by Scanning Electron Microscope. Figure 4.1a and Figure 4.2b shows SEM images of control and damaged corn grain flour. Damaged Starch granules had many more holes and cracks than those control. These holes and cracks indicate that starch granules were degraded or attacked by insects and activated enzymes. As it can be seen in Figure 4.1a and 4.2b, the surface of control corn granules are smoother than damaged. Also pitting occurred on the edges of damaged grains are more severe compared to control. Thus, damaged grains are more susceptible to enzymatic attack and gave higher amount of glucose after liquefication compared to control which can be beneficial for ethanol production. These SEM images clearly indicate that various degrees of damage occurred to starch granules in both the germ and endosperm of damaged kernels. Cell walls of the damaged kernels also were degraded by the activated intrinsic cell-wall-degrading enzymes and apparently were thinner than cell walls of control kernels. These intrinsic enzymes mainly convert part of the insoluble polymers in corn kernels into soluble smaller molecules, which makes the damaged kernels a better feedstock for ethanol production. Any pores present on the surface of granules could become the centres of attraction, which made the granules more susceptible to enzymatic attack (Juszezak et al 2003).
IV.3 Reducing sugars during Liquefication of damaged corn
In liquefication step, when flour water slurry was prepared and heated, initially we observed very high viscosity of the slurry. At gelatinization stage in liquefication process, it was extremely necessary to provide a strong agitation for
enhancing starch α-amylase interaction during liquefication to reduce viscosity of the wort. The high viscosity of the slurry could be due to water penetration in different cellulosic components when native starch granules swelled during gelatinization step in liquefication. In raw cereal flour, lipid and protein complexes are present in surface structure of native starch granules. Presence of these complexes could increase the viscosity of the slurry and also aggrevate amylase attack. Thus native starch is modified sometimes to make of starch granules more accessible for amylases. Time course profile of reducing sugars during liquefication of damaged corn grains are shown in figure 3. Initially control corn contained higher amount of reducing sugar compared to damaged corn. The amount of reducing sugar released after 1 hour of liquefication from damaged corn grains was comparable to that from sound corn grains despite the difference in initial starch content. After 2 hours of liquefication release of sugars was stabilized from both types of damaged grains. This indicates that 2 hours of hydrolysis time was suitable to complete starch breakdown. Damaged and fine corn contained 35 g/L and 48 g/L of reducing sugar at the end of liquefication process.
From this study it was also observed that with further increase in liquefication time beyond 2 hours, dextrose equivalent decreases. This was due to longer contact of amylase enzyme to high temperature, could cause enzyme deactivation. Thus prolonged liquefication time has negative effect on release of sugars. Thus longer exposure of amylase to high temperatures, which is required for gelatinization of starch granules and for achieving a good susceptibility of enzyme action, could cause enzyme deactivation.
Control, blackened corn was found to contain 70% and 40% starch respectively (Table 4.2). Low starch content in the damaged corn grains indicates that fungus has infected pericarp and endosperm of corn grain. It can be seen from Fig. 4.3 that liquefaction of healthy corn was completed in 2 hours. However, liquefaction progress of blackened corn is slightly slower as compared to control corn. This could be attributed to the enzyme inhibition due to mycotoxins present in the blackened pericarp.
Figure 4.3: Time profile of reducing sugar from fine and damaged corn grain flour hydrolysate in liquefication process
IV.4 Ethanol production during SSF of liquefied corn meal
In order to investigate the effect of blackening of corn kernels on ethanol production further experiments were conducted. As compared to the conventional separate hydrolysis and fermentation (SHF) process, SSF was found to be economically favourable. The SSF process shows more attractive indexes than the SHF as higher ethanol yields and less energetic consumption (O´ scar J. Sa´nchez, Carlos A. Cardona). Figs. 4.4 and 4.5 present the time course of ethanol and biomass production, glucose consumption in the SSF processing of liquefied corn meal suspension by S. Cerevisiae. Control corn mashes used in SSF were having pH in range 5.7- 6 except for the blackened corn which was slightly acidic (pH 5.4). This can be due to metabolites produced by A. flavus. This mold has potent lipases that can hydrolyze stored triglycerides to fatty acids. Temperature was maintained at 300C throughout the experiment. There was some difference in the saccharification of corn starch, the starch content in the damaged grains is less than sound grains (Tables 4.2) and comparable difference was observed in ethanol and biomass production from these substrates. Concentration of glucose in both corn mashes were in range 35-55 g/l initially. More than 80% glucose metabolized by fermenting yeast after 72 hour of fermentation. This indicates effective fermentation. Dextrins released during liquefication step were highly susceptible to amyloglucosidase activity. Thus blackening (due to mold) of corn grains
did not affected yeast and amyloglucosidase or α-amylase activities.
Figure 4.4: Time profile of reducing sugar utilization, biomass and ethanol production from fine corn grain flour hydrolysate by Saccharomyces cerevisiae MTCC 171
0 10 20 30 40 50 60
0 20 40 60 80 100120140160180200
R e d u ci n g su ga r (g /L )
Time in minutes
Fine Corn Damaged Corn 0 5 10 15 20 25 30 35 40 45 50 55 60 65
0 12 24 36 48 60 72
R e d u ci n g Su ga r (g /L ), Et h an o l, B io m as s
Time in Hours
Reducing Sugar
Ethanol
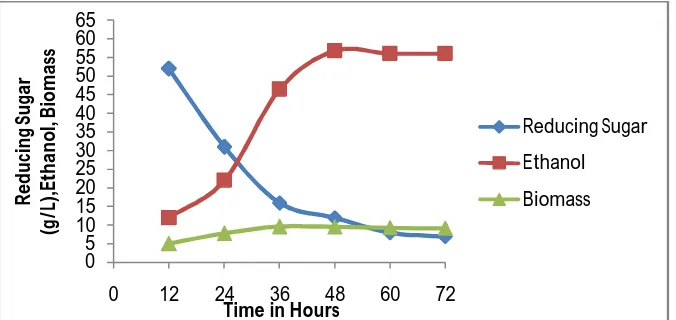
Figure 4.5: Time profile of sugar utilization biomass and ethanol production from damaged corn flour hydrolysate by Saccharomyces cerevisiae MTCC 171
Fermentation of the hydrolysate obtained after enzymatic hydrolysis proceeded vigorously during the first 48 h with nearly 76% of sugars getting consumed with a corresponding increase in ethanol concentration (Fig. 4.4and Fig. 4.5). This could be attributed to the early entry of cells into the log phase because of use of high initial inoculums. It is possible that the cells might have reached the stationary phase around 48–60 h, after which the fermentation rate declined. Maximum ethanol production was obtained in stationary phase. Beyond 48 h, no significant increase in ethanol concentration was observed, this may be decline in cell biomass due to lack of nutrients and production of toxic metabolites, resulting in death of a few cells. Initially upto 24 hours there was a reduction of 40% and 32% in reducing sugar concentration over initial sugar concentration from fine and damaged corn grain hydrolysates with simultaneous production of 22g/L and 28.4 g/L of ethanol respectively using cells of S. cerevisiae MTCC 171. Similar results were obtained for production of ethanol from cassava flour hydrolysates as feedstock with immobilized cells of Saccharomyces cerevisiae as fermenting organism (Shuvashish Behera & Ramesh Chandra Ray; 2014). The decrease in sugar reserve might be in part be due to its utilization for growth and metabolism of microorganisms in addition to its conversion to ethanol. There was a gradual increase in ethanol concentration after 24 hours with simultaneous decrease in sugar concentration. After 36 and 48 hours sugar concentration were 16g/L and 12g/L respectively in fine corn grain flour hydrolysate showing 69.2% and 76.9% decrease over initial sugar concentration with parallel increase in concentration of ethanol to 46.5g/L and 56.8g/L respectively. The % decrease in residual reducing sugar in damaged corn grains was found to be more in 24-48 hours of fermentation. After 72 hours of fermentation there was more than 85% sugar conversion resulting in 56 g/L and 43.2 g/L ethanol production from fine and damaged corn grain flour. Thus maximum ethanol of 56 g/L; 43 g/L and biomass of 9.2 g/l; 8 g/l was produced for fine quality and damaged corn flour (25%) respectively.
V. CONCLUSION
This study demonstrated that physical and chemical composition of damaged grains were affected due to dry matter loss occurred during storage.SEM images of control and damaged corn grain flour shows that damaged starch granules had many more holes and cracks than those control. These holes and cracks indicate that starch granules were affected at endosperm level and degraded or attacked by insects and activated enzymes.
Liquefaction of healthy corn was completed in 2 hour. However, liquefaction progress of blackened corn is slightly slower as compared to control corn. This study also investigated the feasibility of damaged corn grains for ethanol production by SSF process. Ethanol production from damaged grains was studied and ethanol concentration reached up to 43 g/L, ethanol productivity 0.59 g/L/h and ethanol yield 0.68 g/g based on consumed sugar and 0.17 g/g-flour. The
0 10 20 30 40 50
0 12 24 36 48 60 72
R
ed
u
ci
n
g
Su
ga
r
(g
/L
),
E
th
an
o
l,
B
io
m
a
ss
Time in Hours
Reducing Sugar(g/L)
Ethanol(g/L)
Submerged fermentation of damaged corn grain flour represented about 77 % of total ethanol production, when fine corn grain flour 56 (g/L) was used as substrate.
Conversions into bioethanol of damaged corn was lower, indicating that the dry matter loss occurred during storage was the main reason for the observed detrimental effect. The starch content in damaged corn grains was lower by more than 40% compared to control. However these damaged corn grains are the waste grains, it would be still cheaper to utilize them for ethanol production in co-culture at 25% substrate concentration using co-culture of Aspergillus niger NCIM 1248 and Saccharomyces cerevisiae MTCC171 . However efforts are needed to reduce fermentation time and increase yield of ethanol.
VI. ACKNOWLEDGMENT
Authors are thankful to the SSBT`s, College of Engineering and Technology, Bambhori, Jalgaon for providing library facility. The authors would like to thank the staff and colleagues for useful discussions.
REFERENCES
[1] P. Nigam, D. Singh, Enzyme and microbial system involved in starch processing, Enzyme Microb. Technol. 17 (1995) 770–778. [2] AOAC (Association of Official Analytical Chemists), 1995.Official Method of Analysis, 16th Ed. AOAC, Virginia.
[3] FAO, 1993. La ingeniería en el desarrollo e Manejo y tratamiento de granos poscosecha Available at: http://www.fao.org/docrep/x5041s/x5041S00.htm#Contents (accessed 05.30.11.).
[4] Yan, S., Wu, X., Dahlberg, J., Bean, S.R., MacRitchie, F., Wilson, J.D., Wang, D., 2010. Properties of field-sprouted sorghum and its performance in ethanol production. Journal of Cereal Science 51, 374-380
[5] Murthy, G.S., Townsend, D.E., Meerdink, G.L., Bargren, G.L., Tumbleson, M.E., Singh, V., 2005. Effect of aflatoxin B1 on dry-grind ethanol process. Cereal Chemistry 82, 302-304.
[6] C. Chuck-Hernández, S. García-Lara, S.O. Serna-Saldívar. Conversion into bioethanol of insect (Sitophilus zeamais Motschulsky), mold (Aspergillus flavus Link) and sprout-damaged maize (Zea mays L.) and sorghum (Sorghum bicolor L. Moench). Journal of Cereal Science (2012), 55: 285-292.
[7] Bergmeyer, H.U.; Grassl, M.: Reagents for enzymatic analysis,enzymes alpha-glucosidase.P.205±206. In H.U. Bergmeyer (ed.), methods of enzymatic analysis. (1983), 3rded. Vol.2.
[8] Gutierrez-Uribe, J.A., Rojas-Garcia, C., Garcia-Lara, S., Serna-Saldivar, S.O., 2010. Phytochemical analysis of wastewater (nejayote) obtained after lime-cooking of different types of maize kernels processed into masa for tortillas. Journal of Cereal Science 52, 410-416. [9] Miller, G.L.: Use of dinitrosalicylic acid reagent for determination of reducing sugar. Anal. Chem. (1959), 426±428
[10] Montesinos T, Navarro JM (2000) Production of alcohol from raw wheat flour by amyloglucosidase and Saccharomyces cerevisiae. Enzym Microb Technol 27:362–370.
[11] Neves MA, Kimura T, Shimizu N, Shiiba K (2006) Production of alcohol by simultaneous saccharification and fermentation of low-grade wheat flour. Braz Arch Biol Technol 49:481–490
[12] Juszeak, L.,T. Fortuna and F.Krok,2003. Non contact atomic force microscopy of starch granules surface: Part I, Potato and tapioca starches. Starch/sterke, 55:1-7.
[13] Chouvel H, Chay PB, Cheftel JC. Enzymatic hydrolysis of starch and cereal flours at intermediate moisture contents in a continuous extrusion reactor. Lebensmittel Technol 1983;16:346 –53.
[14] O´scar J. Sa´nchez a,b, Carlos A. Cardona . Trends in biotechnological production of fuel ethanol from different feedstocks. Bioresource Technology 99 (2008) 5270–5295.
[15] Shuvashish Behera & Ramesh Chandra Ray. Batch ethanol production from cassava (Manihot esculenta Crantz.) flour using Saccharomyces cerevisiae cells immobilized in calcium alginate. ANN Microbiol (2015) 65:779–783.