Transactions of the 17th International Conference on Structural Mechanics in Reactor Technology (SMiRT 17)
Prague, Czech Republic, August 17 –22, 2003
Paper # C01-4
Modal Testing and Identification of a PWR Fuel Assembly
Stéphane Pisapia1), Bruno Collard1), Sergio Bellizzi2), Vincent Mori1)1) French Nuclear Reactor Directorate, CEN CADARACHE, 13108 Saint-Paul-lez-Durance Cedex, France 2) LMA CNRS, 31 chemin Joseph Aiguier, 13402 Marseille Cedex 20, France
ABSTRACT
This study aims at characterizing the vibratory behavior of a full-scale fuel assembly using an experimental approach. The effect of the assembly environment (air, stagnant water, and water under flow) is studied. The analysis of the test series shows that the vibratory behavior of full-scale fuel assembly is strongly nonlinear.
An identification phase, based on temporal mean square criterion, allows us to obtain a nonlinear model representative of the first vibration mode of a fuel assembly. The selected class of models including damping and stiffness nonlinear terms is efficient in air, in stagnant water, and in water under flow. In all environments, the stiffness decreases with the displacement level and the damping increases with the velocity level. In the presence of water, the damping goes up and increases again with flowrate.
KEY WORDS: fuel assembly, nonlinear, identification, PWR, vibration, experiment
INTRODUCTION
PWR seismic or LOCA excitation could result in impacts between nuclear fuel assemblies and the core shroud or between fuel assemblies themselves. Forces generated during these shocks formed the basis of determining the spacer grids and fuel rod maximum design loads. The knowledge of the fuel assembly kinetics is essential to calculate these maximum loads. For that reason, we are seeking a representative model of fuel assembly vibratory behavior. Due to the complexity of such a mechanical system, this model will be found through an experimental approach. In addition to this, the model must have small degree of freedom in order to be integrated into the calculation of core response. Our study aims at characterizing the nonlinear vibratory behavior of a full-scale fuel assembly subjected to sine, random, and transient excitations. In this paper, only the sine excitation is studied. The effect of the assembly environment (air, stagnant water, and water under flow) is examined.
TEST DESIGN
Due to the complex interactions between the assembly and its environment, our hydraulic tests are designed to simulate in-core conditions as closely as possible. We performed tests using a full-scale fuel assembly. Fuel rods are loaded with natural uranium oxide or plumb pellets in order to match the mechanical characteristics of the in-core assemblies. The test facility HERMES, located in Cadarache (France), simulates the reactor geometry and its thermal-hydraulics.
Test Facility
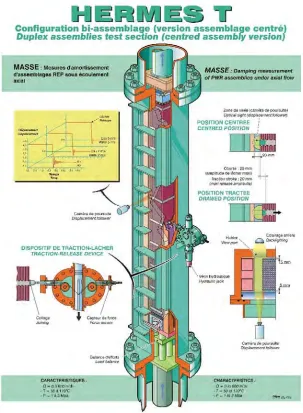
Tests on full-scale fuel assemblies are performed on our HERMES T hydraulic loop, Fig.1. We use this loop to reproduce, measure, and understand the mechanical and hydraulic behavior of the reactor core components (fuel rods, fuel assemblies, control rods, control rod guides, rod travel housings, and rod drive mechanisms). This loop is designed for flowrate up to 1200 m3/h, temperature up to 170 °C, and pressure up to 35 b. This loop has two test sections. The
main one can accommodate 2 full-scale fuel assemblies or a single centered fuel assembly (mono-assembly configuration). The Plexiglas 50 °C front door provides us full visual access of the fuel assembly. The mechanical excitation is provided by a bending and release system for the transient excitation, and by a hydraulic jack for sustained excitation. Heat is provided by the principal pump that can be operated from 350 to 1000 rpm, temperature regulation is carried out using two heat exchangers.
Assembly Configuration
Applied excitations
Two different excitations were applied to the middle grid of the assembly (grid 5 for a 10 grid assembly). The first was a transient excitation provided by a bending and release system. The fifth grid was moved away from its equilibrium state and released (free response).
The second was a sustained excitation; the fifth grid was attached to the hydraulic jack (shaker) by a pre-constrained plate (400 daN) and a displacement was imposed on the structure (forced response).
Fig. 1 HERMES T duplex assemblies test section
Test Instrumentation
The fuel assembly motion was monitored with 1 displacement transducer in water (placed on the fifth grid), and 8 displacement transducers (grid 2 to 9) in air to allow investigation at multiple assembly vibration modes. Three tracking cameras were also used in water to measure the displacement of 3 grids. For the sustained excitation, a load cell measured the force applied on the assembly by the excitation system.
Data Acquisition
GENERAL SDOF NONLINEAR MODEL
During a seism, the nuclear core principally lets pass frequencies contained within a range of 0 to 10 Hz. In this work, only the first vibration mode was studied. It is the preponderant mode in the case of assembly shock. Hence the fuel assembly was considered as a single degree of freedom system: x, the displacement on the fifth grid.
The general sdof nonlinear mechanical model is:
)
(
)
)
(
,
(
x
t
F
t
M
θ
=
ext (1)with:
))
(
),
(
)
)
(
,
(
x
t
m
x
(t)
p(x
t
x
t
M
θ
=
&&
+
&
(2)where Fext denotes the external force,
x(t)
,
x
&
(t)
,
x
&&
(t)
are respectively the displacement and its first and secondderivatives with respect to time, m is the modal mass, andθare the model parameters including m. For a linear system:
p(x
,
x
&
)
=
c
x
&
(
t
)
+
kx
(
t
)
(3) where c is the viscous damping coefficient and k the stiffness one. We can thus define the natural frequency f0and thedamping ratio ξas follow:
m k
f0 = and
m k c
. 2 =
ξ (4)
In order to identify the nonlinear behavior of a full-scale fuel assembly, two dependent problems have to be solved: the model selection, and the parameters estimation. The two different types of test can normally allow identification of the system. The bending and release tests were studied [3]. This type of test excites more than the first vibration mode and the contribution of higher modes is not negligible. Therefore, as long as the model is only mono-modal, identifications resulting from this type of test will not be accurate. The sustained tests allow a frequential filter and so the effects of higher modes on the system response are less important. Therefore, in this work, only the sustained tests are analyzed and used for the identification.
DESCRIPTION AND ANALYSIS OF THE SUSTAINED TESTS
Description of the sustained tests
During these tests, a sinus swept type displacement xexp was imposed on the fifth grid of the assembly. The resultant
force Fexpwas measured at the same point (co localized configuration). Fexp is the external force of our model. The used
sinus was constant in amplitude and swept in frequency. The sweeping allows us to sweep linearly a frequency band from f1 to f2 in a duration d.
)
Ω(s)ds
(
a
(t)
x
t
∫
=
0exp
sin
(5)with:
2 1
s
ω
ω
Ω(s)
=
+
,d f
f )
(
2 2 1
1
−
=
π
ω
andω =
22
π
f
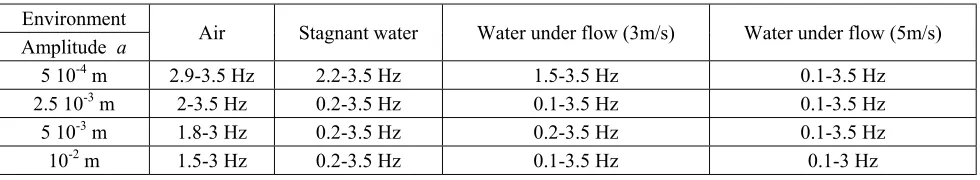
1 (6)The tests were performed at a different amplitude a and the frequency band was chosen in order to surround the first vibration mode of the mechanical system, see Table 1.
Table 1. Description of swept frequency band used
Environment
Amplitude a Air Stagnant water Water under flow (3m/s) Water under flow (5m/s)
5 10-4 m 2.9-3.5 Hz 2.2-3.5 Hz 1.5-3.5 Hz 0.1-3.5 Hz
2.5 10-3 m 2-3.5 Hz 0.2-3.5 Hz 0.1-3.5 Hz 0.1-3.5 Hz
5 10-3 m 1.8-3 Hz 0.2-3.5 Hz 0.2-3.5 Hz 0.1-3.5 Hz
Analysis of the sustained tests
In order to characterize the behavior of the fuel assembly, the tests were analyzed in different spaces. In the temporal space, the amplitude of the imposed displacement is constant whereas those of the resultant force is variable. This amplitude is minimal at the resonance (minimum of force to obtain a constant amplitude motion). In the frequency space, the Fourier transformation modulus of the imposed swept sine displacement has a constant level in the swept frequency band. In this band, the Fourier transformation modulus of the resultant force is minimal at the resonance. Energy is present in a frequency band higher than the range swept. This expresses the non-linearity of the studied system by the presence of higher harmonics that can interact with the higher vibration modes of this structure.
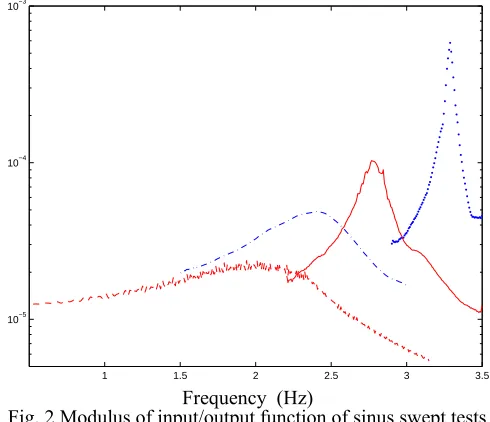
Finally, the input/output function (receptance) for small and large displacement in air and in stagnant water are displayed in Fig. 2. For all the environment, the increase in imposed displacement amplitude involves reduction in the resonance frequency as well as an increase in the spreading of the resonance peaks. For each two considered amplitudes, the contribution of the fluid seems to involve an augmentation in damping.
1 1.5 2 2.5 3 3.5
10−5 10−4 10−3
Fig. 2 Modulus of input/output function of sinus swept tests
····
5 10-4 m air,.-.-
10-2 air , 5 10-4 stagnant water, --- 10-2 stagnant waterIDENTIFICATION
The identification is only performed from the couple (xexp, Fexp), results of the sustained tests. The identification
method used is a time-domain error minimization technique. The identification is carried out separately for each environment. Linear and nonlinear identification was made.
Linear mono-test identification
The mono-test identification is a one by one test identification. The minimization criterion used for mono-test identification is:
∑
=−
21
2 exp exp
)
,
(
min
t
t t
(t)
F
(t)
x
M
θ
θ (7)
with the associate normalized error:
∑
=−
= 2
1
2 exp
2 exp exp()) , ( 100
t
t t t
(t) F
(t) F t x M
e
θ
(8)For the linear mono-test identification:
(t)
kx
(t)
x
c
(t)
x
m
(t))
x
(
M
Lθ
,
exp=
&&
exp+
&
exp+
exp (9)where
x
&
exp(
t
)
andx
&&
exp(
t
)
are numerically computed fromx
exp(
t
)
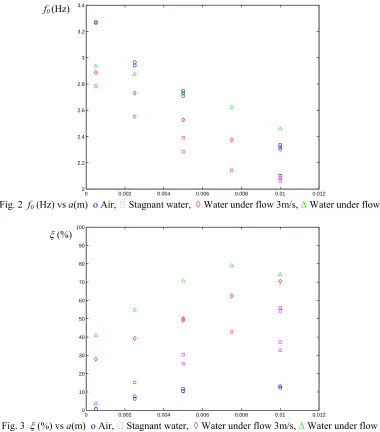
.So for each tested amplitude, we have found the equivalent linear model that best fits the vibratory behavior of the nonlinear studied system. The identified parameters θ=( m, c, k) depend on the imposed swept sine amplitude a. The
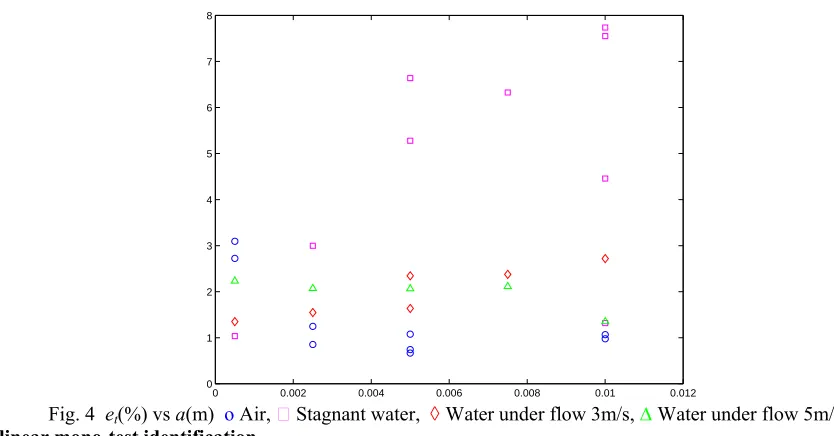
3, and Fig. 4 respectively. For all tested environments, the natural frequency decreases with the amplitude motion whereas the damping ratio increases with the amplitude motion. The damping ratio is higher in stagnant water than in air. And, in addition to this, the damping ratio increases with the flowrate. The normalized error etis strongly dependent
on the environment. This error is on the order of 1% in air, 6% in stagnant water, and 2% in water under flow (3 and 5 m/s).
The obtained linear equivalent model is limited because its parameters depend on the imposed sinus amplitude and not on the instantaneous displacement x(t). As a result, it is difficult to build the response to other types of excitation (like broad band) with such a model.
0 0.002 0.004 0.006 0.008 0.01 0.012 2
2.2 2.4 2.6 2.8 3 3.2 3.4
Fig. 2 f0 (Hz) vs a(m) ο Air, ٱ Stagnant water, ◊Water under flow 3m/s, ∆ Water under flow 5m/s
0 0.002 0.004 0.006 0.008 0.01 0.012 0
10 20 30 40 50 60 70 80 90 100
Fig. 3 ξ(%) vs a(m) ο Air, ٱ Stagnant water, ◊Water under flow 3m/s, ∆ Water under flow 5m/s
f0(Hz)
ξ(%)
0 0.002 0.004 0.006 0.008 0.01 0.012 0 1 2 3 4 5 6 7 8
Fig. 4 et(%)vs a(m) ο Air, ٱ Stagnant water, ◊Water under flow 3m/s, ∆ Water under flow 5m/s Nonlinear mono-test identification
At first, the model M was sought as a polynomial in terms of
x
andx
&
. But in order to reduce the number of parameters used in the model, we only looked for the two nonlinear preponderant terms. For that reason, the two different nonlinear classes tested were: ≤ + ≤ ≤ ≤ ≤ + ≤ ≤ ≤ + + + + = 4 2 4 0 4 2 4 0 with ) , ( and and 0 0 1 r) (q r q, j) (i j i, x x x x x k x c x m x
M i j q r
& &
&
&& α β
θ (10) and: ≤ + ≤ ≤ ≤ ≤ + ≤ ≤ ≤ + + + + = 3 2 3 0 3 2 3 0 with ) , ( and and 0 0
2 q,r (q r)
j) (i j i, x x x β x x α x x k x c x m x
M θ && & i & j & q &r (11)
For each environment, the identification was made but the selected model depends on the tested amplitude. And even if we fix a model and do the identification, the values of the parameters are strongly dependent on the amplitude. This can be caused by the fact that the classes proposed are not good or by the non-negligible influence of higher vibration modes. In order to obtain a common model for all the amplitudes, a multi-test identification was carried out.
Nonlinear multi-test identification
In order to identify, for each environment, a common model for all tested amplitudes, a minimization criterion must be found.
The first one was:
∑ ∑
= =
−
n j t tt j j
(t)
F
(t))
x
M(
n
1 2 exp, exp, 2 1,
1
min
θ
θ (12)
where n denotes the total number of tests realized for the considered environment.
But this criterion gives more weight to large amplitude tests because the values of associate forces are greater. The selected criterion, which allows us to give the same weight to all the tests, is:
{ }
(
)
min
θ
θ
J
where∑
∑
∑
= = =
−
=
n j t t t j t tt j j
(t)
F
(t)
F
(t))
x
M(
n
J
1 2 exp, 2 exp, exp, 2 1 2 1,
1
)
(
θ
θ
(13)with the associate error:
)
(
100
J
θ
e
tm=
(14)The two precedent classes were tested. There is one model which was selected for all the environments, this model belongs to the second class, it is:
x
x
c
x
x
k
x
k
x
c
x
m
x
In all the tested environments, the value of k1 is negative, which corresponds to a decrease in stiffness with the
displacement level; while the value of c1 is positive, which corresponds to an increase in damping with the velocity
level. The nonlinear damping term is the same as the one observed in the documentation for a single tube in stagnant water [2]. The adimensional identified parameters with respect to the air parameters are reported in Table 2.
Table 2. The adimensional identified parameters with respect to the air parameters
m/ mair c0 / c0air k0 / k0air k1 / k1air c1 / c1 air f0 / f0air ξ /ξair
Water 0m/s 1.40 3.21 0.97 0.79 3.55 0.83 2.77
Water 3m/s 1.19 32.39 0.91 0.67 2.52 0.87 31.21
Water 5m/s 1.12 48.11 0.92 0.56 2.15 0.91 47.61
The modal mass m increases between the air and the water environment. It then decreases with flowrate. The linear viscous damping c0 increases between air and water and increases again with flowrate. The linear stiffness k0 is
independent of the environment. The nonlinear stiffness decreases between air and water, and with flowrate. The nonlinear damping increases between air and water and decreases with flowrate.
The value of etm is about 8% in air, 4.1% in stagnant water, 1.3% in water under flow 3m/s, and 1.7% in water under
flow 5m/s. Therefore, except for the air environment, the multi-test nonlinear model (Eq. 14) fit the data better than the mono-test linear model (Eq. 14). And this, even if the multi-test nonlinear model contains less parameters than the mono-test linear model (respectively only 5 parameters versus 3 parameters for each tested amplitude). The normalized error for each test êtcomputed from the results of the multi-test nonlinear identification is displayed in Fig. 5.
0 0.002 0.004 0.006 0.008 0.01 0.012
0 1 2 3 4 5 6 7 8 9 10
Fig. 5 êt (%) ο Air, ٱ Stagnant water, ◊Water under flow 3m/s, ∆ Water under flow 5m/s
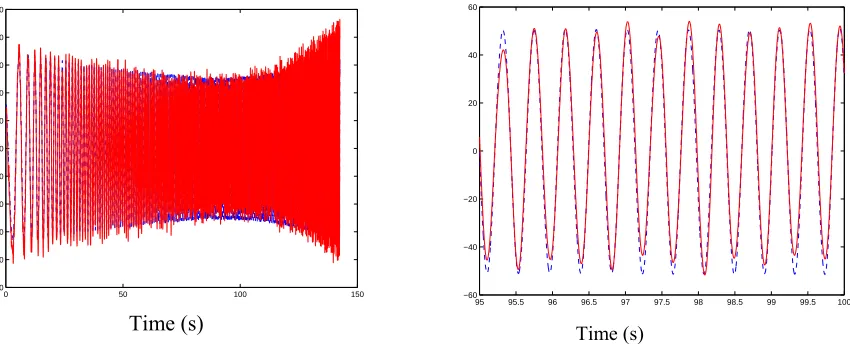
Fig. 6 Experimental resultant force (N),
---
modelized resultant force (N) for 5 10-4 m amplitude test in water (5 m/s)Time (s) Time (s)
êt(%)
Imposed swept sine amplitude a (m)
0 50 100 150
−100 −80 −60 −40 −20 0 20 40 60 80 100
95 95.5 96 96.5 97 97.5 98 98.5 99 99.5 100
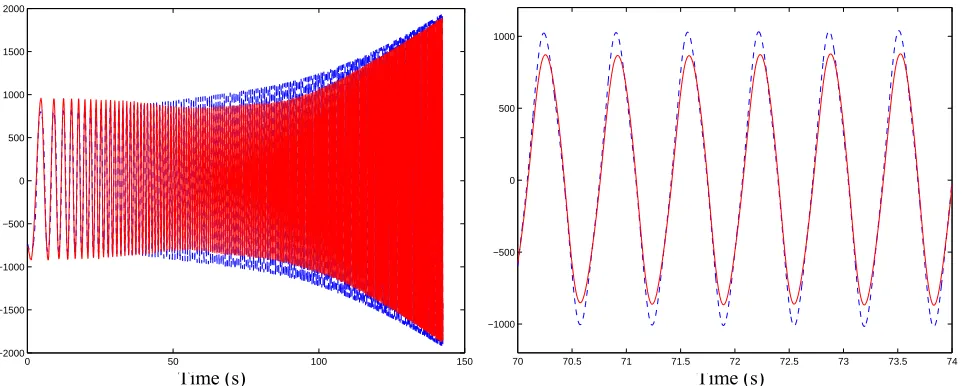
The obtained model fits the experimental data quite well. The comparison of experimental and modelized resultant forces, in water under flow (5 m/s), for small and large amplitude tests is displayed in Fig. 6, and Fig. 7. In these graphs we can see that the passage to zero is well reproduced. But the maximum, and in particular at the resonance, is not well matched.
Fig. 7 Experimental resultant force (N),
---
modelized resultant force (N) for 10-2 m amplitude test in water (5 m/s)CONCLUSION
The analysis of test series shows that the vibratory behavior of a full-scale fuel assembly is strongly nonlinear. An identification phase allows us to obtain a nonlinear model representative of the first vibration mode of the fuel assembly. The selected model is efficient in air, in stagnant water, and in water under flow. In all tested environments, the stiffness decreases with the displacement level and the damping increases with the velocity level. In the presence of water the damping increases and increases yet again with flowrate.
In order to obtain more accurate vibration characteristics and to extend this model to other types of excitation, the next stage of this study will be a multi-modal approach.
REFERENCES
1. Ewins, D.J., Modal Testing: Theory and Practice. Research Studies Press LTD (2000). 2. Blevins, R.D., Flow Induced Vibration. Krieger Publishing company (1990).
3. Rebelle, J., Contribution à la modélisation du comportement non-linéaire d’un assemblage combustible R.E.P. . Thèse de troisième cycle, Université Aix-Marseille II (1998)
4 Barbier, D., Rigaudeau, J., Vialet , E., Damping from axial coolant flow in the response of PWR fuel assemblies to seismic loads. ICONE 6, (1998) paper 6156, San Diego.
5. Shah, S.J., Brenneman, B., Rigaudeau, J., Comparison of analytical and experimental damping under axial flow for different fuel assembly types. ICONE 9 (2001), Nice.
6. Rigaudeau, J., D’Uston, B., Fluid effects in seismic response of PWR fuel assemblies. ASME PVP (1999). Time (s)
Time (s) 70 70.5 71 71.5 72 72.5 73 73.5 74
−1000 −500 0 500 1000
0 50 100 150