ABSTRACT
FOSTER, JR., HOWARD ALLEN. Opto-electronic Technique For Error Fault Detection In Textile Joining Applications. (Under the direction of Hans Hallen.)
The purpose of this research has been to develop an opto-electronic method for
detecting error faults in textile joining applications. The application of this study would
be in on-line determination of skipped stitches in seam sewing operations. The research
begins with a selection of materials that covers a range of textile materials commonly
used, and then determining several physical parameters based upon industry standards.
The next portion of the research is to determine the proper wavelength of light to use for
the opto-electronics, using near infrared and visible spectrophotometric techniques for
acceptable light reflection levels for qualitative analysis. This study then focuses on
using NIR wavelength light at 1550nm, using an InGaAsP laser diode module with optics
and corresponding Germanium photodiode detector with a wavelength-matched
interference filter, to monitor a stitch line passed by the test apparatus to determine the
presence of skipped stitches, or stitches where the top thread and looper thread do not
properly catch and hold in the sewing of a seam. Due to the spot size of the
manufactured laser diode module, a ½” basting stitch, commonly used to temporarily
attach fabric pieces, is selected as the best stitch type to use to verify the hypothesis.
After determining the ideal positions of the laser diode and photodiode assemblies using
geometric optics arguments and extensive position-related intensity measurements, the
assembly is mounted onto a linear slide table, and fabric samples, sewn with the ½”
basting stitch to simulate a seam, are aligned and tested for variations in light levels based
on the presence of a stitch or a space. It is then shown that this method for detecting
skipped stitches is a viable alternative to the current visual inspection performed by
Dedication
I’d like to dedicate this research to all my family and friends whose unwavering
love and support have uplifted, enlightened and amazed me for a number of years. There
are too many of you to name, but each of you know that I write of you.
I’d also like to specifically dedicate this research to several people:
• To Kevin and Mike, the better two-thirds of the Three Physics Stooges triumvirate (No, we’re not in a band.);
• To Gwen, the love for which I’ve looked a long time (Go Team Mosquito!);
• To Elizabeth, the friend of a lifetime (well, 1/3 of it so far);
• To Jenny, the best graduate office administrator ever cited in a body of work;
• To my professors who have been so very patient with this work; and, of course,
• To my mother and father whose love of learning inspired my sister and myself to
excel not only in our educational careers, but also in every aspect of our lives.
Thanks Mom and Dad!
Biography
Howard Allen Foster, Jr. was born on May 14, 1971 in Raleigh, the mighty capital
of North Carolina. However, he spent the better part of his life growing up in the
foothills of western NC, in small Forest City.
After graduating with honors from East Rutherford High School and Isothermal
Community College, he returned to Raleigh to educate himself at the finest school in the
South: North Carolina State University. His chosen path: applied physics.
Much of his life was spent working with his hands (and his back) with his father,
who gave him a love of the contact of work and an insatiable curiosity of what makes
things work. Not satisfied to merely function as a part of a process, Howard has striven
to learn all the ins and outs of every occupation he has held. To that end, Howard has
maintained not only the educational sense that comes from his text books, but also the
common sense bestowed upon him by members of his family who saw fit to make him
into the well rounded man that he is today.
Howard enjoys reading nearly all printed material, which makes him the
somewhat irritating “master of all things trivial” that his friends claim him to be. He also
has a fantastic sense of humor, enjoys long walks on the beach, listening to the night rain
Acknowledgements
There are a number of sources worthy of acknowledgement for the work
contained herein. First, the original sponsors of this work were the National Textile
Center, a federally funded consortium of six major US universities which strive to keep
the US textile industry at the forefront through support of research in developing
technologies.
Next, to Dr. Timothy Clapp and Dr. Kimberly Titus, of the NCSU College of
Textiles, the originators of this research and selectors of Howard Foster as the student
worthy of the research. Their support and aide throughout the process was founded on
the desire to not only further the US textile industry, but also to assist in the education
and advancement of all the students under their tutelage.
Finally, to Dr. Hans Hallen, of the Physics Department at NCSU, the committee
chair for this graduate work, without whose guidance, patience, and supreme abilities as
an educator, this body of work would not have been completed.
Table Of Contents
List of Tables viii
List of Figures ix
1. Introduction... 1
1.1 Defining The “Skipped Stitch” ... 2
1.2 Opto-electronic Sensing Devices In The Textile Industry... 4
1.2.1 Determining The Number Of Layers In A Seam Using Opto-electronics Combined With Tactile Devices ... 5
1.2.2 Determining The Number Of Layers In A Seam Using Opto-electronic Devices... 6
1.2.3 Opto-electronic Detection Of Skipped Stitches... 8
2. Introduction Of Test Materials... 11
2.1 Initial Fabrics ... 11
2.1.1 Denim Fabrics... 11
2.1.2 Airbag Fabrics... 12
2.1.3 Stitch Thread Material ... 13
2.2 Physical Parameters Of Initial Fabrics... 13
2.2.1 Environmental Conditioning... 14
2.2.2 Fabric Weight... 14
2.2.3 Yarn Count... 14
2.2.4 Yarn Crimp Ratio And Yarn Take-up Ratio... 17
2.2.5 Yarn Diameter... 18
2.3 Near Infrared Wavelength Spectrophotometric Analysis ... 19
2.3.1 NIR Wavelength Spectrophotometer Equipment ... 20
2.3.2 Fabric Preparation And Orientation Distinctions ... 24
2.3.3 NIR Wavelength Spectroscopy Data Analysis ... 29
2.3.3.1 Multiple Layer Comparison... 30
2.3.3.2 Warp Thread vs. Weft Thread On Long Side Comparison ... 33
2.3.3.3 Ribbing Turned Horizontal vs. Vertical Comparison ... 36
2.3.3.4 Color Comparison Across All Test Fabrics ... 39
2.3.3.5 Determination Of Suitable Wavelengths For Research Use... 40
2.4 Visible Wavelength Spectrophotometric Analysis ... 48
2.4.1 Visible Wavelength Spectrophotometer Equipment... 48
2.4.2 Fabric Preparation And Orientation Distinctions ... 50
2.4.3 Visible Wavelength Spectroscopy Data Analysis... 51
2.4.3.1 Color Comparison Across All Test Fabrics ... 51
2.4.3.2 Color Comparison Of Test Fabrics Grouped By Color ... 52
2.5 Final Test Fabrics ... 57
2.5.1 Common Usage Of Final Test Fabrics... 58
2.5.2 Physical Parameters Of Final Test Fabrics ... 59
2.5.3 NIR Wavelength Spectrophotometric Analysis Of Final Test Fabrics... 59
3. Equipment Selection And Device Arrangement ... 64
3.1 Laser Diode Assembly Selection ... 65
3.1.1 Optics In The Laser Diode Assembly And Resulting Spot Size ... 65
3.2 Photodiode And Filter Selection... 68
3.2.1 Interference Filter Selection... 68
3.2.2 Electronics For The Photodiode Circuit ... 69
3.3 Data Collection ... 71
3.4 Test Apparatus Assembly ... 71
3.4.1 Table Top Version Assembly ... 72
3.4.2 Determining The Orientation Of The Components ... 75
3.4.2.1 Orientation Of The Laser Diode Assembly ... 76
3.4.2.2 Orientation Of The Photodiode Assembly... 81
3.4.3 Final Orientation Of The Laser Diode And Photodiode Assemblies In The Test System... 90
4. Test Samples Final Preparation And Organization ... 92
4.1 Stitch Type ... 92
4.1.1 Stitch Size ... 93
4.1.2 Stitch Alignment And Uniformity ... 94
4.2 Final Sample Preparation... 94
4.2.1 Edge Fraying Resolution... 95
4.2.2 Environmental Conditioning... 96
4.3 Test Sample Arrangement On The Test System... 96
4.4 Cross Sectional Selection Of Final Test Samples For Analysis ... 97
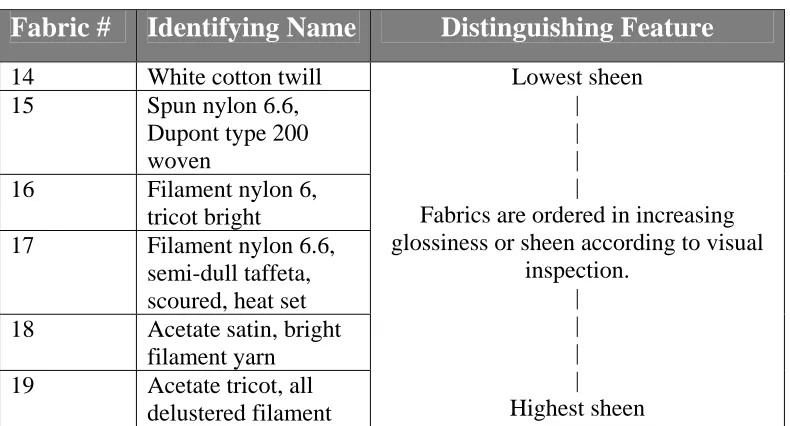
4.4.1 Stitch Thread Selection For Study ... 98
4.4.2 Sheen Of Material ... 98
4.4.3 Number Of Stitch Lines Tested ... 99
4.4.4 Test System Movement Direction ... 99
4.4.5 Data Organization And File Nomenclature ... 100
5. Test System Data And Analysis ... 101
5.1 Final Test System Manipulation And Resulting Data Presentation... 101
5.2 Placement And Organization Of The Final Test Samples ... 102
5.3 Collected Data Graphed For Analysis ... 105
5.4 Using Voltage Contrasts To Evaluate Voltage Variations ... 121
5.4.1 Final Data Comparisons... 125
5.5 Evaluation Of Contrast For Quality Control Pass/Fail Levels... 131
6. Conclusion ... 135
6.1 Future Recommendations ... 135
7. Literature Citations ... 138
8. Appendix... 141
8.1 List Of Tables ... 142
List Of Tables
Table 2-1a: Denim Fabric Identification Table...12
Table 2-1b: Airbag Fabric Identification Table...12
Table 2-2: Test Fabric Grouping For Comparison Of NIR Spectroscopy Data...29
Table 2-3: Difference In % Reflectance For Fabrics #1-13 At
1550nm And 2200nm ...41
Table 2-4: Difference In % Reflectance For Fabrics #1-13 At
Select Wavelengths... 55
Table 2-5: Final Test Fabric Identification Table... 58
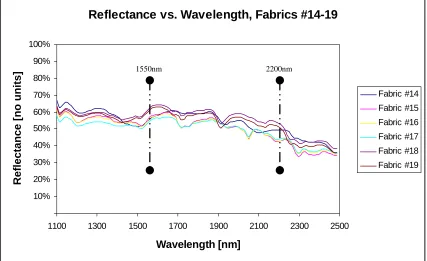
Table 2-6: Difference In % Reflectance For Fabrics #14-19 At
1550nm And 2200nm ...63
Table 3-1: Determining Factors In Equipment Selection...64
Table 3-2: Discernability Of Voltage Variation Caused By
Stitches For Photodiode Angle Tests...86
Table 5-1: Final Test System Data Organization ...104
Table 5-2: Average Contrasts For Fabrics #14-19, Sorted By Thread Color...124
Table 5-3: Contrast Data For True/False Peaks For Fabric #17,
Tan Stitch Thread... 133
List Of Figures
Figure 1-1: Image Of A Skipped Stitch [36] ...3
Figure 1-2: Examples Of Properly Formed Stitches (Left) And A Skipped Stitch (Right) [2]...3
Figure 1-3: Draper Labs’ Needle Thread Motion Sensor [2] ...9
Figure 1-4: Porat And Alagha’s Optical Miss Stitch Detection System [13] ...10
Figure 2-1: Example Images Of Test Fabrics For Yarn Counts ...16
Figure 2-2: NIR Wavelength NSAS Spectrophotometer Test Device ...22
Figure 2-3: Representative Data From The NIR Spectrophotometer For Cotton And Nylon ...24
Figure 2-4: NIR Wavelength Spectroscopy Data File Name Format ...26
Figure 2-5: Example of Denim “Ribs” Due To Weave Style...27
Figure 2-6: NIR Wavelength Spectroscopy Data File Name Format For Ribbing Orientations ...28
Figure 2-7: Multiple Layer Comparisons For Fabrics #1, 5, 10, And 12 ...31
Figure 2-8: Comparison Of Warp vs. Weft On Long Side And Front vs. Back For Fabrics #2, 6, 9, And 13, Three Layers ...34
Figure 2-9: Diffuse Scattering From Fabric Surface ...36
Figure 2-10: Comparison Of Horizontal vs. Vertical Ribbing And Front vs. Back For Fabrics #1, 3, 4, 5, Three Layers...38
Figure 2-11: Color Comparison For Fabrics #1-13, Near Infrared Spectrum, 1100-2500nm...39
Figure 2-12b: Comparison Data For All Test Fabrics At 1550nm
And 2200nm...44
Figure 2-13: Visible Wavelength Macbeth Spectralight Test Device ...49
Figure 2-14: Color Comparison For Fabrics #1-13, Visible Spectrum, 400-700nm ...51
Figure 2-15: Color Comparison For Fabrics #1-13, Visible Spectrum, 400-700nm, Grouped By Color ...53
Figure 2-16: Select Wavelengths Comparison In All Categories For Fabrics #1-13, In The Visible And NIR Spectrums...56
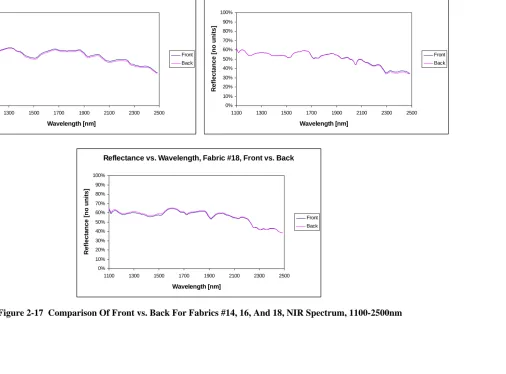
Figure 2-17: Comparison Of Front vs. Back For Fabrics #14, 16, And 18, NIR Spectrum, 1100-2500nm ...61
Figure 2-18: Reflectance Comparison For Fabrics #14-19, NIR Spectrum, 1100-2500nm...62
Figure 3-1: Gaussian Curve With Linear Line Overlay Showing Human Eye Interpretation Of Spot Size vs. Actual Spot Size (Not To Scale)...67
Figure 3-2: Schematic Diagram Of Photodiode Circuit ...69
Figure 3-3: Test System Assembly, Front View...73
Figure 3-4: Test System Assembly, Side View ...74
Figure 3-5a-c: Vertical Arrangement Of Laser Diode Using Geometric Optics ...77
Figure 3-5d-f: Horizontal Arrangement Of Laser Diode Using Geometric Optics ...78
Figure 3-6: Orientation Of Photodiode For Position Determination ...82
Figure 3-7: Map Of Wedge Around Laser Incident Spot For Intensity Mapping ...84
Figure 3-8: Voltage Measurement For ½” Basting Stitch, Showing Discernability Of Stitches For Photodiode
Angle Tests ...88
Figure 4-1: Basting Stitch, Top View (A) And Fabric Plane View (B) ...93
Figure 4-2: Final Data File Name Format ...100
Figure 5-1: Final Collected Data For Stitch/Space Variance For
Fabric #14, All Thread Colors ...106
Figure 5-2: Final Collected Data For Stitch/Space Variance For Fabric #15, Minimum And Maximum Stitch
Thread Diameters...107
Figure 5-3: Final Collected Data For Stitch/Space Variance For
Fabric #16, All Thread Colors ...108
Figure 5-4: Final Collected Data For Stitch/Space Variance For Fabric #17, Minimum And Maximum Stitch
Thread Diameters...109
Figure 5-5: Final Collected Data For Stitch/Space Variance For
Fabric #18, All Thread Colors ...110
Figure 5-6: Final Collected Data For Stitch/Space Variance For Fabric #19, Minimum And Maximum Stitch
Thread Diameters...111
Figure 5-7: Voltage Variation Data For Stitch/Space Levels For
Fabric #14, Black Stitch Thread ...112
Figure 5-8: Voltage Variation Data For Stitch/Space Levels For
Fabric #16, Green Stitch Thread...114
Figure 5-9: Voltage Variation Data For Stitch/Space Levels For
Fabric #17, Tan Stitch Thread ...116
Figure 5-10: Voltage Variation Data For Stitch/Space Levels For
xii Figure 5-11: Sketch Of Fabric “Bulges” In Space Intervals Due
To Thin Material ...119
Figure 5-12: Example Graph Of Single Peak Evaluation For
Contrast Measurement ...122
Figure 5-13: Voltage Contrast Data For Fabrics #14, 16, And 18...127
Figure 5-14: Voltage Contrast Comparison For All Fabrics vs.
Min/Max Thread Diameters...128
Figure 5-15: Voltage Contrast Data vs. Increasing Stitch Thread Diameter ...129
Figure 5-16: Voltage Contrast Data vs. Thread Color In
Increasing Wavelength...130
Figure 5-17: Voltage Variation Data For Stitch/Space Levels For
1. Introduction
Inspection of sewn seams has long been a method of quality control in the textile
industry. The inspection is carried out in one or more of the following ways: an
employee is required to visually inspect the seam of a garment as it is being sewn, extra
employees are hired whose job is to visually inspect each garment as it comes from the
sewing section of a factory, or there is an automated tactile process which measures a
variable in the sewing process such as sewing thread tension. The time and man power
requirements of the first two methods are costly, and this cost is eventually passed on to
the consumer. The third is a rapidly developing technology, but also must contend with
the argument that any time the material, fabric or thread, comes in contact with another
object, there is a higher potential of material failure due to the wear and tear caused by
the added contact. The development of a non-tactile, non-destructive system for
inspection during the sewing process, such as an opto-electronic, or vision, system,
could provide immediate feedback of sticth defects to the sewing machine operator, free
employees for more production lines, and reduce the cost of products for the consumer.
This research focuses on the development of such an opto-electronic system for
the inspection of sewn seams. The following sections define the problem, review
research of the use of opto-electronic inspection systems in the textile industry to
increase quality in production, and which could possibly be adapted to skipped stitch
detection, and, review research on opto-electronic skipped stitch detectors already in use
1.1 Defining The “Skipped Stitch”
This research is based upon a new idea to determine a joining error caused by a
skipped stitch. A stitch is made of two entirely separate threads, a top thread and a
bobbin thread. The top thread is visible from the top or outside of the seam, while the
interlocking bobbin thread is visible from the bottom side of the seam. A stitch is fromed
when the top needle and the looper needle, the top thread and the bobbin threads’
respective needle names, pass one another on the underside of the seam during the
sewing process. Timing is crucial for this operation such that the threads cross one
another and pull tight via only the friction between them to form a strong bonding stitch.
End knots are used to keep the threads from pulling apart from one another and ruining a
seam.
Several factors may cause a skipped, or dropped, stitch. Broken threads are the
culprits most of the time. Machine timing being slightly off, or mis-calibration of the
sewing machine for the type of seam, mainly number of layers, are other major causes.
Minor reasons may include broken needles, oil or dirt on the needles or threads, and
fabric misfeeds. While many of these problems would cause an obvious seam problem,
mainly the complete stoppage of the sewing process, as machinery and understanding of
the working and formation of stitches advance, the number of “catastrophic” failures
decreases. What is left are the minor faults or skipped stitches where the sewing process
continues. The seam is finished because the threads realign and begin forming a proper
stitch again. An example of this is seen below in Figure1-1.
Figure 1-1 Image Of A Skipped Stitch [36]
This research is focused upon those failures which are not immediately obvious in
the sewing process, but may be picked up later in the inspection process, or, worse,
further downline after washing when the material cannot be salvaged for reuse. As an
example of the type of failure this study is based upon, see Figure 1-2, below.
Skipped Stitch Properly
Formed Stitch
Top View of Seam Bottom
View of Seam
Figure 1-2 Examples Of Properly Formed Stitches (Left) And A Skipped
In Figure 1-2, the stitchline on the left shows a properly formed stitch as viewed
from the top of the seam. Note the regular pattern of stitches. The stitchline to the right
shows the top and bottom of a skipped stitch. On the bottom of the seam, the looper
thread has not been properly caught by the top thread and as the top needle ascended it
pulled the top thread back out. When the top thread is not caught on the underside of the
seam, the regular pattern seen in the stitchline on the left of the figure is broken by what
the industry calls a “skipped stitch,” as pointed out in the righthand stitchline.
Given the view of the properly formed stitch, we hypothesize that a repeated
pattern could be discerned from the regular formation of seams by monitoring the amount
of light reflected back from the stitch line using a non-tactile, optical detection system.
When this pattern is broken, by a skipped stitch, the system could alert the worker to halt
the sewing process and remove the faulty seam. By placing the system on the sewing
machine in such a position that it has a clear view of the seam just after it has been sewn,
defects can be found immiediately. The sewing threads could then be removed and the
fabric pieces resewed with minimal waste of time, effort and more importantly, material.
Such an optical test system is the point of this research.
1.2 Opto-electronic Sensing Devices In The Textile Industry
Opto-electronic sensing devices are widely used by many industries, including the
textile industry. Usage of these devices in the textile industry include detection of faults
such as holes [17, 20], slubs [11], uneven dyeing [31], stains [21, 27], broken threads [8,
28, 30], mising threads [15], and misoriented threads [20]; count of warp and weft yarns
[23, 41]; post-dyeing and –washing shrinkage [32]; parameter measurements such as
length and width [33], thickness [25, 29, 33], roughness [14], yarn orientation [19, 22],
warp/weft density [18], crimp [34] and surface characterization [1, 7]; pattern
characterization and recognition [22]; and uses in final garment production [2, 4, 5, 16,
36]. As the reader will note, the majority of these reports deal with the opto-electronic
detection of defects for woven fabrics, or webs, for defects in the manufacture of the
material. The research of interest to this study deals with the testing of finished products
which would be passed on to the consumer. Two areas of interest studied here are in
garment production. Specifially, the study of seams of garments to detect two types of
possible faults: number of layers in the seam and skipped or missed stitches.
1.2.1 Determining The Number Of Layers In A Seam Using Opto-
electronics Combined With Tactile Devices
The number of layers in a seam depends on the type of seam the sewer wishes to
produce. Occasionally, the edge of a layer in a seam does not get fed correctly and the
stitch holding the edge is near enough to that edge that under some stress, such as
washing, the seam may fall apart. There are products available that detect and correct the
position of the edge before being sewn. Two examples of this type of device are made by
AMF Reece [36]. The devices are actually folders, much like the ones used in most
seaming machines, however, these have fiber optic sensors that determine the position of
the edges in the folder and then, using splined wheels, control the position of the edges
within the folder so that the final seam has edges which are correctly placed. However,
these are tactile devices that in touching the fabric may do some damage to the fabric,
edge of the layer either on the way to being sewn or after being sewn without physical
contact with the fabric.
1.2.2 Determining The Number Of Layers In A Seam Using Opto-
electronic Devices
Due to positioning of the sewing machine and the operator, it would be easier to
position a sensor on the fabric after the stitching has taken place. Here a sensor may find
a fault and alert the operator so the piece may be repaired or removed from the
production line saving the manufacturer time and money. This is where opto-electronic
sensors would be useful, due to their relatively small size and cost. Using some form of
light to pass through the fabric, detection of the number of layers in the seam may be
possible. Various research has been published on the principal of light transmission and
its application to fabrics. Mostly, the research is done to determine the density of a
single-layer, or a still or running web [3, 18]. These authors’ research focused mainly on
the determination of the density of a single layer to aid in quality control measurements,
and material classification for producer to consumer sales, rather than number of layers
for final production items.
A more promising direction is the use of laser triangularization to determine the
thickness of the fabric [25, 29]. This method uses reflected light from the surface of the
fabric. Light is initially shone onto a reflective surface and received by a photosensitive
detector. When a piece of fabric is put over the reflective surface the position of the
reflected light on the detector is changed due to the difference in height. In this manner
the thickness of the fabric can be gauged. The authors posit that this may be extendible
to determine the number of layers in a seam, but again their research focuses on the
quality control measurement issues, rather than in-line detection systems.
Another possible method is the use of reflected light and charge-coupled device
(CCD) cameras or fiber optic arrays to detect position or intensity of singular, or arrays
of, reflected pinpoint light beams [9]. By studying the pattern of the reflected light Liu,
et. al. were able to tell the thickness of a material by the curvature and change in reflected
patterns. Similar work was done by Toba and Sawaji [20] to use the speckle patterns
produced by diffracted light off of the surface of a web to determine if there were
irregularities in the material. There are several interesting studies outside of the textile
industry also done on the pattern of reflected light off of surfaces to determine surface
features [6, 10, 26]. Possibly two or more of these methods may be combined to give a
reliable and repeatable reading of the number of layers in a seam.
Redefining the application of these methods could be used to aid in the detection
of skipped stitches, the focus of this study. Specifically, the seam could be analyzed to
determine if the edges of the seams are placed correctly to hold under stress or if the
number of layers are correct in the seam indicating that the seam could potentially pull
apart under some stress. Unfortunately, these methods could not be easily applied in the
on-line inspection of skipped stitches as they would merely indicate an area where a seam
is weak and a skipped or weak stitch could cause a problem when the seam is stressed.
Thus, a visual inspection would still be needed for skipped stitches or the seam would
need to be stressed in some fashion to prove it would “hold together” compliant with
some standard. To this end, more research has been done for the optical detection of
1.2.3 Opto-electronic Detection Of Skipped Stitches
The second area of interest where the development of opto-electronic sensing
devices may be useful is in detecting skipped stitches. There have been many studies of
skipped or missed stitch detection in sewing of seams and decorative stitching. In fact,
there are several patents issued for skipped stitch detectors [5, 16]. To date, these
detectors have been mainly based on tactile sensing of top thread or bobbin thread
tension going into the stitch [4, 12]. If the tension on the sensor drops below a certain
value, the detector alerts the operator through visual or audible alarms. There are also
many tension devices used in monitoring multiple threads in tufting and weaving [24, 28,
30] which may be adaptable to detecting skipped stitches. While these detectors function
reasonably well, the problem still exits of having the detector coming in contact with the
thread possibly causing damage which may cause the seam to fail or a visual defect in the
decorative stitching reducing consumer appeal.
One promising system was developed and patented by Bellio [2] in 1993 for
Draper Labs, Inc. His method involved passing the thread through an optical detector
between the take-up lever and the needle. An enlarged view of the sensor is seen below
in Figure 1-3.
Photodetecto
Light Beam
Figure 1-3 Draper Labs Needle Thread Motion Sensor [2]
An LED is used to project a beam of light down the channel perpindicular to the
thread channel, which is then received by a photodetector. Variations in the absorption
and transmission of the received beam are registered as thread movement through the
thread channel. These movements are correlated with a timing system attached to the
sewing machine’s shaft, which controls the motion of the sewing needle, to show that a
stitch was properly formed. If the shaft timing and the thread motion do not match up,
either due to thread breakage or misformed stitches, an alarm can be rung to alert the
sewer of the defect.
Another system, developed by Porat and Alagha [13], detected skipped stitches by
placing an optical fiber and lens arrangement inside a 401 chainstitch sewing machine, a
common stitch type used in garment production, to detect for the proper formation of the
underside of the stitch, as seen in Figure 1-4, below. When a stitch is properly formed, a
“triangle” is formed consisting of the needle thread loop, looper, and looper thread.
the light is diffracted by the presence of the needle thread loop in a properly formed
stitch. Thus, an absence of the “break” in the beams’ intensity implies that a stitch was
not properly formed.
Figure 1-4 Porat And Alagha’s Optical Miss Stitch Detection System [13]
This system is not, however applicable to all types of stitches as not all form the required
triangle below the surface of the fabric. Also, not all sewing machine interiors can
accommodate even the smallest fiber optic probe, due to their surrounding structure (such
as special tables), positioning of the worker, and small body size of the machine.
2. Introduction Of Test Materials
The material chosen for this study was an important factor, so many preliminary
tests were done to determine the material, fabric as well as stitch thread, to use. This led
to the selection of the equipment used, the arrangement of the equipment, and the method
of testing for skipped stitches. These initial tests include a general survey of the textile
industry for commonly used materials, determination of several American Society of
Testing and Methodology (ASTM) standard physical parameters, and near infrared and
visible spectrophotometric analysis.
2.1 Initial Fabrics
Two of the most widely used materials in the textile industry are cotton twill, or
denim, and woven nylons, commonly used in the airbags of motor vehicle safety devices.
The denim and nylon materials were also chosen for the initial testing because of their
ready availability, sturdy construction, and well documented properties.
2.1.1 Denim Fabrics
The denim fabrics were divided into ten distinct categories according to variations
in coloration of warp thread, the longer thread running parallel to a fabric rolls’ edge, or
selvage edge, and weft thread, the thread which traverses the fabric. The color variation
was chosen to aid in the selection of the wavelength of light most suitable for a wide
variety of textile fabric colors. Table 2-1a below shows the classification of the denim
Table 2-1a Denim Fabric Identification Table
Fabric #
Identifying Name Distinguishing Feature
(warp thread color, weft thread color)
1 White white, white
2 Tan tan, tan
3 Beige beige, white
4 dark green green, white
5 blue #1 blue, white (brightest blue)
6 blue #2 blue, white (medium blue)
7 blue #3 blue, white (dull blue)
8 black #1 gray, white
9 black #2 black, white
10 black #3 black, black
2.1.2 Airbag Fabrics
The three airbag fabrics were similarly categorized, but according to their weave
tightness rather than color, as all the fabrics were pure white, or undyed. Similar to the
color range the weave variation was chosen to aid in the selection of the wavelength of
light used for this study. Table 2-1b below shows the classification of the airbag fabrics.
Table 2-1b Airbag Fabric Identification Table
Fabric #
Identifying Name Distinguishing Feature
(weave tightness)
11 Airbag #1 loose weave
12 Airbag #2 medium weave
13 Airbag #3 tight weave
A more complete manufacturer’s description can be found in the Appendix, Table
A-1.
2.1.3 Stitch Thread Material
The thread chosen for the stitching was also an important consideration. The
thread preferred was of a type commonly used in the textile industry for garment
manufacturing. It is made up of a polyester core about which two cotton threads are
twined. This makes for a robust and inexpensive thread for which the color variation is
only limited by the dyes available in the textile industry. Eight colors were selected for
this study for further examination of the effect of color in the detection of skipped
stitches. The colors were black, light blue, green, orange, purple, red, tan, and white.
2.2 Physical Parameters Of Initial Fabrics
There are a number of important characteristics used to define a fabric in the
textile industry. These characteristics are often referred to as the physical parameters of
the fabric. Five of these parameters that were determined for the various fabrics used in
this study are fabric weight, average yarn count, average yarn crimp ratio, average yarn
take-up ratio, and the average diameter of the threads that make up the fabric. The
American Society of Testing and Methodology (ASTM) has defined a number of
methods for determination of the physical parameters of materials ranging over all the
current industries in the US allowing a standard method of determining and reporting
these parameters. Respectively, the ASTM Test Method Designation for the above listed
parameters are: D3776, D3775, D3883 (both crimp and take-up), and D204 [38, 37, 39,
40]. The fabrics were prepared and conditioned according to these standards and the
following is a description of the test methods. The tabulated results can be seen in the
Appendix, Table A-2.
2.2.1 Environmental Conditioning
Before any testing was done on the samples, they were prepared for size and
shape and then conditioned via the standard ASTM 1776. This standard outlines that the
samples be in the test area for a minimum of 24 hours. The “test area” is described as an
environmentally controlled lab setting of atmospheric pressure, temperature, and relative
humidity. For this study, the variables were equivalent to exterior atmospheric pressure,
and approximately 68ºF and 40% relative humidity.
2.2.2 Fabric Weight
To determine the weight per unit area of a fabric, a 6” x 6” square is cut from
each fabric and weighed on a sensitive scale. The measurements are then converted to
give ounces per square yard and grams per square meter, for comparison in English and
SI units. The results for the average weight of the 13 fabrics of this study are seen in
Table A-2.
2.2.3 Yarn Count
The average yarn count of a fabric is determined by counting the number of warp
or fill yarns per inch using some sort of magnification device. For this study a video
microscope was used to examine a sample cut from the fabrics. A small scale was used
in the frame of the picture to help determine the lengths counted over. For the average
values, the fabric count is sampled in five random locations, for both warp and fill yarns,
at least one inch away from any cut edge, to avoid miscalculation due to stretching from
cutting the fabric samples. Figure 2-1, below, shows images from the video microscope
for fabrics #1, 3, 11, and 13. This figure shows the view of four fabrics with a millimeter
scale in each view for counting threads. Additional images found in the Appendix Figure
A-21, show more examples of fronts and the backs of two of the fabrics. The results for
(a) Fabric #1, White Denim, (b) Fabric #3, Beige Denim,
Front Side, Front Side,
Warp Perpendicular to Warp Perpendicular to
Millimeter Scale Millimeter Scale
(c) Fabric #11, Loose Weave (d) Fabric #13, Tight Weave
Nylon, Front Side, Nylon, Front Side,
Warp Perpendicular to Warp Perpendicular to
Millimeter Scale Millimeter Scale
Figure 2-1 Example Images Of Test Fabrics For Yarn Counts
2.2.4 Yarn Crimp Ratio And Yarn Take-up Ratio
The average yarn crimp ratio and the average yarn take-up ratio are related quantities
with subtle differences. Yarn crimp is defined as the “undulations or waviness in a yarn
due to interactions with other yarns” [39], and is reported as a percent based on the
in-fabric distance. Yarn take-up is defined as the “additional length of yarn used to make a
given length of fabric” [39], and is reported as a percent based on the out-of-fabric
distance. The test method for both of these parameters is as follows:
1. Determine a set length in the fabric of both the warp and fill yarns at least 1”
away from any cut edge, this will be the in-fabric length;
2. Mark or carefully cut the yarns at this length and unravel the fabric to at least 1”
from a cut edge;
3. Remove 10 successive yarns from the fabric;
4. Using a specific tension for all the samples, measure and average the out-of-fabric
5. Determine the yarn crimp and yarn take-up ratios using the following equations:
C = 100 * (Y - F)/F Eq. 2-1
T = 100 * (Y - F)/Y Eq. 2-2
Where: C = yarn crimp [%]
T = yarn take-up [%]
F = in-fabric length
Y = out-of-fabric length under a specific tension
This study followed the method outlined above with the following conditions:
• A dye was used to cut all the samples a specific length of 9 3/8”
• Tension was applied to each sample by attaching a 14.662 g mass to one end
of the yarn, holding for five seconds and then measuring the length of the
sample by holding it up to a ruler in a vertical position (no relaxation)
The values were averaged and tabulated in Table A-2.
2.2.5 Yarn Diameter
The average yarn diameter for the warp and fill yarns was calculated by cutting
small samples from the unraveled yarns used for the crimp and take-up ratios and looking
at them under a microscope at 10X magnification. Five samples of both warp and fill
yarn from each fabric were made and the values were averaged. In general the yarn
samples are held on the microscope slide using mineral oil to create a seal between the
slide and the cover glass, as outlined by ASTM Standard D204 [40]. After a few trials
with the cotton samples, however, it was determined that even in a short amount of time
the yarns absorbed enough oil to make a significant difference in the size of the yarns and
thus application of the oil was abandoned and all the samples were re-measured dry. A
listing of the measurements are found in Table A-2.
Eight final stitch threads were chosen to use as test samples. The average yarn
diameter of the threads was also measured as stated above and are reported in Table A-2.
2.3 Near Infrared Wavelength Spectrophotometric Analysis
To determine the best wavelength of light to use in this study, a technique known
as spectrophotometric analysis was employed to gauge the test materials’ light
reflection/absorption/transmission qualities. Near infrared wavelength light, 1100-2500
nanometers, was selected for the primary analysis because longer wavelength light is
generally more reflected than absorbed, and is less likely to be affected by color and
coatings applied to materials. Thus, by selecting a longer wavelength light source, more
light would be reflected back to a detector, carrying more information about the surface
of the sample. To begin with, three comparative analyses were done for the test fabrics in
different orientations to show that, since the test material is similarly woven fabrics, the
wavelength chosen is independent of number of material layers, material orientation;
minimally dependent on the material type; and strongly dependent upon the color
2.3.1 NIR Wavelength Spectrophotometer Equipment
The NIRSystems NIR Spectrophotometer (NSAS) is a common device used in the
textile industry to measure the dye content and molecular makeup of a material by
comparing the absorption at set wavelengths to known standards for wavelength
absorption of concentrations of chemical bonds such as OH, CH, and NH. When the
concentration of these constituent molecules is high, more light is absorbed at those
wavelengths. The results from the analysis by the NIRSystems device is reported in
absorbance units (“au”), derived from the equation:
log (intensity of reference / intensity of sample) = absorbance unit Eq. 2-3
Where the device establishes a baseline reference intensity by running a test with no
sample present, and compares the intensity of the sample to this reference for
standardization. Since light intensity does not drop linearly when absorbed by greater
numbers of constituent molecules, a logarithmic function is used to clarify the results. As
an example, if a sample absorbs 90% of the source light, and transmits 10%, the relative
absorbance is:
log (100% / 10%) = log (10) = 1au Eq. 2-4
Or, if the sample transmits only 1%:
log (100% / 1%) = log (100) = 2au Eq. 2-5
Thus, we can see a trend that as more constituent molecules are present, the higher the
absorbance unit.
Transmission through a sample is, however, unreliable due to difficulties such as
particle size difference in a sample material, suspended solids in liquids or slurries,
source lamp intensity, and gain settings on the detector. So, many spectrophotometric
systems use reflected rather than transmitted intensities, while still using the relative
absorbance. This reflected intensity does not change the nature of the functions used to
describe the results, as seen here:
log (intensity of reference / intensity of sample) = absorbance unit Eq. 2-6
Here, the device uses a white Coors ceramic calibration block to set a baseline reflective
reference intensity, and compares the reflected intensity of the sample to this reference
for standardization. Given that the data tabulated is in absorbance units, it is more
helpful to see the data in terms of reflectance. Thus, the data is converted to percent
reflectance via:
log (1 / reflectance) = absorbance ⇒
reflectance = 10^(-absorbance) Eq. 2-7
The test device is situated as seen in Figure 2-2. The incident beam is directed
is collected by photosensitive electronics at a 45° angle to the surface of the sample to minimize the measurement of specular reflection, or glare.
Scattered beams
Stepper Motor Mirror Grating Light Source
Photodetectors Incident beam
Sample
Figure 2-2 NIR Wavelength NSAS Spectrophotometer Test Device
The system includes a sample holder to standardize the sample area that is
analyzed. The sample holder holds a sample which is 7 7/8 inches long by 1 3/8 inches
wide and 1/4 inch thick. The holder is a metal frame with glass panels to contain a liquid
for analysis, or to maintain the position of a material to keep the surface flat. The holder
is loaded into a motor driven assembly and moved in a single plane such that
approximately 75% of the total area of the sample is scanned. Thirty two scans per
specimen are made and averaged together for the final measurement. To reduce error due
to scattered, reflected light in reflectivity data, a paperboard, black card is inserted behind
the material to absorb light transmitted through the material, keeping it from reflecting
off the back wall of the holder or the interior of the system behind the holder.
The device scans the sample by splitting the source light into 100 separate
wavelengths in the NIR range of 1100-2500nm, at intervals of 14nm. The light source
for the device is a high quality tungsten halogen lamp. Splitting the light into the
separate wavelengths is accomplished through a concave mirror with a finely etched
grating on the surface, which is moved through a predetermined arc. The concavity of
the mirror causes the light to be refocused as a point, and the arc of motion gives the
correct wavelength at the sampling position at maximum intensity. The motion of the
mirror is handled by a stepper motor – encoder system which is controlled by an internal
processor. The system also has an internal wavelength standard which produces sharp
absorption peaks at well known positions throughout the spectrum. Software run on the
processor locates these peaks and uses them to keep the wavelength scale constantly
calibrated and control the encoder/motor/mirror grating for exact positioning such that a
known wavelength is incident on the sample. This ensures that the reflection data
collected from the sample is at a calibrated, known wavelength.
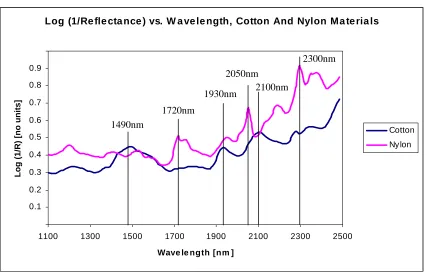
As an example of the data output by the spectrometer, see Figure 2-3, below.
This graph shows the data for cotton and nylon 6 in the form of the logarithm of one over
the reflectance versus time. This is equivalent to the absorbance of the light at distinct
wavelengths by the sample. The graph shows distinct points where the material absorbs
light due to the molecular bonds of the material. Cotton, or natural cellulose, has a
molecular formula of [C6H10O5]n, where the n indicates the repeating sequence. This
material has sharp absorption peaks at 1490, 1930, and 2100nm corresponding to the
molecular bonds that absorb at those wavelengths. Nylon, a man-made material
For nylon, the repeat of this sequence relates to the number identifying it. For example,
nylon 6 has six repeated sequences with a nitrogen-oxygen bond as the link. Nylon 6,6
has two sets of repeating six sequences to differentiate it. Looking to Figure 2-3, we can
see the absorption peaks related to the molecular bonds of this material at 1720, 2050,
and 2300nm.
1
0
Log (1/Re fle cta nce ) vs. W a ve le ngth, Cotton And Nylon Ma te ria ls
0.1 0.2 0.3 0.4 0.5 0.6 0.7 0.8 0.9
1100 1300 1500 1700 1900 2100 2300 2500 Wave le ngth [nm ]
Log (1/R) [no units]
Cotton Nylon
2100nm 2050nm 1930nm 1720nm
2300nm
1490nm
Figure 2-3 Representative Data From The NIR Spectrophotometer For
Cotton And Nylon
2.3.2 Fabric Preparation And Orientation Distinctions
To help determine the reliability of a wavelength selection based on the data
provided through spectrophotometric testing, a number of analyses of data taken by the
NSAS system was completed. These analyses mainly involved the orientation of the test
fabrics in the system. The goal behind this portion of the research was three-fold. First,
to determine if the amount of layers of the material had a bearing on the total reflectance
of the test fabrics, an analyses was done for each fabric using different number of layers.
Second, to help eliminate the possibility of data variation, and hence, final system
reliability, due to the weaving pattern, the test fabrics orientation was slightly changed
from data set to data set. Though slight physically, the weave pattern shifts were
distinctly significant. Third, to examine differences caused by varying colorations of the
warp and weft threads, the range of the test fabrics colors was evaluated and compared.
Together, this research will ensure a wavelength which is reliable for practically every
type of fabric.
The fabric rolls were again environmentally conditioned via ASTM D1776. Then
the fabrics were cut into strips 7 7/8 x 1 3/8 inches (hereafter referred to as “samples”) to
fit into the sample holder. To begin with, 40 samples were cut from each of the first three
fabrics. These were cut such that 20 samples had the warp thread on the long side and 20
samples with the weft thread on the long side. In other words, effort was taken such that
the samples were cut such that the warp threads or weft threads were basically parallel to
the long or short side of the sample.
From the forty samples cut thusly, two other comparisons also made were to
evaluate the difference between the data for 1, 2, 3, or 4 layers of fabric, which may
affect the amount of absorption since seams consist of more than one layer, and, the
difference in front and back of the sample to emphasize the variation due to coloration
In summary, the first three fabrics had data sets taken each for the following
orientations: 1, 2, 3, and 4 layers; warp thread on long side or weft thread on long side;
and, front or back toward the incident beam. Permutations of these orientations were
made such that a sample orientation may read “warp on long side, 4 layers, front toward
detector,” or “weft on long side, 2 layers, back toward detector.” Twenty such scans
were made for each orientation and an average was made for each set giving a total of
320 scans for each of the first three fabrics. After the first three fabrics were completed,
their data was compared for significant deviation between scanning a sample 20 times
and scanning the sample 10 times. Since the NSAS system scans each sample 32 times
and averages the results, the deviation was minimal and the remaining 10 fabrics had 10
samples each cut from the original fabric, in the same manner and size as described
above.
The NSAS system allows the data to be saved to a file which can be converted to
text and analyzed elsewhere (such as any PC), so a file nomenclature system was
developed as seen in Figure 2-4, below.
C:\NIRS\#fα1α2#2α where : #f : test fabric number
α1 : warp or weft on long side of sample
α2 : front or back toward detector
#2 : number of layers
α : letter designating scan number
Figure 2-4 NIR Wavelength Spectroscopy Data File Name Format
As an example, a data file might be named “3pf4t” indicating that it represents fabric
number three, with the warp thread on the long side of the sample, the front of the fabric
toward the scanner, four layers thick, and scan number twenty of the series. Another
example would be “8tb1c” indicating that it represents fabric number eight, with the weft
thread on the long side of the sample, the back of the fabric toward the scanner, one layer
thick, and scan number three of the series.
Lastly, the denim fabrics have a weave pattern that leads to what is known as
“ribbing.” These are the ridges that form a regular pattern seen on most denims and
many other fabrics due to the method and style of the weave. The ribbing can be seen in
the following figure:
RIBBING LINES
Figure 2-5 Example of Denim “Ribs” Due To Weave Style
Here, the ribbing can be seen as the pronounced lines on the surface of the fabric angled
from left to right. The airbag fabrics do not have this pronounced ribbing due to a
different style of weaving, and were thus excluded from this part of the study.
To demonstrate any variation due to the ribbing, 10 samples each were cut from
range of coloration varieties, and give variation in the ribbing orientation, either due to
weave tightness or yarn diameters. The fabrics were cut into the same 7 7/8 x 1 3/8 inch
pattern, taking great care to ensure that the ribbing was turned both parallel and
perpendicular to the long cut edge. Due to the different tightness of the weaves and
different yarn diameters of the samples, this translated to orienting the warp threads 45° –
80° off the long cut edge.
These “ribbing” samples were then placed into the NSAS system for analysis as
the other samples described above. An additional file nomenclature was developed for
these samples, as seen in Figure 2-6:
C:\NIRS\ribbing\#fα1α2 where : #f : fabric sample number
α1 : ribbing turned horizontal or vertical
(in relation to the cut edge)
α2 : front or back toward detector
Figure 2-6 NIR Wavelength Spectroscopy Data File Name Format For Ribbing
Orientations
As an example a file may have been named “1hf” for fabric number 1, ribbing turned
horizontal to the scanning path, and front turned toward the scanner. The data sets from
these samples were then compared to the initial samples where the determining factor
was the warp thread being oriented parallel or perpendicular to the long cut edge.
The final comparison of data sets for the NIR spectrophotometric data was made
for color variation across all the samples. This was done to help determine the effect of
the samples’ colors on the amount of light reflected from the surface and to aide in
determining the appropriate wavelength of light to use to minimize this effect.
2.3.3 NIR Wavelength Spectroscopy Data Analysis
To begin the analysis of the NIR spectroscopy data, the data was grouped
according to the following table:
Table 2-2 Test Fabric Grouping For Comparison Of NIR Spectroscopy Data
Comparison Made
Held Constant
Across Data Set
Fabric #1-13 Multiple layers
Warp or Weft Thread On Long Side
& Front or Back Toward Scanner
Fabric #1-13
Warp vs. Weft Thread On Long Side
& Front vs. Back Toward Scanner
Three Layers
Fabric #1, 3, 4, 5, 8
Ribbing Turned Horizontal vs. Vertical
& Front vs. Back Toward Scanner
Three Layers
Fabric #1-13 Color variations
Three Layers, Warp on Long side, and Front
2.3.3.1 Multiple Layer Comparison
Table 2-2 shows that for the initial analysis, the 13 fabrics’ data sets were
compared first for deviation caused by the number of layers, with the warp or weft thread
on the long side and front or back toward the scanner held constant. Thus, as can be seen
in the Appendix in Figure A-1, for fabric #1, there are four graphs, representing the
Reflectance vs. Wavelength of the samples for the different arrangements. These
arrangements are “Multiple Layers, Warp On Long Side, Front Toward Scanner,” and,
“Multiple Layers, Warp On Long Side, Back Toward Scanner.” Similar graphs seen are
for the “Weft On Long Side” cases. Appendix Figures A-2 through A-13 are similar
graphs for each of the test fabrics, the figure number corresponding to the fabric number.
These graphs repeatedly show that the variation in reflectance due to the number
of layers is decidedly minimal. As an example, see Figure 2-7 below, where the
reflectance data for four fabrics, #1, 5, 10, and 12, are shown. Here we see that the
number of layers has very little effect in the reflectivity across the entire NIR spectrum.
Reflectance vs. Wavelength, Fabric #1, Warp on Long Side, Front Toward Scanner, Multiple Layers
0% 10% 20% 30% 40% 50% 60% 70% 80% 90% 100%
1100 1300 1500 1700 1900 2100 2300 2500
Wavelength [nm]
Reflectance [no units]
1 Layer
2 Layers
3 Layers
4 Layers
Reflectance vs. Wavelength, Fabric #5, Warp on Long Side, Front Toward Scanner, Multiple Layers
0% 10% 20% 30% 40% 50% 60% 70% 80% 90% 100%
1100 1300 1500 1700 1900 2100 2300 2500
Wavelength [nm]
Reflectance [no units]
1 Layer
2 Layers
3 Layers
4 Layers
Reflectance vs. Wavelength, Fabric #10, Warp on Long Side, Front Toward Scanner, Multiple Layers
0% 10% 20% 30% 40% 50% 60% 70% 80% 90% 100%
1100 1300 1500 1700 1900 2100 2300 2500
Wavelength [nm]
Reflectance [no units]
1 Layer
2 Layers
3 Layers
4 Layers
Reflectance vs. Wavelength, Fabric #12, Warp on Long Side, Front Toward Scanner, Multiple Layers
0% 10% 20% 30% 40% 50% 60% 70% 80% 90% 100%
1100 1300 1500 1700 1900 2100 2300 2500
Wavelength [nm]
Reflectance [no units]
1 Layer
2 Layers
3 Layers
4 Layers
Note that for fabric #1, and also #2 which can be seen in Figure A-2, the lower
wavelengths do show some differentiation in the percent reflectance, due to the number
of layers affecting the total amount of light reflected. To aid in the reflectivity study
using the NSAS system, a stiff paperboard card is inserted behind the material. The card
is black to absorb light that transmits through the material, reducing reflections from the
back of the carrier device and from the interior of the system behind the carrier, as the
carrier is a double paned-glass holder. This affects the amount of light reflected as shown
in the graphs as more light is reflected back to the detectors as more layers are added.
With one layer, much of the light that transmits through the first layer, through holes in
the material and through the yarns themselves, is absorbed by the black absorbing
background. Adding another layer causes some of this primary transmitted light to be
reflected back through the first layer off of the second layer. These two reflected light
wave sets interfere with one another, mainly constructively, to produce a higher reflective
value. However, as in the first layer, a portion of the light is also transmitted through the
second layer and absorbed by the black background. Additional layers repeat this
process. As the wavelength of light increases, the reflectivity data for multiple layers
tends to come together more. This is due to the wavelength of light being more evenly
absorbed/reflected/transmitted in the material and off of the black background for any
number of layers.
However, this is not the case for the remainder of fabrics, leading to the
conclusion that this condition is mainly in relation to the color of the samples. Fabrics #1
and 2 are both light colored fabrics (white on white and tan on tan), and the remainder of
the fabrics are of a darker nature. The darker color fabrics absorb more of the light near
the visible end of the spectrum represented, allowing less light through to be absorbed by
the background, except when more layers are added. For any number of layers, it can be
seen that the amount of light reflected back from the darker fabrics is nearly the same
throughout the NIR spectrum.
This confirms the supposition that the effect of layers on the reflectance is
minimal. The remainder of the data analysis is then streamlined such that only three
layers of samples are placed in the holder at any one time. Three layers is chosen mainly
due to the size of the NSAS system sample holder. As described above, the sample
holder is approximately 7 7/8 inches long by 1 3/8 inches wide and 1/4 inch thick. The
interior of the chamber requires some thickness (~1/8 inch) of material to hold the sample
in place with out allowing the surface to undulate. Three layers was determined to be the
optimal number for the fabrics used in this research.
2.3.3.2 Warp Thread vs. Weft Thread On Long Side Comparison
The second analysis was again across all 13 test fabrics’ data sets, this time
comparing the warp and weft thread orientation as well as front vs. back of the samples.
Figure 2-8, below, shows the data for four of the fabrics, #2, 6, 9, and 13. Additionally, in
the Appendix, Figures A-14 through -17 show graphs of sample arrangements of “Warp
vs. Weft on Long Side, Front vs. Back,” for each test fabric with three layers used. Both
warp and weft on the long side and front and back toward the scanner are shown on these
Reflectance vs. Wavelength, Fabric #2, Three Layers Warp vs. Weft on Long Side, Front vs. Back
0% 10% 20% 30% 40% 50% 60% 70% 80% 90% 100%
1100 1300 1500 1700 1900 2100 2300 2500
Wavelength [nm]
Reflectance [no units]
Warp Front
Warp Back
Weft Front
Weft Back
Reflectance vs. Wavelength, Fabric #6, Three Layers Warp vs. Weft on Long Side, Front vs. Back
0% 10% 20% 30% 40% 50% 60% 70% 80% 90% 100%
1100 1300 1500 1700 1900 2100 2300 2500
Wavelength [nm]
Reflectance [no units]
Warp Front
Warp Back
Weft Front
Weft Back
Reflectance vs. Wavelength, Fabric #9, Three Layers Warp vs. Weft on Long Side, Front vs. Back
0% 10% 20% 30% 40% 50% 60% 70% 80% 90% 100%
1100 1300 1500 1700 1900 2100 2300 2500
Wavelength [nm]
Reflectance [no units]
Warp Front
Warp Back
Weft Front
Weft Back
Reflectance vs. Wavelength, Fabric #13, Three Layers Warp vs. Weft on Long Side, & Front vs. Back
0% 10% 20% 30% 40% 50% 60% 70% 80% 90% 100%
1100 1300 1500 1700 1900 2100 2300 2500
Wavelength [nm]
Reflectance [no units]
Warp Front
Warp Back
Weft Front
Weft Back
Figure 2-8 Comparison Of Warp vs. Weft On Long Side And Front vs. Back For Fabrics #2, 6, 9, And 13, Three Layers
Fabrics #1, 2, and 11-13 show almost no deviation between warp and weft
orientation and front or back orientation. The other samples show relatively little
difference between warp and weft orientation, but marked difference between the front
and back of the samples. This is due to the color variations between the warp and weft
threads rather than any orientation causes. Note that test fabrics #1, 2, and 11-13 have
warp and weft threads of the same color; white or tan. The remainder of the test fabrics
have slightly different colors to completely different colors, such as fabric #3 (beige on
white) and #9 (black on white). Thus, the data lines for #1, 2, and 11-13 are very close
together, whereas the remainder of the test fabrics show the front and back data lines
slightly to greatly separated, but their respective warp and weft orientation data lines
close together.
There are two conclusions one can draw from this analysis. First, the orientation
of the warp and weft thread has no bearing on the reflectance at these wavelengths. On
the scale of the wavelength of light used, 1100-2500 nm, the fabric surface appears
relatively flat, and yet rough due to it’s makeup. The size of the threads that make up the
fabrics, ~0.1 to 1.0 mm in diameter, leads to the conclusion that there is a scattered
reflection of the light at the surface of the fabric. With diffuse scattering, the light
impinging on the surface is randomly reflected off such that no constructive/destructive
interference patterns are set up leading to a pattern in the reflected light, as shown in
Figure 2-9, below.
Second, the reflectance level based on the orientation of front or back of a fabric
is highly dependant upon the color of the threads which constitute the fabric, but
color of the sample is the greatest contributor to difference in percent of light reflected
from the surface of the fabric.
Reflected Light Rays (No Pattern) Incoming Light Rays
Fabric Surface
Figure 2-9 Diffuse Scattering From Fabric Surface
2.3.3.3 Ribbing Turned Horizontal vs. Vertical Comparison
The third comparative analysis that was done with the NIR spectrophotometric
data is the ribbing orientation. As stated above, the ribbing on the material is caused by
the method of weaving and the size of the yarns that make up the fabric, as shown above
in Figure 2-5. To cover the range of materials’ properties and colorations, fabrics 1, 3, 4,
5, and 8 were chosen. Also, as above, the nylon materials are not studied here since their
weave patterns do not lead to ribbing structures on the surface. The graphs for fabrics #1,
3, 4, and 5 can be seen in Figure 2-10, below. The graphed data for fabric #8 for these
orientations can be seen in the Appendix, Figure A-18. For completeness, the analysis
included the orientation of front and back of the sample, as the ribbing is evident from
both sides of the fabric. Thus, the graphs are of the arrangements “Horizontal vs.
Vertical Ribbing, Front vs. Back” for the 5 selected test fabrics, each with three layers as
above.
As with the warp vs. weft and front vs. back orientations of the prior comparisons,
the data shows that the reflectance for the horizontal and vertical ribbings are nearly
identical, while there is a distinct variation between front and back data sets. The first
part goes back to the geometric optics argument above that the fabrics diffusely reflects
the light striking upon its surface. The second part again shows that the color difference
Reflectance vs. Wavelength, Fabric #1, Three Layers, Horizontal vs. Vertical Ribbing, Front vs. Back
0% 10% 20% 30% 40% 50% 60% 70% 80% 90% 100%
1100 1300 1500 1700 1900 2100 2300 2500
Wavelength [nm]
Reflectance [no units]
Horizontal Front
Vertical Front
Horizontal Back
Vertical Back
Reflectance vs. Wavelength, Fabric #3, Three Layers, Horizontal vs. Vertical Ribbing, Front vs. Back
0% 10% 20% 30% 40% 50% 60% 70% 80% 90% 100%
1100 1300 1500 1700 1900 2100 2300 2500
Wavelength [nm]
Reflectance [no units]
Horizontal Front
Vertical Front
Horizontal Back
Vertical Back
Reflectance vs. Wavelength, Fabric #4, Three Layers, Horizontal vs. Vertical Ribbing, Front vs. Back
0% 10% 20% 30% 40% 50% 60% 70% 80% 90% 100%
1100 1300 1500 1700 1900 2100 2300 2500
Wavelength [nm]
Reflectance [no units]
Horizontal Front
Vertical Front
Horizontal Back
Vertical Back
Reflectance vs. Wavelength, Fabric #5, Three Layers, Horizontal vs. Vertical Ribbing, Front vs. Back
0% 10% 20% 30% 40% 50% 60% 70% 80% 90% 100%
1100 1300 1500 1700 1900 2100 2300 2500
Wavelength [nm]
Reflectance [no units]
Horizontal Front
Vertical Front
Horizontal Back
Vertical Back
Figure 2-10 Comparison Of Horizontal vs. Vertical Ribbing And Front vs. Back For Fabrics #1, 3, 4, 5, Three Layers
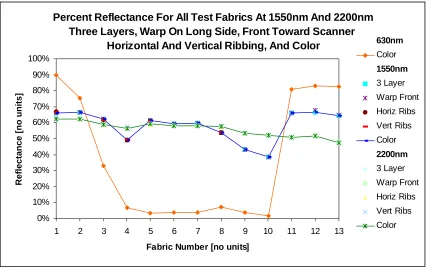
2.3.3.4 Color Comparison Across All Test Fabrics
The final analysis of the NIR spectrophotometric data was a comparison across all
the test fabrics to evaluate optimal wavelength ranges to use for any color of fabric. The
graph for this analysis can be seen in Figure 2-11, below. For this comparison, the data
sets of “three layer, warp on long side, front toward scanner” for all 13 test fabrics were
used.
Reflectance vs. Wavelength, All Test Fabrics, NIR Spectrum
0% 10% 20% 30% 40% 50% 60% 70% 80% 90% 100%
1100 1300 1500 1700 1900 2100 2300 2500
Wavelength [nm]
Reflectance [no units]
Fabric #1 Fabric #2 Fabric #3 Fabric #4 Fabric #5 Fabric #6 Fabric #7 Fabric #8 Fabric #9 Fabric #10
Fabric #11 Fabric #12 Fabric #13
2200nm 1550nm
Figure 2-11 Color Comparison For Fabrics #1-13, Near Infrared Spectrum,
1100-2500nm
Calculating the difference between the highest and lowest reflectance data
revealed several things. First, the largest spread of reflectance percentages, 51.2%
![Figure 1-1 Image Of A Skipped Stitch [36]](https://thumb-us.123doks.com/thumbv2/123dok_us/1625333.1202282/16.612.207.477.393.652/figure-image-of-a-skipped-stitch.webp)