Outcome Survey
By
Denis Gray
Department of Psychology
Center for Communications and Signal Processing North Carolina State University
Submitted to
Division of Industrial Science and Technological Innovation National Science Foundation
August 1984
Paq~ Ba cK.gr0undo. • • • 0 • • • • • • • • 0 0 0 0 Q • 0 • • e0 I) • • • • 0 0 • " 0 .. • 0 .. • • • 0 • • 0 0 " 1
r
nt r odu ct ion. .. .. . . . 0 • • • • • 0 0 .. .. • .. " .. • • .. • .. .. " " • 0 • . . co • • .. .. e .. 0 . . 0 0 • " . . 1Exe cut i ve Summary 0 0 • • 0 Gl 0 • 0 ~ • • 0 0 2
Industrial S;Jonsor Questionnaire ... 0 • • • e . . . 10 .. 0 0 " " " • e 0 . . . 0 • D . 4
Student Questionnair~o.. o o . D . e o o o o . o o o o o o o . D . " o o D o . o o . o • • •14 Industrial Sponsor-Faculty Comparisons"oo .. o o o o • • • • • • " • • • •15 Conclusions .. 0 .. " . . . " • • 0 e 0 0 0 . . . . O D D " 0 D 0 0 0 0 0 1 0 0 • D . . . e • • & D .. D . . . " II> 015
A.ooend ix: 0 • • • D • • • 0 0 " 0 " 0 D " .. 0 0 II e 17
-- Executive Summary Figures (Fiqs. 1 - 3)0 . • . . . 0 0 • • • • • •17
Industrial Sponso~ Tables (Tables 1~24) 20
Facultv Tables <Tables 25-29).0 30
Student Tables (Tables 30-31) 0 • • • • • • • • • •32
BACK(;RO(JND
This report sumrnari.~es the ~~sults of a survey ~onducted
d'lring· the fall of 1983 of tacu Ity , students~ and industrial
representatives participating in the Center fo~ Communications
and Signal ?rocessing at North Carollna State Universitv (CCS~)~
Nine industrial board members, 12 facultv and 18 -students returned the questionnaires which were mailed~to them. CCSP had
been in operatian one year when this information was obtained. Current plans call for this survev to be administe~ed annuallv for at least 5 years. It is hoped· that the information p~ovid~~
in this and i.n subsequent reports f,.J1.11 prr:."ri.<i.e usef'ul f e edbac k to
Cent~r staff and when combined with data f~orn other National
Science Foundation funded cente~5, help illuminate the ~r0cesses
~t ~ooperat1ve research. funds to ~onduct this asseS5m~nt wer~
orlJv1.,j.ed bv th~ Nati ona I SC'lerlC(~ F()Llnuat.ion:~ Oi"J"ision of Indust>
~.. tal 5cienc:e and 'I'echnoLoo t ca 1 Innova r ionr and wit:1'\ a. f~w l?x~ept
tons the que s t ionnair~ used in th.is assessmerrt is a stanrta r-i
tnst r-..iment us ed to co I l ect outcome data at all NSF sponsored
,industry-university coope~ative research c~nters. ~
This ~eport has been orcranized into 6 major sections: Executive SummarYr Industrial Sponsor guestionnaire¥ faculty
~11e5ti onnai r e , Sttldent Quest.ionnaire, Lndust rtaI Sponsor-F'acttl ty Compa rLaons . and Conclusions. 'I'he ExecutiLve Stlmmary pr ov'ide s a.
schematic summary of major findinqs contained in the other sect. ions of the r eport and several figtlres w.hich graphically portray responses across respondent groups. The Industrial
Spon-sor, faculty and Student Questionnaire sections detail th~ responses of the respective respondent groups to questions inc 1 uded on thetr que s c ionnai r e . The Indust r ia 1 Sponsor-fac111ty
Comparison section compares and contrasts faculty and ind\Jstrial
sponsor responses on items which were ~ommon to both their
auestionnaires. Finally, the Conclusions section provides a
;llmmary and conclusions based on these findings. In geru~ralr the
information p~ovided in this report constitutes a snapshot of
CCSP one vea~ after it began operation as a center and as such
~eems bes~ suited to describe CCSP rather than evaluate CCSP's
suc ce s s . Witrl t:his r-eport as a baseline, t ut ur e assessments should pr ove more u sefu l for evaL u at tve c u rp ose s ,
EXECUT
rvs
STJM1"tl\Ry
i r If\IT:,TJ~'rpT.?.L 8t='()~lS()P F·Il\TDIN(}S
~ri~r Contact
wt1:h-CCSp-p'erSOnnel
~RELATlv~LY--LOW P~TE-OF CONTAC~: ~rior to e5tablishin~ CCSP.
board. membe r s ( 8Ms) reported low f r equericy cf contact with
faCtl1ty: a m1.nority of companies had formal relationships with
t acui tyo
Board M~mb@r lnvolvpment with CCSp:
·'''~R·I~TL1. -l)HG~~rIZ LNG "MEEl.'INGS-t\l\ID-I?LANNI~IG
"'"REC~'RUI'rING N~-:W MEMBERS: 2 companies C'osr~ ~f ~art:ic..t.pM~iQ.n.l.
Av~AGE MISCELLANEOUS COSTS: 16K (trav~l staff time. etco)
TOTAL COST (average): 66K (avera~~)
Orrranizattnnal r~inkaap ".Jith CCSP
*~GfNEER!N(;---AND"'-TECHNIt:..~
GRofjp:
~eq'-11ar or occasional conr.ac eby all but one company
*OrVISIONAL
aNDCENrRAL R&D:
~eqular or occasional contactby
7and 5 companies~ ~~spectiv~ly
rNFOR~~TION REQ(~~STS: average 9 per company (90% t~chnical)
CCSP Goals:
*QVERWHELMING MAJORITY OF BMS BELIEVE GOALS REALISTIC
*MOST IMPORTANT GOALS: general knowl~dqe expansion~ development
of new ~esearch projects in your firm
*LEAST IMPORTANT GOALS: development of commercial products and
patentable products
Lik.elv Ben~fits
*MOST-LIKELy--aENEFIT:
better recruitment*LEAST LIKELY BENEFIT: patentable
productsEft"e~ts of Particioatton on Res~arch in Their Firm
"SOME CHANGE:'· research top
iCSaria-{ss,je SO
in··labs-*A LITTLE CHANGE: ~esearch method and procedures
~NEW RESEARCH PR().JECTS: 250K in ne'N projects· and 280K in out si de
t:ontracts
f)the r
f.:f
f e~i;.li .(')t .~art:i.~iEg.
t i.!lQ. .Q.D ~Q.mPstDYkDEFINI'rE Et~~CT: imp~ov~d ability to coop~rate with outside scientists
"'P')SSIBLE EFrEC'r: improved pr oduct and pr0f7~S5 d,=siqnIf improved
processes and m~thods of p~oduction
*CCSP STUDENT IWrERVIEWS:
24: HIRES:3
*INDUSTRY SCIENTISTS ON-SITE:
~*rJNI~lERSITY SCIENTISTS OFF-SI1.~: 9 Sati~.t"a~tion:
~HIGH GENERAL SATISPACTION: 78% considerably O~ completely
5a tist·i ed.
~ESPECIALLY SATISFIED: manaqemenc; ~~sponsivene5s: digital
signal processing
*ESPECIALLY OISSA'rISFIED: facili.ties need imot"ov~m~nt; abi l i t v
to attract quality graduate stUdents and additional faculty ~o
potJer area
Lik~lihood ~f Membe~shic Ren~wel
II. FACTJLrry F'EE;DB~.l~K
D~ci si.oJ'J. Maki.nq [nf Luenc e 9.f. P_1f1."p=-r~rt.. ~~O~Eg
*f:ON'I'Il'IGDrrr - ·C'.N -
-oEeTs
ION
A.REA: Fa cultv be lieve they exert most influence on decisions affectina the ~~ond'uct or-. t h ·-' elr- rese(\~chwhile the Director and boa~ct m~mbers exert most influen~e over
admini5trativ~ ~atters; most other a~eas reflect shared decision
makincr. (See fiq. 1)
CCSP R~search
-*WAVS' CCSP- IS' [iII--'F'ERENT rrHAN OTHER
u.
RESEARc::H*Diffe~ent: How Evaluated
*Somewhat different: Research Topics
~Slightly different: Research Methods
COl'lrrRIBfJTION TO T'ENTJRE: contributes a moderate amount.
Univ~rsitv Benefits
*LIKELY: improved knowledge base, better student ~ecruitmentr
better student placement
*UNLIKELY: increased universitv patent activttv, increased fund
for r e s ea r cb from publt c sour ce s ..
Effects .o( P~~i;j.ripat.inq0D. ~9J1-Y (flc:1.Cl.I~t.V ~erc:ept:ion)
hDEFINlTE EFFECT: improved ability to coope r ate ~Nith out si d.e
~cienti.~t.s
*PC,SSIBLE EF~F'l:::C~l'~ fmproved product and process desi.gn ~~ prod.l.Jct~ anc s e r'vtces
CC~~? ft.lndilJg c.(j~p_,:g~d to .0t.'p-e~ fttnc\j.JJ9: *COfv!~AHES l-'AVORABLY':
~A.dvice trom co Ll e acrue s
*Likelihood of tlmdinq lonq-term ~esearch
*Amount of funds funding
-~(:OMPt\.RES r]i\JFAVORABLY:
~Amount of paperwork
~Autonomy in deciding on research
III. INDUSTRY VE~RSTJS ~ACULTY VERSTJS DIRECTOR COMPARISONS
Center Goals~ (see Fia. 2)
*AREAS
OF-oAGREEMEWf:"
fN'it-h'-only minor exceptions tndust rv . f a cu l>ty and director:s highest rated goals and lowest rated goals tor
CCSP are almost identical
~AREAS OF DISA..C;REEMENT: 1 ) Center Director sees I Ienhancement; of
c raduat e s t.ud ent technical t rai nfnc " as somewhat. more impor-tant than inctustry and faculty; 2) f e cu lty see Ilredir~ction
of un ive r s itv research toward tndust rta l probLemsII as less imoortant than industry and Center Director
Areas of Satisfaction: (see Ficr.
11
*AREAS-OF AGREEMENT: in relative and absolute terms all parties appear to express about the same level of satisfaction across all areas
IV. STUDENT FINDINGS
Satisfaction wit~ k~~e
*H [(;H SATISFAC'rrON: student s Lnd teate a. high leve 1 of sati sf ac-rion with their CCSP research experience
"-:MOUES'L' SATISF.A(:TION: st.udent 5 Le s5 sati sf ied with CCSP ,3.5
3-vehicle for obtaining experienc~ in industrial sites
I~JDrJsrrRIAL SFJUNSOk QUES'fIONNAIRE
['escri.otiv~ Informat~on
80arn Membe~ Table 1 displays the descriptive informati~n
obtained about the individuals who are ~epresent1ng their com?any
as a boarct member (BM) of CCSP. including their work experi~nce,
~ducational levels and prior CCSP involvement.
The typical BM ~epo~ted being with his company approximat~ly
i8 years (Table 1, Ql), with 12 years spent 1.n "esearch and
dev~lopment (02). These fi~res reflect long-term tenure with
sponso~inq companies, since- respondents indicated bein~ in
industry an average of 24 years <Q3) and research and development
~n average of 19 yea~s <Q4l o In addition, one-thi~d of all
industry participants have advanced degrees (12~S% M.A.'s! 2500% Ph0 D'S) (Q8), with 25% of all respondents having taken·3. cours e
or re~eived a d~gree from North Carolina State University (Q9)o
~s one ~ould expect, board members occupy positions of
~esponsibility in their respective companies~ The average number
of organizational levels bet~een the industry participants and
the chief e~ec~ltiTle officer is 4 ('fable 1" Q6)" with apP~Qximate LV ~ peopLe reporting dir~ctly to the participant <Q7). A wide
range of ~Talues were r~ported tor the number of people ~epor~inq
inairectly. with 11.5 being the meaian <Q7a).
Interestingly, board membe~s (EMs) report very little
contact ~ith pe~sonnel affiliated with CCSP Erio~ to its e st ab l a shmenc . Specificallyp only two individuals ('rable 1, Qli)
repcrted frequent contact (several times per month or more) r
while the remaining BMs report that they rarely or never had
contact (44.4%) or that contact was limited to several times o~r
ye~r (33.3%). EMs do indicate some invalvement in activities W'hich l~d up to the e stab Lf shnerrt of C(~SP ((212) primert iv invol~Ting the organl~inq of m~etings (4404%) and planning
(33.3%). However, only one 8M (11.1%) reported involvement in
recruiting- ne~N companies and no one r epo r t ed "proposal writing"
or IIbuilding university support. II
With two exceptions, this level of involvement is unchanqed
with respect to current CCSP activities. One additional 8M (or 2
8Ms) reports assisting in the recruitment of ne~ members and one 8M ~eports providing assistance in bUilding support within the
university. Given these findings it is nat surprising that most 8Ms indicate that their top management have only some <55.6%) or
no (33.3%) involvement in CCSP (Q17).
SconS9~ Organ~z~tiqD§~ Table 2 display~ descriptive information
r e sponctents p~O~lid.ed about; member compante s . In (J"eneral, 8~{s
contact with CCSP perz0nnel (Table 2, QI0) _ Only three companies
~epcrted previously using Center faculty as consultantsr and two
companies used faculty in contract research, while one member
each reported bcinq previously involved in general faculty
3Up-port or student/faculty exchange programs with CCSP faculty.
Not surprisingly, the process of joining CCSP involved a number of actions within a given company_ Based on information supplied by BMs~ the decision to join CCSP involved concurrence
by several individuals at their level and approval from several other levels within their organization. Specificallyr
~pproximately 3 inctjviduals at the same level as the 8M had to
concur and two orqanizational levels had to give approval betore
a membe~ship commitment was confirmed. While the official cost
at membe rahi p 1.S ';OK per yea r r participation in CCSP t nvolve s
additional c03tS in the torm of travel costs, staff time, etc. EMs estimate that on the average these costs amount to lb.1K rer
year "Q13) . Thus" the tot.al cost of pa r t Lc t oat tncr in CCSP f'Jr.· a
memb~r company (membership fee + rel~ted co~tS) ~otals on the
aVi::raqe b6K.
As might be expected, the functional group in member com~anies most likely to work with the Center on a reqular basis
is the engineering/technical staff (Table 3, Q14). Five BMs indicate th~t the engineering/technical ~roup have regular con-tact with CCSP and three indicate occasional contact by this
group. The functional areas least likely to work directly with the Center are the marketing, production and corporate planninq
staffs. Contact by the central and divisional ~esearch and development staffs was reported as being either occasion~l or
regular by roughly half of the member companies. Board members
also report an average of 8.6 people requesting information
(during cesP's first year of operation) concernin~ specific
activities or projects of the Center. The majority of those ~eq'lests (80.6%) w~re technical in nature.
~nd L;' ke1i. hoort
(:cs~ Goal~.~ Rea_~~iZRt iol'}
To a large extent ratings of the relative importance of various CCSP goals reflects a given constituency's p~ioritics. The folloWing section details the ratings of CCSP goals by
indus-trial board members along a number of dimensions.
With respect to the realism of qoals" the overwhelmincr
majority of BMs (89.9%) believe that CCSP has established realistic goals and objectives. None of the r~spondents
contradict this assessment, although one 8M qualified his
assessment by indicating- that CCSP goals lima:' bell r ea Lt st tc .
~pp~ar~d to stress the ,importance of general kno~ledge
improvement, stimulation of new research in firms and the
foste~inq of industriallv relevant research and trainincr over
er cduct and patent development (Table 5). F'o~ instance" "qenera1
~xpansion of knowledge in this technical areaII received the
highest averaae importance ratin~ (3.8 on a scale of 4)D _ The
next highest imoortance ~atinqs were given to "development OI new
r-esea rcb project s in your firmIII ( '3 •1 ), and 10redirect ion of university research toward industrial problems" (3.1>, followed
by "enhancement of graduate und~rstanding of industry" (2.9) and
IIenhancement of eraduabe student technical training" ( :'. . 8 ) ,
"enhancement of quality industrial research" (2.7), "development of commer-cial products in your firm' o (2.4), and "development of
patentable products" (1.9). Clearly, most BMs seem to ~ant CCSP
scientists to do research~ not development, but they want that
~esearch to be more relevant to industrial needs.
Interestingly, ~hen asked about the likelihood of realizinq
benefits from CCSP (Table 6>" "better recruitment" was rated the
benefit companies were most likely to deri~e <303 on a scale of
4)0 Seven BMs (770 8 % ) indicated that they thought bett~~
recruitment ~as either almost ce~tain or pretty likely to be
realized from their participation in CCSP. "Improved research in
their company" (2.8) was rated next most likely benefit from
participation. 'rangible benefits in the form of commercialized
products (2e2) and patentable products (109) ~ere perceived as
l~ss likelyo Thus~ although better recruitment is indicated as
the most likely benefit of participation in CCSP, relatively
speaking BMs appear to believe that improved research projects in
their company~ one of the goals they ~ate as most important, is
pretty likely to be realized from their participation in CCSPft
Pe~ived Eff~ct of ~articipation
iQ
CCS~Board members were also asked to indicate if participation
in CCSP had any effect on their R&D projects and on their
company. Not surprisingly, given the brief tentlre ot CCSP ~hen
this survev was conducted, no 8Ms indicated CCSP r~s~arch had
caused "a ·lot" of change in their R&D projects. Howev~rr a
majority felt that it had caused at least Ita little"
change on their research topics and issues (Table 7). Thre'e 8Ms
<3705%) also indicated CCSP research had caused at least "a
little" change in their ~esearch methods and procedures while two felt that it had caused at least "a little" change in the
crite-~ia and methods used to evaluate research productso Thus, there
is some indication that CCSP ~esearch was beginnin~ co impact,
although sl~ghtly, R&D in some companies.
A l~ss subjective assessment of CCSP effect involves the
extent to which companies have initiated ne~ research projects
and contracts because of CCSP activities. Two EMs ~eported the
initiation of 2 research pr-ojects in their company which were
stimulated by CCSP act Lvt t Le s . These projects were initi\3.t:~d
equivalent staff, resp~ctivcly (Table 8). In addition, three
companies reported having initiated outside research contracts
with faculty or anothe~ laboratory because of CCSP activities. The average contract beina for an estimated 95K (Table 9). All
such contracts totalled a~ estimated 286K.
Despite indications that CCSP activities have bequn to have
some influence on the research beincr conducted· by member companies, it would seem unlikely that products and processes
would be influenced after one brief year. Thus, it is not surprising that most BMs do not report seeing product and process
effects of CCSP partici~ation in their company. On the other hand, at least_one 8M indicated there might have been an effect in every area mentioned in this question. The greatest effect of CCSP reported. by BMs was in their abi1i ty to coope r at e wi.th
outside scientists. Five BMs o~ 71% indicated participation in CCSP had had an effect in this are~. Surprisingly, 4 BMs (80%) indicated that they may have realized irnprnved product and
process desi~n via participation. One 8M r~ported improvements
in processes~andmethods of production (1~.6%) and anoth~r felt
CCSP miaht have had an effect in this area (16.6%). Althouah RMs failed to report an effect in other areas, two EMs indicated CCSP participation might have (:'rnaybe") had an effect on Lmpr ovemerrt s
in products and services, new product development, ~eduction in cost of production and capability to deal with go,rernment regulations. One BM used the IImaybeII response concerning effect on lI~hanges in warranty and complaints in view of improvements in products," and "changes in cost of product.s to users and
increased uniformity of products. 1I
Given the decidedly research
rather than development goals most BMs seem to hold for CCSP
these effects although modest seem significant.
A final possible area of CCSP impact relates to personnel, that is, student recruitment and exchange of scientific personnel. Once again the reported effect in this area is modest although quite evident. Six of the nine companies participating in the Center indicated having interviewed students trained in
Center research projects. A total of twenty-two students W~~~
interviewed by four companies with one company hiring three of
them (Table 11). In addition, two of the companies have had
their scientists working on-site at CCSPr while four companies
have universitv scientists working on-site in their company
Satisfaction with CCS~
Althoucrh cesP's successs can be describ~d by analyzinq its
impact on various areas, to a large extent, the BM's sub;ective
assessment of satisfaction with CCSP may be the most important
indicator ot it3 relative successo
Based on a global rating of satisfaction. the vast majority
of EMs seem qUite satisfied with the operations and activities of
CCSP (Table 14). All EMs indicated some satisfaction with CCSP
activities. In tact, over two-thirds (77.8%) of the companies
~articipating jn the Center reported being considerably or
completely satisfied ~ith the Qv~rall operations and activities
of the Centero
BMs also listed their satisfaction ~ith specific featur~s of
CCSP (Table 15). In general, EMs ~eported the highest degree of
satisfaction with administrative and communication aspects of
CCSP. Specifically, eight EMs (8809%) repo~ted complete (2 EMs)
or a qreat ~eal(6 EMs) of satisfaction ~ith Center administrative
practices. while 770 7 % and 66.6% reported at least a qre~t deal
of satisfaction with communications between CCSP staff and their
company and responsiveness of CCSP staff to industry needs,
respectively. Relatively speaking, degree of satisfaction with
the technical quality ot research was not as high. Five or 55%
of all BMs indicated complete or a great deal ot satisfaction
with the technical quality of research with the other EMs (4)
indicating IIsome't satisfaction with this feature of the Center0
Since many of CCSP's research pro;ects were undergoing fine
tuning based on industry input during this period, this
evalua-tion seems understandable~ Interestingly, when asked to evaluate
the overall research program of CCSP_compared to similar research
proarams in othe~ Uo SD univ~rsities, most EMs were auite
comcli-mentary. Three EMs rated it in the top 10%, 4 ~ated it as above
average. and one as below average (Table 16).
BMs were also provided an o~portunity to list the operations
and r~~ult5 with which they ~ere espe~ially satisfied or
dissatisfied. Comments hicrhliqhtinq features thev were
espectaLly sat tsfted with inclllc1ed.:'· It professional
management. many first year pr-oblems r'~solv'!d,." It
r e sponsi vene s s i " I I .
o.
responsive to criticisms," IIdiqital si.c-nal processing and networking wo~k," I I . Administration of
Center, .. IIresponsiveness r II IIsupport of uni versi ty,I I '·workinq relationship of board members," and "too soon to tello" Com':
mments highlighting features they we~e especially dissatisfied
with included: . facilities need to be tmer ovedv " II • • •
cohe s ; verie s s of p~oqram,II I I . • • inabi1i t7 to r ec ruat quali ty
graduate stuaents. . . failure to get participation of a faculty
member who could aide a specific project," "difficUlty in tying
independent research of graduate students toqether into a
cohe-sive project, .. and II • • • disappointed in the·lack: of involv,:ment
of faculty and students with direct technical and professional
inte~~sts r",:l.ated to business of our company." 'mlile"most of the
dissatisfaction appears to be a belief by two BMs that there were not as many faculty or graduate students interested and involved in research related to their business.
The most tanqible way for a 8M to express his satisfaction Qr dissatisfaction with CCSP will be when thev are asked to r~new
their membership. The vast majo~ity of BMs described their renewal as 1I1ikely.1I Specifically, 7 BMs (77.8%) indicated they
were likely to renew and 2 labeled membership renewal as
"uncer-tain" (Table 17). None of the BMs labeled their company's
renew-al as "unlikely." When asked to describe changes or improvements which would have to be made before renewal could be confirmed, two BMs indicated specific projects would have to be made more relevant to their company's research needs. Since this
FACULTY QUESTIONNAIRE
Oescriptiv~ Information
A total ot 12 Center taculty members participated in the
survey. Table 18 displays the descriptive information collected.
Excludinq the Center Director, the typical Center faculty member
holds the rank of associate professor and is not tenuredD Half
of the Center staff r~port being involved in a single proj~ctr
while the remainder report involvement in t~o or more projects.
The averaqe percentage of time allocated to projects is 35%.
Prio~ Contact Wi
tll
Tndt.1stryTables 19 and 20 provide information about faculty contact
with industry in general and ~ith member companies in particular
prior to CCSP. Prior to CCSP, most faculty contacts with
industry were through the consultant cole <Table 19). FaC111ty
~eported the next most common means of contact with industry ~~re
via contract ~esearchp faculty exchange and via supervision of
student exchange. With respect to frequency of contact with
member companies prior to CCSP, faculty report some, althouqh
~ather infrequent, contact with about half of the companies
(Table 20)0 However, none of the faculty reported contact with
five companies~
CP&L,
Exxon,GTE
pWestern
Union and Roc~ell.The highest rate of contact was reported with IBM and Digital.
Perceived Level of Influence QD CCS~ Decision
The operation of a complex organization like CCSP is subject
to influence by a number of groups or forc~s including the
Indus-trial Adviso~y Board, the Center Director, faculty, students,
unive~sity administrationr and university procedures. Table 21
(13.150 Fig. 1) describes the facl.tlty's rating of their tnrl uenc e
and the influence of these various qroup5_ pe~sons and procedures
on decision areas affectina CCS~. Based on mean influence
rat-ings <4
=
almost complete c6ntrol, 3=
a lot of influence, 2=
some influence, 1 : no influence) r faculty f~lt that the Cent~r
Director exercised the greatest influence on ~lanntng and
strategy (3.1) although they felt that faculty (2.8) and the
Industrial Advisory Board (2.6) also exercised a lot of influence
in this area. University administration (1.7), procedur~s (1.4)
and students (1.2) exerted much less influence. In the domain of
o~oiect selection faculty indicated that they (3.1) and the
I:enter Di~ecto~ (300) exerted the most and rouahlv the same
degree of influence with the Industrial Advisory Board (2.4)
exercising some~hat less. Students (1.4) had some influence in
this area while other sources exerted minimal influence. In the
conduct of research faculty clearly see themselves as havinq the
greatest influence (3.5) followed by their students (2.7), ~ the
Center Director (2.0) and the Industrial AdVisory Board. In the
(2.8) and the Industrial Advisory Board (2.9) as having the
greatest influence, with slightly less exercised by the Center
Dire~tor (2.6). Of the other groups, only students (2.0) have a
mean~ngful level of influence in this area. Interestingly~
faculty ascribe almost complete control to the Director (3.8) on
matters of budqet and logistics. They suggest that they (2.3)
and the Industrial Advisory Board (1.9) along with procedures
~1.9) and university administration (1.6) exercise only some
1nfluence here. Finally, they see the Director (2.9) as havinq
the greatest influence on appointments of faculty/staff, although
procedures (2.5), university administration (2.2), themselves
(2.1) and the Industrial Advisory Board also exercise influence
in this area. In summary, it appears that in heavily
administra-tive decision making areas (budget and appointments) the Center
Director exerts the greatest influence, while in other areas
including planning, project selection and evaluation of projects,
there is considerable sharing of influence by the Director,
faculty and board. Finally, in the conduct of research faculty
and students seem to remain pretty much the masters of their own
fate. On the whole., this breakdown appears to approximate the
collective model one would expect or at least hope to find in a
cooperative research center.
PerceptioQ of CCSP ~esearch
anq
~ts Contribution to TenureOther faculty perceptions of CCSP activities and outcomes
are also important to understanding faculty reactions to and
involvement in CCSP. In this vein, faculty were asked to rate
the degree to which research conducted under CCSP is different
from research typically conducted by them (Table 22). The
greatest difference faculty perceive in CCSP research is in the
"criteria and method used to evaluate research projects. II The
vast majority of faculty believe that there is lIa lot .. (33.3%) or IIsome" (50%) difference in this area. This may reflect the major
role faculty have previously indicated their Director and the
board have in this domain. Similarly faculty see IIsomeII (50%) or lIa lot" (25%) of difference in research topics and issues of
CCSP, probably due to the Industrial Advisory Board's role.
Finally, faculty tend to see considerably less difference in the
"research methods and procedures used" on CCSP and their other work.
When asked about the degree of contribution to tenure,
promotion, or salary increase attributable to CCSP participation, faculty responded either a moderate amount (62.5%) or "a little"
(37.5%) (Table 23). Clearly, faculty feel CCSP participation
~ill only be one of several things which influence these
decisions.
CCSP Goals:
As will be discussed in a latter section, ratings of CCSP
goals by faculty members are strikingly similar to those of
industrial sponsors. Goal importance in decreasing order of
(3.6), enhancement of quality graduate student training (3.3),
development of commercial products in your firm (2.8) p
enhance-ment of quality industrial research (2.8), ~edirection of
univer-sity ~esearch toward industrial problems (2.6), enhancement of
graduate student understanding of industry (2.3), development of
patentable products (106) and development of commercial products
in your firm (105).
Perceived ~ikelihood of University Benefits
Faculty also rated the likelihood of the university
realizing tangible benefits from participating in CCSP (Table
25). Based on mean ratings (4
=
almost certain, 3 = prettylikely, 2
=
somewhat likely, 1=
scarcely likely> faculty appear to believe that the university is "a Lmo st; ce'rtain/I to "prettylikely" to realize most of its goalso In decreasing order of
likelihood, faculty listed: "improved knowled~e base" (3.9)" "better student t:>ecruitment" (3.5), "better student placement" (3.5), lIincreased funds for research from private sources" (302),
"imp~oved research projects in university'o (3II 1) and "beet e r
faculty recruitmentII (3.0)0 Faculty listed as noticeably 1~5s
likely "increased. university patent activity" (205) and
lIincreased funds for research from public sources" (2.3).
Faculty Perception of CCSP Effect Qn Sponsoring fi~ms
Like board members, faculty ~ere also asked to indicate
their opinion on whether or not participation in CCSP had
pro-duced specific outcomes from sponsor firms. In general faculty
ratings are consistent with BM ratings, indicating i t is probably
too early to see outcomes of CCSP participatione The vast
majority of faculty, like BMs believe sponsor companies have
already "improved their capability to cooperate with outside
scientists" (Table 26). Most faculty (78%) also believe that
CCSP participation mignt have ("maybe") had an effect on
"improved product or process design," "improvements in products and services" (6205%), "and new products developed due to relatpd
~~search" (55.6%)0 Only a minority believe CCSP ~articipation
might have had an effect on "changes in warranty ..
"improvement in processes and methods of production," "changes in cost . . . (reduced maintenance)," nreduction in product costs."
Mo one believed "increased capability to deal with qovernment
~equlations" or "increased uniformity of productsu
had"occ:urredll
Despite some minor differences these impressions tend to mirror
the evaluations made by BMso
Facultv Satisfaction and Estimate of Inctustrv Satisfaction witQ
Specific Featur~ of CCSP
Like board members, faculty were asked to rate their
satisfaction with specific features of CCSP. In general, facuLty
indicate a moderate degree of satisfaction with the technical
the Center, and its responsiveness to industry needs (2.6). Communications between Center staff and industrial participants was rated the lowest but still reflected a moderate degree of
satisfaction (2.3) (Table 27).
When asked to rate the same features according to their perception of industry's satisfaction with them, administrative practices (3.1) the technical quality (2.6) of the research and communications (2.6) were given the highest average ratings. Although faculty were satisfied with the Center's responsiveness to industry, their ratings of industry's satisfaction was slightly lower (Table 28).
Comparison of ratings to BM ratings of the same areas is interesting. In general faculty satisfaction, their estimate of industry satisfaction, and actual industry satisfaction are reasonably convergent. The only noteworthy discrepancy might be that faculty seem to be somewhat less satisfied with communicat-ion between staff and industrial participants than board members. Interestingly, faculty appear to anticipate this difference in
their estimate of industry ratings.
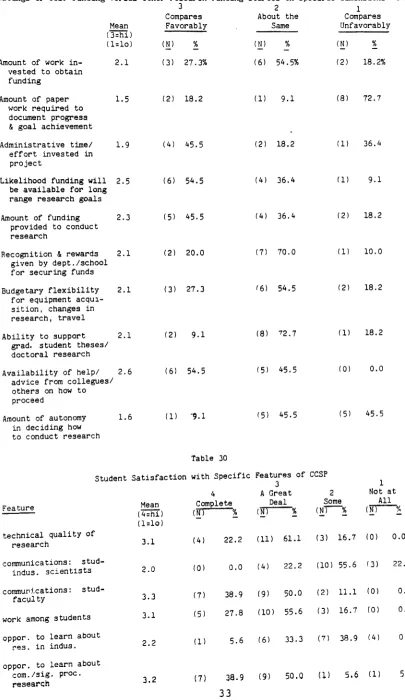
Comparison of ~CSP Fundinq to Othe~ Fundinq pources
To a large extent, faculty will tend to evaluate their participation in CCSP research relative to other research fundinq opportunities. In order to determine whether CCSP funding compares favorably or unfavorably to other research funding mechanisms, faculty were asked to compare each across a number of dimensions. On the whole CCSP funding appears to be a mixed bag (Table 29). Based on mean ratings (3
=
favorable, 2=
about the51~e~ 1
lmfavorable). faculty
tend to compareCCSP
favorably toother fundinq sources on "a v ailability of help/advice from colleagues. - ... (2.6), "likelihood funding will be available
for long-range research goals" (2.5), and "a mount of tund Inc
provided to conduct research" (2.3). On the other hand, CCSP research compares unfavorably to other funding on "amount of
paperwork. . .. (1.5), and "amount of autonomy in deciding how
to conduct research" (1.6). On most dimensions, however,
inclu-ding "amount of ",Jork invested to obtain funding, If "adrninistrati~le
time. . . , " r e cognnition and rewards. II "budgetary
flexibility . . . ," and liability to support graduate students. · II
there are no meaningful differences. Informal conversations with faculty suggest that an issue not addressed in this question, ability to publish research findings, may be an area of
dissat-isfaction among faculty.
STUDENT QUESTIONNAIRE
Student perceptions of the Center they do research for are
not a part of the standard NSF evaluation protocolo However~ in
order to get some feel for student satisfaction with their CCSP
experience, a questionnaire, developed at another NSF sponsored
center, was used to collect student satisfaction data. It should
be pointed out that this questionnaire contained a number of
questions related to student satisfaction ~ith their research in
industrial settinas and their communications with industrial
scientists. While direct industrial contact and experience was
an integral feature in the Center for ~hich this questionnai~e
was developed, it is not a standard element of a CCSP student's
experience.
In general, students express a high level of satisfaction
with their CCSP experience, both on an absolute scale (Table 30)
and relative to other faculty research (Table 31)G The vast
majority of students indicated "completetD
or IUa great deal of
-satisfaction" 'i1ith the technical quality of research,
communications bet~een students and faculty, ~ork among students,
and opportunities to learn about communications and signal
processing research. Student satisfaction tended to be higher
when they rated these features of CCSP relative to other faculty
research (as compared to their absolute ratings). Not
surprisingly, students indicated considerably less satisfaction
with "communications with industrial scientists" and
opportunities to learn about research in industrial settings.
Since extensive on-site industrial experience is not a normative
aspect of the CCSP student's experience~ these ratings are not
INDUSTRIAL SPONSOR-FACULTY COMPARISONS
A number of items were common across the four questionnaires
used. These common items allow direct comparison of the results
between respondent groups. The first of these common items dealt with the level of satisfactton each group had regarding specific
f~atures of.the Ce~tere For the most part, the respondent groups
d~ffered l~ttle 1n their levels of satisfaction assiqned to
Center features. Faculty's estimate of industryls level of
satis-faction, although slightly less than industry, in all cases was
very accurate, differing less than a half point between the
estimates and actual ratings (see Table 32, Fig. 3).
Like the board members, CCSP faculty also rated the
import-ance of various Center goals (see Table 33, Fig. 1). Overall
there is a remarkable amount of congruence between these
ratings. Faculty rating of the most important goal (general
knOWledge expansion (3.6) and two least important goals (lidevelopment ... commercial products" (1.5) and "development ...
patentable products (1.6» reflect the same relative rankings
given by board members. In addition both groups rate "deve Lop-ment of new research projects in your firm" very highly (EMs:
2nd; faculty: 3rd). The biggest difference between faculty and
BM rating would appear to be the greater importance faculty
attach to "e nhancement of graduate student technical training" (faculty: 2nd; BMs: 5th). In contrast EMs give a slightly higher importance ranking (4th) to "e nhance graduate student under-standing of industry" than faculty (6th). Another minor differ-ence is qUite interesting. Both faculty and BMs thought it was
more important for CCSP to influence their partner's research
environment than their own. For instance, BMs gave higher impor-tance rating to "redirection of university research toward indus-trial problems" than to Ie enhance quality industrial research. II
Faculty reversed the importance of these goals in their
priorities. Both faculty and board members seem to be saying the
same thing. flIt's not that important that CCSP influence my
research environment; it's more important for it to influence the research environment of the other guy."
Ratings of the likelihood of receiving tangible benefits
from Center participation were generally similar between the
faculty and industry sponsors. Faculty tended to be slightly
more optimistic about participation benefits than were industrial sponsors (see Table 34, Fig. 2).
CONCLUSIONS
When the information contained in this report were collected
CCSP was a one year old organization comprised of several
re-search projects with even briefer histories. Given this early
stage of development these findings appear to be the basis for
considerable optimism about CCSP's future survival and success. From an orgnizational perspective possibly the most
signifi-cant findinq ~as the strikinaly similar goal ratings given by
industrial sponsers and facuity. Both faculty and industrial
sponsors appear to have the same high priorities (expanded
know-ledae base, ~nhanced trainina infrastructure for studentsr and
ne~-(universitystimulated) research projects in industrial labs)
and low priorities (new products and patents) for CCSP~ Not
surprisingly given these findings, both industrial sponsors and
faculty express a ~elatively high level of satisfaction ~ith
their involvement in CCSP. Similarly, student's subjective
eval-uation of the experience they have received through their
involvement in CCSP is also quite positive.
On a more tangible level there are also modest indications
that industrial sponsors are beginning to realize some reseach
and related benefits from their investment in CCSP.
Specifical-ly, many industial sponsors indicated that CCSP projects had
produced IIs ome change" in research topics and issue within their
labs and IIa Iit tle changeII in their research methods and
proce-dures. In additionp most industrial sponsors indicated a
"possible effectlO
from CCSP involvement may have been realized in
improved product and process design and improved processes and
methods of production. BMs also reported that CCSP research had
stimulated new projects worth 248 K in their labs and reported
investing an additional 286 K on outside research (mostly
through CCSP supplemental or enhancement contracts) related to
CCSP efforts.
From a human ~esource perspective additional efforts we~e
apparent. Industrial sponsors overwhelmingly expressed a belief
that their ability to cooperate Qith outside scientists had been
enhanced. Further, member companies reported intervie~ng 22
CCSP students for jobs and hiring 3 during the center's first
year of operationo Thus~ although modest in scope, technology
transfer, both direct and indirect (via personal collaboration
and recruitment) are evident at CCSP's first anniversaryD
Not~ithstandina these favorable signs, it is probably safe
to assume that these findings and the evaluations of all parties
reflect the honeymoon phase in the center's development.
Although of uncertain import at this time all constituencies
involved in the center pointed to areas where CCSP could be
improved. Several companies indicated CCSP's research activities
and staffing ~ere not as closely alligned to their interests as
they would have liked. Faculty felt their activities within CCSP
compared unfavorably to other funding mechanisms in a few ar~a5
(autonomy in conducting reseach and amount of paperwork) D
Finally students did not feel CCSP gave them di~ect industrial
research experience. While most of these concerns appear minor
in comparison to areas of satisfaction, they warrant continuina
attention as CCSP stabilizes and its various partners decide what
they need to realize from their involvement in CCSP over the lana
haul.
PENCf.lVED INt1.UfMCE ON DlfISlOliS - fAQlLTV
I
, PROJECT SELECtlOlll
I
I
I
UP
UA
fAe CD
IUPOINTHEHTS Of fACULn/STAH'
Uf
IAR IUDGET AHDLOGISTICS
CD
lAB
'AC
£VAlUA TlON 0.· RESEAflW
S1'
10
CDlOOCT Of RlSfARCil
CD
I
I
I
I
I
I
I
I
I I
ua
I
I
~
I
UA
I
flC I.
PI..AHNINC " STRATEGY
CIl
So. .
influence
A101 of
iQflueQce Al.aat
C:O.pl~le COQlfOl
lAB UP
• • • • • • • • • • • • • • • ST
ur
ST
I I . I I I I -- -~, I I I I I I I l I I I J I I b4d I I I I IS1 I I J Jio fnfluenc~ II I I I
CO • CEMTEILDIR£C1OI
FAC • FAaR.n
lAB • 11m. ADVIS. IOAMD
ST • SnJDmTS
OP • DIIIV. PROCEWIES
UA • mil'. AJIfIIIST1lA.
CD • CEJtTf:R DIREC'IOII
fAC· FAQlLn
1A1. IND. ADVIS. lOA II0
ST • SlUlDTS
DP • UNIV. PICOCI::.XlRES
l'A • UNIV. A.JttINISTKA.
~
fiG 2. IMPORTANCE OF CCSP GOALS BY RESPONDENT CROUPS
Extremely 4
Con.iderably l
I
t-' I~
00
P 0
R
r
A N
C
E
SomewBlat 2
Not at all
DEV. REDIR. ENHANCo l:.a'4HANC. ut:v.
GEN. NEW OF U. CRAD. ST. GRAD.ST. COHli. Er~HANC. DEV. OF EXPAU. RES. RES. TO UNDST. TECH. PROD. QUAL. PATENT. KNOut. PROJo IND. INDo TRAIN. IN FIRli INO. RES .. PROD.
CD
.~
I
I II
-
I
I~
i
I
I
..LU
I
I
I
I
I
I
I
)
I
I
I
!
I
I
I
I
I
rAeI
I
I
~
cJ
cp~
~
CDI
CD 5 ,.a.~ ~
-
...-~ FAe""""'"
~ ~AB. lAB
-
......--u.e
,
~ 6 ,
AB
W;
-.
.
.w
~~ ~
!~
AC ~
CD m CENTER DIRECTOR FAe • FACULTY
S
A A Great Deal ~ T
I
S F
A
C T
I
0
N
SOOlP Comp l ete ly
Not' at all
41
FIG 3. SATISFACTION WITH CCSP FEATURES BY RESPONDENT GROUPS
I
1
~
~
I
I
TECHNICAL QUALITY
I
COMMUNICATIONSI
I
I
CCSPI
RESPONSIVENESS I OF RESEARCH ~ CCSP/IAB ADMINISTRATIVEI
II
PRACTICESI
I II
I
I
cn
CDJ
CBI
J ~
lAB lAB
J
FAC lAB
FAC I
lAB FAC
I
I
FACI
CD
I
.
I
II I
r
TABLE 1
DESCRIPTIVE INFORMATION-INDUSTRIAL BOARD MEMBERS
(ail) Question N ! Mean Median Std. Dev.
(1 ) YEARS WITH COMPANY lA.64 2.1.0 8.7
(?) YEARS IN R&D WITH COMPANY 15.0 11.0 11.1
(3) YEARS ININDUSTRY 230'1 23.0 7.1
(4 ) YEARS INR&D INDUSTRY 18.. 7 22.0 11.7
(6) ~o• OF LEVELS BE'l'WEEN RE- 400 2 ..5 208
SPONDANT AND CEO
(7) NO. OF PEOPLE REPORTING 5.4 4.33 3.2
TO RESPONDANT
(7a) NO. OF PEOPLE REPORTING 13800 11.'; 34'" . 6
VIA SUBORDINATES
(8) HIGHEST DECREE RECEIVED
SA 5 62.5
MA 1 12.5
Ph.Do 2 2500
(9) DECRE~ RECEIVED OR COURSE-WORK FROM NCSU
No 6 75.0
Yes 2 25.0
(11) PERSONAL CONTACT WITH CCSP PEflSONNEL PRIOR TO CCSP
several t1mes per week 1 1101
several times per month 1 11 .. 1 several times per year J 33.3
r-arely or never it 44.4
(12) PERSONAL INVOLVEMENT I~ CCSP ESTABLISHMENT·
Recrui tment of new companies 1 11.1
Or~nizin~ meetin~ 4 44.4
[>ropo:3'11 writilU~ a 0.0
Plannin~ 3 33.J
Build1n~University support a 0.0
(?O) PERSONAL INVOLV~ENT IN CURRENT CCSP ACTIVITIFS·
Recruitment of new companies 2 22.2
Or~anizing Meetin~ J 3303
Proposal Writin~ a 0.0
Planning 4 44.4
BuildinR University Support· 1 11.1
(17 ) ~'l'TMATF:n nF:GRer: Of9' 'fOI' MANAGE-MENT INVOLVEMANAGE-MENT IN CCSP
not at all 3 33.3
some 5 55.6
considerably 1 11.1
TABLE 2
DESCRIPTIVE INFORMATION-MEMBER COMPANY
(Q# ) Question N % Mean Median Std. Dev.
(10) Corporate contact with CCSP Personnel prior to CCSP (multiple responses allowed will not equal 100%)
as consultant 3 33.3
contract research 2 22.2
gen. faculty support 1 11.1
student thesis 1 11.1
faculty exchange 1 11.1
student exchange 2 22.2
other 3 33.3
(15) No. of organizational levels 1.9 1.7 1.3
of required to give approval to participate in Senter
(16) No. of individuals at sa-me 2.9 .5 5.5
level as board member who had to concur on decision to participate
(13) Estimated cost of CCSP par- 16.1 12.5 16.9
ticipation above yearly fee (i.e. travel, staff time, etc. )
TABLE 3
ORGANIZATIONAL CONTACT AND INFORMATION REQUESTS
(QII) Question N % Mean ~ Std. Dev.
(14) Frequency of contact with CCSP
by functional groups
Central Ii & D
no answer 4 44.4
occasionally J 33.3
Mtgularly 2 2202
Divisional R&D
no answer 5 55.6
occasionally 2 22.2
regularly 2 22.2
Production
no answer 9 lOO.D
occasionally a 000
regularly o 0.0
Marketing
no answer 9 100.0
occationally 0 OoQ
regularly 0 0.0
Engineering/technical
ne answer 1 11.1
occasionally 3 33.3
regularly 5 55.. 6
Corporate planning
no answer 8 8809
occasiQnally 1 1101
regularly 0 0.0
(18) NoD of people ~questin8inC) 8.6 5033 7,,0
(ormation on CCSP activi-ties and projects
(19) Percent of information re~ 80.6 8904 2100
quests technical in nature
Percent of information re- 1904 1006 21.0
quests admin9 or
opera-tional 1n nature
Table 4
Cr:SP has established realistic goals and objectives (026)
N %
Yes 8 8909
Maybe 1 1101
Table 5
Perceived importance of CCSP goals and outcomes (025)
1
4 3 2 Not at
Extremely Consid. Somewhat all
Mean Import. Import. Import. Import.
(4=hi) (Nr % (N) % (N) % (N) %
(1=10)
General expansion of 3.8 (7) 77.8 (2) 22.2 (0) 0'.0 (0) 0.0 knOWledge in this
tech. area
Development of new 3.1 (4) 44.4 (2) 22.2 (1) 14.3 (1 ) 14.3 research project in
your firm
Redirection of univ. 3.1 (4 ) 44.4 (2) 2'2.2 (3) 33.3 (0) 0.0 res. toward indus.
problems
Enhancement of grad- 2.9 (1 ) 11.1 (6) 66.7 (2) 22.2 (0) 0.0 uate stud.
under-standing of industry
Enhancement of grad- 2.8 (1 ) 11.1 (5) 55.6 (3) 33.3 (1 ) 0.0 uate stud. tech.
train-ing
Development of commer- 2.4 (1) 11.1 ( 4) 44.4 (2) 22.2 (2) 22.2 cial products in your
firm
Enhancement of quality 2.7 (2) 22.2 (3) 33.3 (3) 33.3 (1 ) 11.1 indus. research
Development of 1.9 (0) 0.0 (1) 11.1 (6) 66.7 (2) 22.2
patentable products
Table 6
Perceived Likelihood that company will realize tangible benefits from participating in CCSP (021)
4 3 2 1
Almost Pretty Somewhat Scarcely
Mean Certain Likely Likely Likely
( m ) (N) % (N)% (N) % (N) %
(1=10)
Better recruitment 3.3 (5) 55.6 (2) 22.2 (2) 22.2 (0) 0.0
Improved research 2.8 (2) 22.2 (3) 33.3 (4) 44.4 (0) 0.0 projects in company
Patentable products 1.9 (0) 0.0 (1 ) 11.1 (6) 66.7 (2) 22.2
Commercialized 2.2 (1 ) 0.0 (4) 44.4 (3) 33.3 (2) 22.2
products
Table 7
Degree to which CCSP research has changes in R&D projects in company
4 3 2 1
Mean Alot Some A little Hardly Any
(4=hi) (N' % (N) % (N) % (N) %
(1=10)
Research topics 2.0 (0) 0.0 (3) 37.5 (2) 25.0 (3) 37.5
and issues
Research methods and 1.5 (0) 0.0 (1 ) 12.5 (2) 25.0 (5 ) 62.5 procedures used
Table 8
stimulated in your laboratory by CCSP activities (028)
~ew Research projects
Number of Projects Mean N ~
-0 6 7500
-2 2 25.0
In Research Dollars
-0 7 77.8
1 11.1
-98K
2705 1 1101
-lSOK
In Per~on Years of
Fulltime Equivalent Stafr
-0 7 77.8
1 11.1
-3
077 1 11.1
-4
Table 9
Has CCSP activities 9timulated other outside research contracts with faculty or another laboratory? (29)
Yes
No
Don't Know
N
3
3
3
Total number of contracts g 2
Est~ted dollar value ot such research activities
Mean
-30K
-56K
-200K
-Don't Know
95..3
Total dollar value =286K
24
2
1
1
1
Table 10
Has participation in CCSP had any effect ou the followinp; in your company (Percenta~e3
calculated without "Not Applicable" response)? (032)
3 2 1 ~Jot
Mean Yes Maybe No Applicable
(3=Yes) N % N % N % N %
(1= No)
Improved c~pability to 2.51 (5) 71.4 (1 ) 14.3 (1 ) 14.3 ( ?) ??? cooperate with outside
scientists
Improved product or 2.14 (0) 0.0 (4) 80.0 (1 ) 20.0 (4) 0.0
process design
Improvement in pro- 1.5 (1 ) 16.6 (1 ) 16.6 (4 ) 66.6 (3) 0.0
cesses and methods of production
Improvements in pro- 1.4 (0) 0.0 (2) 40.0 (3) 60.0 (4 ) 0.0
ducts and services
New products developed 104 (0) 0.0 (2) 40.0 (3) 60.0 (4 ) 0.0
due to related efforts
Reduction in costs of 1.33 (0) 0.0 (2) 33.3 (4 ) 66.7 (3 ) 0.0
production
Improved capability to 1.33 (0) 0.0 (2) 33.3 (4) 66.7 (3 ) 0,0
deal with government regulations
Changes in warranty and 1.25 (0) 0.0 (1) 25.0 (3) 75.0 (5) 0.0 complaints in view if
improvements in products
Changes in cost of pro- 1.25 (0) 0.0 (1) 25.0 (3) 75.0 (5 ) 0.0
ducts to users (price changes or decreased product maintenance)
Increased uniformity 1.20 (0) 0.0 (1) 20.0 (4 ) 80.0 (5 ) 0.0
of products
Table 11
Number of CCSP trained students interviewed for possible employment (033).
()
1
2 3
6 10
Mean
1.71
Tota1 intervIewed = 22
N %
-1 4?Q
1 14.1
2 14.3
1 14.3
1 14.3
1
Number of CGSP trained students hired by your company
Mean
o 1
.29
Total hired J
25
N
6 3
%
Table 12
Number of scientists from com~any working on-site at CCSP
Mean
o
1 2
043 total on site =3
N 1 1 1 77.8 11.1 11.1 Table 13
Number of University scientists working on-site in company lab ( )
Mean o 1 2 3 .9
Total working on site :: B
Table 14
Satisfaction with operations and activities ot CCSP Mean
(4=hi, 1=10)
cOJll1)letely (4) considerably (3) some (2)
not al all(l)
Table 15 N 5 2 o 2 N 1 6 2 c 55.6 22.2 0.0 22.2 Mean (4:hi, 1=10)
Degree of Satisfaction with Specific Features of CCSP (in percentage) (022)
4 3 2
Completely Great Deal S~e
(N) % (N) % (~%
1
~lot at all
(N) ~
Technical quality of 2057 (2) 2202 (3) 33.3 (4) 44.4 CO) 0.0
the research
Cormnunications between 2.86 (3) 33.3 (4) 44.4 (2) 22.2 (0) Q.Q
CCSP staff and your company
Center administrative 2.86 (2) 2202 (6) 66.7 (1) 1101 (0) QoQ
practices
Responsiveness of CCSP 2011 (2) 22.2 (4) 4404 (3) 3303 (0) QoQ
3taff to indo needs
Table 16
Rating of overall research program in CCSP to similar research program in other UoSo
Table 11
Likelihood of renewing membership in CCSP
Mean (3=hr;-T=lo)
likely (3) uncertain (2) unlikely (1)
2.1
1
2
o
%
77.8 22.2 0.0
Table 18
Descriptive Information - University Faculty
(011 ) Ouestion N % Mean Median Std. Dev.
(3) Academic Rank (does not include CCSP Director)
Assistant 3 30.0
Associate 6 60.0
Full 0 0.0
Other 1 10.0
(3) Tenure Status
Tenured 4 36.4
Not Tenured 1 63.6
( 3) Number of Projects involved in
1 6 50.0 1.8 1.0
2 4 33.3
3 1 8.3
4 1 8.3
(3 ) Percentage of time 34.8 25.0 31.2
allocated to each project
Table 19
Percentage of faculty contacts with industry prior to CCSP by type of contact
(Q/) Question
(2) Faculty contact with in-dustry prior to CCSP
as consultant
contract research raculty exchange supervisor ot student
exchange
Mean Median
2205 1.3 4.1 oS
Stdo Dev.
-Multiple responses allowed may not total. 100%.
Table 20
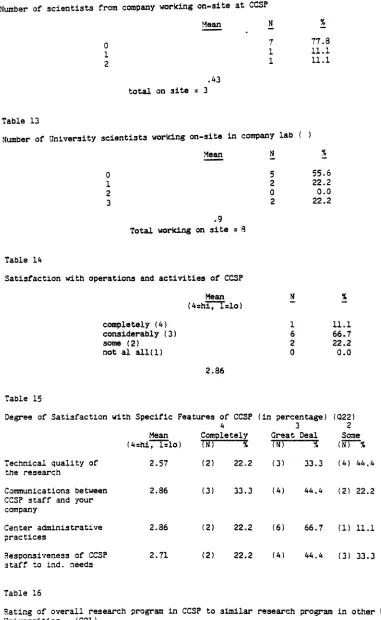
Frequency ot contact with companies ~r1ar to establishment
or
ccsp (al)1+ .3 2 1
Several Several Several Rarely or
Mean T1meslWeek T1meslMo. Times/yr. never
m
(!!),
(~) i (N) % (N) %(lela)
Carolina I'ower &l.ight 100 (0) 000' (0) 000 (0) 0.0% (12) 100.0%
Digital 106 (0) OoQ (1) 803 (5) 4107 (6) 5000
Exxon 1.0 (0) 000 (0) OoQ {Ql 000 (12) 10000
GTE loa (0) OoQ (0) OoQ (0) 0,,0 (12) 100.0
IBM 108 (0) 0.0 (j) 2.5 (4 ) 33.3 (5) 4107
ITT 1.4 (0) 0.0 (1) 8.3 (3) 25.0 ~8) 6607
Western anion loa (0) QoQ (0) 000 (0) QoQ (12) 100.0
Westinghouse 1.4 (0) QoQ (2) 1607 (1) 803 (9) 1500
Table 21
Faculty Rating of extent of influence specified groups, persons or procedures has on defined decisions (4 =almost complete control, 1 Q no influence) (Q4)
Established
University Center Industry University
Administration Director; Paculty Advisory Board Students Procedures
Std. Std. Std. Std. Std. Std.
Hean Hed. ~.
--
Hean--
Hed. Dev. !!!.!!!. ~. Dev. !!!.!!!. ~. !!!!: !!!!!!. ~. Dev. !!!!!!. Med. !!!!..Planning 1.7 '1.8 0.5 3.1 3.1 0.3 2.7 2.8 0.5 2.6 2.6 0.9 1.2 1.1 0.4 1.4 1.4 0.5 and
Strategy
Pxoject 1.0 1.0 0.0 3.0 3.1 0.9 3.1 3.1 0.7 2.4 2.3 0.8 1.4 1.4 0.5 1.0 1.0 0.0
Selec-tion
N Conduct 1.1 1.l! 0.3 2.0 1.8 1.1 3.5 l.6 0.7 1.8 1.5 0.9 2.7 2.9 0.1 1.3 1.2 0.2
\D of the
Research
Evalua- 1.2 1.1 0.4 2.6 2.7 0.8 2.8 2.9 0.4 2.9 2.9 0.7 2.0 2.0 0.7 103 1.2 0.5 tion of
the Research
Budget 1.6 1.5 0.1 3.8 3.9 0.4 2.3 2.3 0.1 1.9 1.9 0.8 1.0 1.0 0.0 1.9 1.9 0.6 and
Logistics
Appoint- 2.2 2.1 1.0 2.9 3.0 1.0 2.1 2.1 0.8 1.4 1.3 0.5 1.0 1.0 0.0 2.5 2.3 1.1
Table 22
Degree to which faculty believe research conducted at CCSP 1s different from research
typ~ca1lyconducted by faculty (Q11)
4 3 2 1
~ean A lot Some Little Hardly Any
(~) (N-r-% (N)% (N) % iN) %
(1:10)
Research topiC3 and 2,,8 (3) 2500 (6) 50.0 (1) 8.3 (~) 16.7 issues
Research methods and 2.3 (0) QoQ (7) ';R.3 (1) $Il.J '4 ) 33.3 procedures used
Cr1teria and methods 3.1 (4) 33.3 (6) 50.0 (1 ) 8.3 (1 ) A.3 used to evaluate
research projects
Table 23
Perceived degree CCSP part1cipatich contributes to tenure, promotion or salary increL~e
CCSP (Q5)
Agreat deal (4)
A moderate amount (3)
A 11ttlft (2 ,
Not at all(l)
Mean N %
5 6205
3 37.5
o OoQ
Table 24
Perceived importance of CCSP goals and outcomes (Q9) 2 1
4 1 Some- ~ot
Rxtremo Consid. what at all
Mean Import. Import. Imcort. Import.
(~) (N)
,.
(N) jI (N)"
(N) ~(1=10)
-General expansion of 306 (q) 7';.0 (1 ) A.1 (2\ 16.7 (0\ 0.0
knowledge in this tech. area
Development of new re- ~.8 (2) 1607 (5) 4l.o7 (5) c7 (0) 0.0
search project In your finn
De'/~lopment"r cOmJ'nfi!rcial loS (0) 000 (0) 0.0 (6) 5000 (6) 50.0 products in 'lour firm
Enhancement of graduate 303 (6) 50,,0 (4 ) 3303 (2) 16.7
XI) 000 stud. tech. training
~nhancementof graduate 203 (0) 000 (4) 3303 (7) 5803 (1) 8.3 scud. ~nderstandingof
industry
Redirectlon of univ. res. 2.6 (2) 16.7 '4) 33.3 (5) 41.7 (1) 8.3
toward indus. problems
Enhancement of quality 208 (3) 2500 (4) 33,,3 (5) 41.7 (0) 000 indus. research
1 Scarcely
tit!!el Y!
Table 25
Per~eived likelihood that university will r~eall~u tangible benefits from participating
in CCSP (010) 2
14 3
Some-Almost Pretty what
Mean Certain tite1Y tite1l (4-hi) (!) % N % ! !
(1-10) Table 26 Improved knowledge base Better student recruitment Better student placement Better faculty recruitment Improved research projects in the univ Increased funds for research from private sources
Increased univ. patent activity
Increased funds for research from public sources 3.9 3.5 3.5 1.0 3.1 3.2 2.5 2.3
(11) 91.7 (1) 8.3 (0) 0.0 (0) 0.0
(7) 58.3 (4) 33.3 (1) 8.3 (0) 0.0
(6) 50.0 (6) 50.0 (0) 0.0 (0) 0.0
(3) 25.0 (6) 50.0 (3) 25.0 (0) 0.0
(3) 25.0 (7) 58.3 (2) 16.7 (0) 0.0
(5) 41.7 (4) :3.3 (3) 25.0 (0) 0.0
(0) 0.0 (7) 58.3 (4) 33.3 (1) 843
(0) 0.0 (5) 41.7 (5) 41.7 (2) 16.7
Faculty perception of effect of participation in CCSP on outcomes in sponsorin~firms (Percentages calculated without "Not Applicable" response) (Q12)
~ot
Applicable
(N) %
Improved capability to cooperate with outside scientists Improved product or process design Improvements in pro-ducts &services New products dev~l oped due to related efforts
Changes in warranty
&complaints in view of improvements in products
Improvement in pro-cesses and method of production Changes in cost of products to users (price changes or decreased product maintenance) Reduction of pro-duct costs
Improved capability to deal with govern-ment regulations Increased uniformity Mean {3=yes, 1=No) 2.9 1.9 1.6 1.6 1.3 1.3 1.3 1.2 1.0 1.0
3 2 1
Yes ~aybe No
(N) % {N} % (N)
(R) ~A.9 (1) 11.1 (0)
(1) 11.1 (6) 66.7 (2)
(0) 0.0 (5) n2.~ (3)
(0) 0.0 (5) ~~.n (4)
(0) 0.0 (2) 33.3 (4)
(0) 0.0 (2) 33.3 (4)
(0) 0.0 (2) 28.6 (5)
(0) 0.0 (1) 20.0 (4)
(0) 0.0 (0) 0.0 (5)
(0) 0.0 (0) 0.0 (4)
Table 27
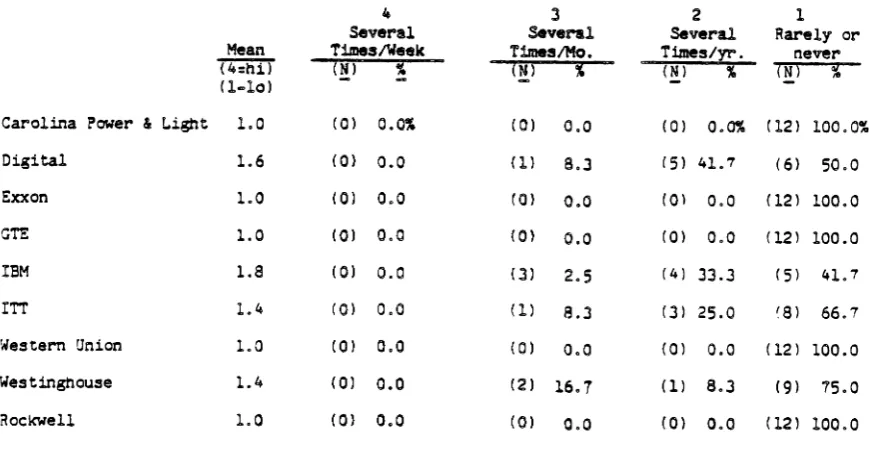
Degree of university satisfaction with specific features of CCSP (Q7)
3 1
4 A Great 2 Not at
Mean Completely Deal Some all
(4=hi)
(1=10) {N} (%) ( N') % (N) % (N) %
Technical quality 2.6 (0) 0.0% (7) 63.6% (4) 36.4% (0) 0.0% of the ~esearch
Communications be- 2.3 (0) 0.0 (5) 41.7 (5) 41.1 (2) 16.1 tween Center starr
and industrial part-icipants
CCSP administrative 2.1 (1) 8.3 (6) 50.0 (S) 41.1 (0) 0.0 practices
Responsiveness ot ~.6 (2) 18.2 ( 4) 36.4 (4) 36.4 ( I) 9.1 CCSP to industry
needs
Table 28
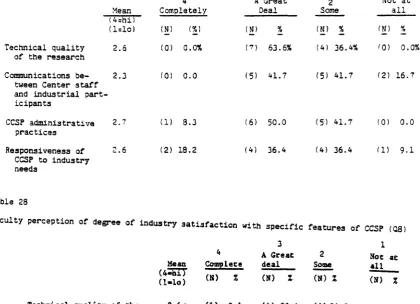
Faculty perception ot degree of industry satisfaction with specific
reatures of CCSP (Ca)
3 1
'+ A Great 2 Not at
Mean Complece deal Some all
(4-h1)
-(1-10) (N) % (N) %. (N) % (N) %
Teehnical quality of the 206 ~ (1) 9.,1 (4) 3tic.4 (6) 5405 (0) 0410
research
Communications between 2.,6 (1) 9.,1 (4) 36.4 (6) 54.5 (1) 0.0 center staff and industrial
participants
raeHCCSP administrative 301' (2) 2000 (7) 70.0 (1) 1000 (0) 000
practices
Responsiveness of IfJ€RCCSP 203 ' (0) 000 (3) 30.0 (7) 7000 (0) 000
Table 29
Ratings of CCSP funding versus other research funding sources on specific dimensions (Q 11)
3 2 1
Compares About the Compares
Mean Favorably Same Unfavorably
(3=hi)
(1=10) (N) % (N) % (N) %
Amount of work in- 2.1 (3) 27.3% (6) 54.5% (2) 18.2% vested to obtain
funding
Amount of paper 1.5 (2) 18.2 (1) 9.1 (8) 72.7
work required to document progress
&goal achievement
Administrative timel 1.9 (4) 45.5 (2) 18.2 (1 ) 36.4 effort invested in
project
Likelihood funding will 2.5 (6) 54.5 (4) 36.4 (1 ) 9.1 be available for long
range research goals
Amount of funding 2.3 (5) 45.5 (4) 36.4 (2) 18.2
provided to conduct research
Recognition &rewards 2.1 (2) 20.0 (7) 70.0 (l) 10.0 given by dept./school
for securing funds
Budgetary flexibility 2.1 (3) 27.3 (6) 54.5 (2) 18.2 for equipment
acqu~-sition, changes in research, travel
Ability to support 2.1 (2) 9.1 (8) 72.7 (1) 18.2
grad. student theses/ doctoral research
Availability of help/ 2.6 ( 6) 54.5 ( 5) 45.5 (0) 0.0 advice from collegues/
others on how to proceed
Amount of autonomy 1.6 (1 ) '9.1 (5 ) 45.5 (5) 45.5 in deciding how
to conduct research
Table 30
Student Satisfaction with Specific Features of CCSP
3 1
4 A Great 2 Not at
Mean Complete Deal Some All
Feature
(t;;hI) (N) % (N) % (Nr--% (m--%
(1=10) technical quality of
(4 ) 22.2 (11) 61.1 (3) 16.7 (0) 0.0
research 3.1
communications:
stud-(4) 22.2 (10) 55.6 (3) 22.2
indus. scientists 2.0 (0) 0.0
comeunrca tions : stud- 38.9 (9) 50.0 (2) 11.1 (0) 0.0
faculty 3.3 (7)
3.1 (5 ) 27.8 (10) 55.6 (3) 16.7 (0) 0.0 work among students
oppor. to learn about (1 ) 5.6 (6) 33.3 (7) 38.9 (4 ) 0.0
res. in indus. 2.2
oppor. to learn about com./sig. proc.
Table 31
Student Satisfaction with CCSP Research Relative to Other Faculty Research
J 1
4 A Great 2 Not at
Feature Mean Complete Deal Some All
(4:hi) (N) % (N) % (~!-r-% (~,
(1:10)
technical quality 3.4 (7) 5308 (4) 30.8 (2) 15.4 (0) 0.0 communications:
stud.-indo 2.1 (0) 0,,0 (4) 3008 (6) 4602 (3) 2301
communications:
Stud.-fac. 3.5 (7) 5308 (5) 3805 (1) 1.1 (0) 0.0
work among students 2.9 (4) 3008 (4) 30.8- (5) 38 .. 5 (0) 0.0 oppor. to learn about
re~. in indo 2.1 (2) 15.·.4 (6) 46.2 (4) 30.8 (1) 7.7
oppor. to learn about
com/sig proc. research 30 4 (6) 46 .. 2 (6) 46.2 (1) 7.7 (0) 0.0
Table 32
Degree of Satisfaction with Specific
Features of CCSP (See Figure 3p Executive Summary)
Fac. Ind ..
TIf;l2) TFf;9T
Technical quality
of research 2.6 206
Communications between Center staff and
industrial participants 203 2.9
Center administrative
practices 207 209
Responsiveness of
Center to industry
needs 206 201
Scale: 1= not at all
2: some 3= great deal 4: :ompletely
Mean Fac. estimating Ind.
fN=12)
3 2.5
Table 33
Perceived Importance of CCSP Goals and Outcomes (See Figure 2, Executive Summary)
(1= not at all impt., 2 = somewhat impt., 3= considerably, 4= Extremely)
Means
Faculty Industry
General expansion of knowledge
in this tech. area 3.6 3.8
Enhancement of grad. stud.
tech. training 3.3 2.8
Enhancement of grad. stud.
understanding of industry 2.3 2.9
Redirection of univ. research
toward industrial probe 2.3 3.1
Enhancement of quality of
industrial research 2.8 2.7
Devel. of new research
proj. in firm 2.8 3.1
Devel. of patentable
products (in firm) 1.6 1.9
Devel. of commercialized
products (in finn) 1.5 2.4
Table 34
Perceived Likelihood Company Will Realize Tangible Benefits
(benefits in the following areas as a result of participation in IUCRCCSP? (Faculty #10 e,d; Industry 27 a,b)
-Better personnel (faculty) recruitment
-Improved research projects in your company (university)
Faculty
3.0
3.1
35
Means
Industry
3.3