The Problem of Counting Sites in the Estimation of the Synonymous and
Nonsynonymous Substitution Rates: Implications for the Correlation
Between the Synonymous Substitution Rate and Codon Usage Bias
Nicolas Bierne and Adam Eyre-Walker
1Centre for the Study of Evolution and School of Biological Sciences, University of Sussex, Brighton BN1 9QG, United Kingdom
Manuscript received March 3, 2003 Accepted for publication July 25, 2003
ABSTRACT
Most methods for estimating the rate of synonymous and nonsynonymous substitution per site define a site as a mutational opportunity: the proportion of sites that are synonymous is equal to the proportion of mutations that would be synonymous under the model of evolution being considered. Here we demon-strate that this definition of a site can give misleading results and that a physical definition of site should be used in some circumstances. We illustrate our point by reexamining the relationship between codon usage bias and the synonymous substitution rate. It has recently been shown that the rate of synonymous substitution, calculated using the Goldman-Yang method, which encapsulates the mutational-opportunity definition of a site at a high level of sophistication, is either positively correlated or uncorrelated to synonymous codon bias in Drosophila. Using other methods, which account for synonymous codon bias but define a site physically, we show that there is a negative correlation between the synonymous substitution rate and codon bias and that the lack of a negative correlation using the Goldman-Yang method is due to the way in which the number of synonymous sites is counted. We also show that there is a positive correlation between the synonymous substitution rate and third position GC content in mammals, but that the relationship is considerably weaker than that obtained using the Goldman-Yang method. We argue that the Goldman-Yang method is misleading in this context and conclude that methods that rely on a mutational-opportunity definition of a site should be used with caution.
T
HERE are many different methods designed to esti- Yang(1994), define the concept of site as a “mutationalmate the rate of synonymous and nonsynonymous opportunity”—the proportion of sites that are
synony-substitution (MiyataandYasunaga1980;Perleret al. mous is the proportion of mutations that are
synony-1980;Liet al.1985;NeiandGojobori1986;Li 1993; mous under the model of evolution being considered;
PamiloandBianchi1993;GoldmanandYang1994; so most of the modern methods would class a twofold
MuseandGaut1994;Comeron1995;Ina1995). These degenerate site as largely synonymous if the ts/tv ratio
vary from the relatively simple to the extremely complex. is high, because most of the mutations occurring at such
With the exception of the method ofMuseandGaut sites are synonymous (seeappendix a).
(1994), which estimates rates per codon, each method An alternative way to proceed is to define sites
“physi-generates an estimate of the synonymous and nonsynon- cally” and to estimate the rates of substitution at sites
ymous substitution rateper site(often given the symbols of different degeneracy separately. Thus we estimate
dsanddn, which we use here, orKsandKa) by attempting rates of synonymous substitution at twofold and fourfold
to estimate the number of synonymous and nonsynony- sites independently with the number of sites, in each
mous sites (hereafterLsandLn). However, the definition case, being the actual number of sites that are twofold
of a site is not straightforward (MuseandGaut1994; and fourfold degenerate. One could also estimate the
Muse1996). For example, consider the problem of two- synonymous substitution rate at threefold degenerate
fold degenerate codons—do we define the third posi- sites but there are usually too few of them to warrant
tion as a synonymous site, one-third of a synonymous consideration. For nonsynonymous sites it is usual to
site, or some other fraction of a synonymous site, which estimate the rate per codon (appendix b).
depends upon the transition:transversion (ts/tv) ratio The aim of this article is to compare these two ways
and the level of synonymous codon bias? Most modern in which we can define a site: as a mutational
opportu-methods, such as those ofLi(1993) andGoldmanand nity or as a physical position. Counting sites as
muta-tional opportunities seems a sensible way to proceed—if the ts/tv ratio is very high, most mutations at a twofold
1Corresponding author:School of Biological Sciences, University of
degenerate site are synonymous and the site should Sussex, Brighton BN1 9QG, United Kingdom.
E-mail: [email protected] therefore be treated as largely synonymous. However,
this definition of a site can give anomalous and mis- substitution is 5 times greater in the second gene than in the first, because all synonymous mutations are transi-leading results. To illustrate the problem let us consider
a simple model. For clarity and simplicity we assume tions, and transitions occur 5 times more frequently in
the second gene. However, the estimate of synonymous that synonymous mutations are neutral and that
nonsyn-onymous mutations are either neutral or deleterious. substitution rate per site,ds, is 3x in the first gene and
7xin the second;i.e., the synonymous substitution rate
Let us assume that all codons are twofold degenerate,
that the rate of transversion mutation isxper nucleotide per site in the second gene is estimated to be only 2.3
times that in the first, whereas in reality it is 5 times site, and that the ts/tv ratio is ␣; i.e., if ␣ ⫽ 1, each
transition (e.g., C→T) occurs at the same rate as each higher. The definition of a site as a mutational
opportu-nity is misleading in this context—it does not reflect
transversion (e.g., C→A). Under this model the
nonsyn-onymous and synnonsyn-onymous mutation rates per gene are, the true biology. The reason for the discrepancy is that,
while the number of synonymous substitutions is 5 times respectively,
higher in the second gene, the proportion of sites that
n⫽ 2x(␣ ⫹3)L/3 are synonymous is also higher—it is 0.11 in the first
gene and 0.24 in the second. However, the physical
s⫽ ␣xL/3, (1)
number of twofold degenerate sites is the same in the
whereLis the length of the gene in nucleotides. In the two genes, and if we had counted just the number of
methods ofGoldmanandYang(1994) andIna(1995) substitutions per physical site we would have gotten the
the proportion of sites that are synonymous is equal to answer we expected.
the proportion of mutations that are estimated to be Unfortunately, the definition of a site can be critical
synonymous [this is also true of the methods ofLi(1993), to our understanding of a problem. To illustrate this
Pamilo and Bianchi (1993), and Comeron (1995), we reconsider the relationship between the rate of
syn-but their models are not framed in these terms—see onymous substitution and codon usage bias in
Drosoph-appendix a]. In our model the proportion of sites/ ila and mammals. Until recently it was generally accepted
mutations that are synonymous is that the synonymous substitution rate was negatively
correlated to the level of synonymous codon bias in
s⫽
Ls
Ln⫹Ls
⫽ ␣
3␣ ⫹ 6. (2) enteric bacteria (Sharp andLi 1987) and Drosophila
(SharpandLi1989;MoriyamaandHartl1993). This
This gives the expected results under the philosophy was interpreted as being a consequence of natural
selec-of counting sites as mutational opportunities; if transi- tion acting on synonymous codon use—selection in
fa-tions and transversions are equally frequent, thens⫽ vor of translationally optimal codons led to an increase
1/9 (the third position is one-third synonymous), and in synonymous codon bias and a decrease in the
synony-if transitions greatly outnumber transversions, thens⫽ mous substitution rate. However, Dunn et al. (2001)
1/3 (the third position is completely synonymous). The suggested that the correlation in Drosophila was an
numbers of synonymous and nonsynonymous sites are artifact of the methods used to correct for multiple hits,
particularly in the genes with high synonymous codon
Ls⫽ sL bias. They found that the correlation between codon
usage bias and the synonymous substitution rate
disap-Ln⫽(1 ⫺ s)L. (3)
peared when the maximum-likelihood codon-based
If the proportion of nonsynonymous mutations that are method of Goldman and Yang (GY; 1994) was used
neutral is, then the rates of synonymous and nonsyn- to estimate the synonymous substitution rate. Recently,
onymous substitutionper geneare Betancourt andPresgraves (2002) applied the GY
method to a data set of 255Drosophila melanogasterand
Dn⫽ 2x(␣ ⫹3)L/3
D. simulansloci and found a significant positive (i.e., in
Ds⫽ ␣xL/3 . (4) the reverse direction to that previously thought)
correla-tion between the synonymous substitucorrela-tion rate and co-Thus the ratesper siteare
don usage bias.
dn⫽Dn/Ln⫽ (␣ ⫹ 2)x A similar revision has taken place in mammals. It was
originally thought that the relationship between codon
ds⫽Ds/Ls⫽ (␣ ⫹ 2)x. (5)
usage bias, measured as third-position GC content (GC3), and the synonymous substitution rate was a negative As expected under this definition of site, the
nonsynony-mous substitution rate per site equals the synonynonsynony-mous quadratic, with the maximum substitution rate being
obtained at a GC3 value ofⵑ60% (Wolfe et al.1989;
rate (i.e.,dn⫽ds) when ⫽1. However, this definition
can give misleading results. Consider two genes; imagine Bulmeret al.1991; though seeBernardi et al.1993).
However, SmithandHurst(1999) and Bielawski et
that they both have similar rates of transversion
muta-tion, but that the ts/tv ratio is 1 in the first and 5 in al.(2000) found that the synonymous substitution rate
codon position. In restricting our analysis to codons that have
The lack of a negative correlation between
synony-no synony-nonsysynony-nonymous differences we are assuming that the
co-mous codon bias and the synonyco-mous substitution rate
don has undergone no amino acid substitution—this is a
rea-is puzzling because there rea-is a negative correlation be- sonable assumption given the level of amino acid divergence
tween the nonsynonymous substitution rate and codon in the data sets we analyze. We use nucleotide-based methods
that take into account the major feature of the codon usage
usage bias in Drosophila (Akashi 1994). This
correla-bias in Drosophila and mammals—i.e., the bias toward G- and
tion is found whatever method is used to estimate the
C-ending codons. For fourfold degenerate sites we used the
nonsynonymous substitution rate, including the GY method
method of Tamura (Tamura 1992) to correct for multiple
(BetancourtandPresgraves2002). There are a num- hits; this method allows for unequal GC content and ts/tv
ber of potential explanations for this correlation (Akashi bias. We give the rate of synonymous substitution at fourfold
the symbolDT
s4. For twofold degenerate codons we used
Bulm-1994;BetancourtandPresgraves2002), but it seems
er’s (1991) method, which is a derivative ofTajimaandNei’s
difficult to think of one that would not also generate a
(1984) method,
negative correlation between the synonymous substitu-tion rate and codon usage bias. For example, the
correla-dB
s2⫽ ⫺b2Ln
冤
1⫺ p2b2
冥
, (6)tion between the rate of amino acid substitution and codon usage bias might be caused by a decrease in the
where
mutation rate with increasing expression level (Bergand
b2⫽2f2(1⫺f2) .
Martelius1995;Eyre-WalkerandBulmer1995). Or
it might be caused by translational accuracy;i.e., genes p2is the proportion of twofold sites that show a synonymous
difference andf2is the frequency of GC at those sites. In theory
with many crucial amino acid sites will evolve slowly,
we could estimate the rate of substitution for CT and AG
but will also have high synonymous codon bias, to avoid
twofolds separately, but this is unnecessary because combining
errors during translation (Akashi1994). In both cases,
them gives accurate estimates (see below). Bulmer’s method
we expect the synonymous substitution rate to decrease corrects for GC content. We estimate the total number of
synony-with increasing bias. mous substitutionsper codon, for the codons analyzed, as
As we show here, the discrepancy between the
rela-tionships we see with the nonsynonymous and the synon- DcBT
s ⫽ n2dB
s2⫹n4dTs4
n2⫹n4 , (7)
ymous substitution rates and codon usage bias, in
Dro-where n2 and n4 are the numbers of twofold and fourfold
sophila, is due to the definition of a site. If we use a
degenerate sites used in the calculation ofdT
s4anddBs2,
respec-physical definition of a site there is a negative
correla-tively. We refer to these collectively as Bulmer and Tamura
tion between codon usage bias and both the synony- (BT) methods.
mous and nonsynonymous substitution rates in Dro- The original GY maximum-likelihood estimates of
diver-sophila; however, the correlation disappears if we use gences were kindly provided by Katherine Dunn and Joe
Bie-lawski; these were the number of synonymous (dGY
s ) and
non-a mutnon-ationnon-al-opportunity definition of non-a site. Which of
synonymous (dGY
n) substitutions per site and the estimated
these definitions is more informative is a question we
numbers of synonymous (LGY
s ) and nonsynonymous (LGYn) sites.
return to in thediscussion. In each case the substitution rates were estimated using the
nucleotide frequencies at each codon position (F3⫻4 model;
Yang1997) to estimate the expected codon frequencies. This is the model we also used to estimate substitution rates using MATERIALS AND METHODS
the GY method for subsets of our data. The total number of
Materials:Dunnet al.(2001) used a number of Drosophila synonymous substitutionsper codonwas estimated as data sets. We focus on one of these, 35 genes fromD.
melanogas-terandD. pseudoobscura, from which we excluded the 7 genes DcGY s ⫽3
LGY s dGYs LGY
n ⫹LGYs
. (8)
thatDunnet al.(2001) removed because they have nonstation-ary base composition. Since this data set shows a fairly high
For purpose of comparison with previous studies (Bielawski
level of divergence, we also compiled a data set of 43 D.
et al.2000; Dunnet al.2001), we used the effective number simulansandD. yakubasequences that show a lower divergence.
of codons (ENC;Wright1990) to estimate the level of codon The aligned D. melanogaster and D. pseudoobscura sequences
bias in Drosophila and GC3 in mammals. ENC has the unfortu-and the alignedD. simulans and D. yakuba sequences were
nate property of yielding low values in highly biased genes and kindly provided by Katherine Dunn and Nick Smith,
respec-high values in lowly biased genes. This can make discussion of tively.
codon bias confusing because a positive correlation between
Bielawskiet al.(2000) compiled a data set of 82
primate-the substitution rate and ENC is a negative correlation between artiodactyl-rodent sequences. Here we focus on the divergence
the substitution rate and codon bias. We endeavor to make the between primates and artiodactyls, which formed much of the
distinction clear at all points where there could be confusion. analysis in their article.
Methods:There are potentially a number of different ways in which we can estimate the synonymous substitution rate
RESULTS under a physical-sites model (see appendix b and
discus-sion). Here we use a simple method. We estimate the rate of Drosophila: Using the BT methods we find that the synonymous substitution at twofold and fourfold degenerate
rate of synonymous substitution at both twofold and
sites separately. We restrict our analysis to those codons that
fourfold degenerate codons is positively correlated to
code for the same amino acid in the two species being
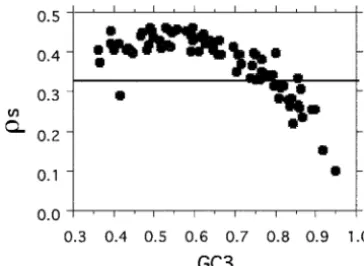
Figure 1.—The relation-ship among three estimates of the synonymous substitution rate per site and codon usage bias inD. simulans-D. yakubaand D. melanogaster-D. pseudoobscura. ENC, estimated number of co-dons.
D. simulans-D. yakubadata sets;i.e., the synonymous sub- The GY method uses the mutational-opportunity definition of a site; however, it takes into account not stitution rate per physical site is negatively correlated
to codon usage bias. In contrast, the GY estimate of the only the ts/tv ratio but also codon usage bias in its
estimate of the number of sites. As a consequence, the synonymous substitution rate is not correlated to codon
bias in either data set (Figure 1). proportion of sites that are synonymous (s) is
corre-lated to codon bias (Figure 4)—as codon bias increases The discrepancy between the methods is not due to
problems with the correction for multiple hits because (i.e., ENC decreases), so the proportion of sites that are
synonymous decreases, which cancels out the decrease both methods give similar estimates for the number of
synonymous substitutions per codonthat occur in each in the synonymous substitution rate per codon, to yield
a synonymous substitution rateper sitethat is
indepen-gene, if we restrict the analysis to those codons
consid-ered by the BT methods presented here (i.e., twofold dent of codon bias.
Mammals:The estimate of the synonymous substitu-and fourfold codons with no apparent amino acid
substi-tution; Figure 2). Furthermore, the rate of synonymous tion rate per site is positively correlated to codon bias
using both the GY and the BT methods (Figure 5).
substitutionper codonis significantly correlated to ENC
for both the GY (Figure 3) and BT methods (results However, the nature of the relationship is very
differ-ent—the gradient is much greater fordGY
s than for dBs2
not shown). So the correlation between the synonymous
substitution rate and codon bias vanishes for the GY or dT
s4(ANCOVA test for different slopes significant at
P ⬍ 0.0001 in each case) and in fact the relationship
method only when the rate is calculatedper site; hence
the difference between the GY and BT estimates is due betweendGY
s and GC3 is significantly nonlinear (a model
Figure3.—The relationship between the number of synon-ymous substitutions per codon estimated by the GY method
Figure 2.—The number of synonymous substitutions per
and codon bias in (a)D. simulans-D. yakubaand (b)D. melano-codon estimated by the GY method plotted against the number
gaster-D. pseudoobscura. estimated by the BT method for (a)D.simulans-D. yakubaand
(b)D. melanogaster-D. pseudoobscura.
fold sites being considered have been fourfold through-out the divergence of primates and artiodactyls, which ter fit to the data). Interestingly the slopes fordB
s2and
seems reasonable given that there has been no apparent
dT
s4are also significantly different (P⬍0.05), but neither
amino acid substitution in the codons considered and is significantly nonlinear. As in Drosophila, the
differ-the overall level of amino acid divergence is low). ence in the patterns seen with the GY and BT methods
is due to the way in which the GY and BT methods count sites: the BT and GY methods give very similar
DISCUSSION
estimates for the number of synonymous substitutions
per codonif we restrict the analysis to those sites analyzed The nature of the relationship between codon usage bias and the synonymous substitution depends upon
by the BT method (mean of DcGY
s across genes is 4%
greater than mean DcBT
s ). As in Drosophila the propor- the definition of a site used to estimate the substitution
rate. If a mutational-opportunity definition is used, as tion of sites that are synonymous, under the GY method,
decreases as codon usage bias increases (i.e., increasing encapsulated in the method of Goldman and Yang
(1994), then the relationship is absent or positive in GC3). This is the case even if we restrict the analysis to
fourfold degenerate codons that have not undergone Drosophila (Dunn et al. 2001; Betancourt and
Pres-graves2002) and strongly positive in mammals (
Bie-any amino acid substitution (Figure 6). The proportion
of sites that are synonymous, among these fourfold de- lawskiet al.2000). In contrast, with a physical definition
of a site, as implemented in our BT methods, the synony-generate codons, estimated by the GY method varies
from 0.10 to 0.46 in the primate-artiodactyl data set mous substitution is negatively correlated to codon bias
in Drosophila, and although the correlation is positive (Figure 6) and yet the proportion of sites that are
Figure 4.—The relationship between the proportion of sites estimated to be synonymous by the GY method and ENC in theD. simulans-D. yakubadata set.
gradient, than when using the GY method. The differ-ences between the methods are due solely to their defi-nition of a site, not to their ability to correct for multiple hits—this is illustrated by the fact that the two methods give very similar estimates of the number of synonymous substitutionsper codon(Figure 2), but different estimates of the number of substitutionsper site.
The crucial question is which definition of a site is more informative in the context of substitution rates and codon bias, and which definition is more
informa-tive in other contexts—both definitions of a site are Figure5.—The relationship among three estimates of the
synonymous substitution rate per site and GC3 in
primates-“correct” since one can define a site however one wants.
artiodactyls. The slope of the relationship is given as.
We would argue that the mutational-opportunity defini-tion of a site is likely to be misleading in some contexts simply because the definition of site is abstract and likely to depend on many factors that are not immediately
coli (Berg and Martelius 1995; Eyre-Walker and obvious. For example, the proportion of sites that are
Bulmer1995). synonymous is dependent upon the level of codon bias
General considerations: Rates of synonymous and (Figures 4 and 6).
nonsynonymous substitution have been used in many The fact that the synonymous substitution rate per
contexts including (i) the estimation of phylogeny, (ii) codon and per physical site is negatively correlated to
the estimation of absolute rates of evolution, (iii) the codon bias (positively correlated to ENC) in Drosophila
comparison of substitution rates between genes, (iv) the suggests that there is a biological phenomenon that needs
testing of models of evolution, and (v) the investigation to be explained, a phenomenon that is either obscured
of adaptive evolution. Which definition of a site should or in the wrong direction when a
mutational-opportu-we use in these different contexts? nity definition is employed. Furthermore, under the
physical definition of site, it is relatively easy to develop i. It is probably not particularly important whether
models to explain the pattern. For example, we might we define a site as mutational opportunity or a
hypothesize that the correlation is generated by direc- physical site in the reconstruction of phylogeny—
tional selection—in the development of such a model the most important quality of our metric is that it
a site is most easily defined physically (one could define reflects evolutionary divergence.
the site as a mutational opportunity and include this in ii. Whether we should use a physical or
mutational-the model, but this would add complications). Alterna- opportunity definition of a site to measure absolute
tively we might hypothesize that the relationship is gen- rates of substitution depends on what we wish to
use our estimate for. Under the assumption that erated by a correlation between the mutation rate and
synony-TABLE 1
Which definition of a site to use
Definition of a site
Mutational
Use opportunity Physical
Phylogenetics/branch lengths Sa Sa
Absolute rates of evolution Sa Sa
Comparing rates in different genes Ub Sa
Models of evolution Mc Sa
Testing for adaptive evolution Sa Ub
Figure 6.—The relationship between the proportion of aSuitable. sites estimated to be synonymous by the GY method and GC3 bUnsuitable.
in the primate-artiodactyl data set, restricting the analysis to cMay introduce unnecessary complexity. fourfold degenerate codons that have not undergone any
non-synonymous substitution. A line at one-third is shown.
mutational opportunity is clearly appropriate in this context—if all nonsynonymous mutations are
neu-mous substitution rate per site, under the
muta-tral, then the substitution rate per mutation will tional-opportunity definition of site, is the average
equal that at synonymous sites (see Equation 5). mutation rate across the three codon positions (Z.
Inferring the action of adaptive evolution using the
Yang, personal communication; see Equation 5),
physical definition of a site is much more complex.
anddsLnis the amino acid mutation rate per gene. These considerations are summarized in Table 1.
Both of these quantities may be useful. However,
in other instances the physical definition of site Estimating the rate per physical site:We can estimate
the rate of substitution per physical site in a number of may be more useful—for example, if we wanted to
estimate the effective population size of a species, different ways (appendix b). We can choose to estimate
the substitution rates per codon or per nucleotide site. we could estimate nucleotide diversity and the
syn-onymous subsitution rate at fourfold degenerate The former has the advantage that the method yields a
single estimate of the synonymous and nonsynonymous sites.
iii. As we have shown above, both in the simple model substitution rates, but it has the disadvantage that the
substitution rate will depend to some extent on the used in the Introduction and in the analysis of the
relationship between codon bias and the synony- degeneracy of the codons in the gene. This may be
important in the estimation of the synonymous substitu-mous substitution rate, the mutational-opportunity
definition of a site can give misleading results when tion rate; if the rate of synonymous substitution is higher
at fourfold than at twofold degenerate sites, as we would genes are compared unless the proportion of sites
that are synonymous and nonsynonymous is the expect given that all mutations at a fourfold degenerate
site are synonymous, then genes with a high proportion same in all the genes in the comparison.
iv. Furthermore, if we are seeking to test a model of of fourfold sites will have higher rates of synonymous
substitution per codon than genes with a low number evolution, for example, to test whether a
correla-tion between synonymous codon bias and the syn- of fourfold sites. This may not be satisfactory. However,
this sort of bias is likely to be less important for nonsyn-onymous substitution rate is due to selection, then
we can use either definition of a site by building onymous substitutions since the majority of mutations
in a gene are nonsynonymous and the relative propor-the definition of a site into propor-the model itself. However,
this will generally be much easier for the physical tion of twofold and fourfold degenerate codons does
not greatly affect this. definition of a site.
v. The one arena in which the definition of a site as The alternative to calculating rates per codon is to
calculate rates per nucleotide site as we have done in a mutational opportunity is clearly superior to the
physical definition of site is in the detection of our BT method. The BT method is useful for calculating
the rate of synonymous substitution per physical site adaptive evolution. Adaptive evolution can be
de-tected in a comparison of the nonsynonymous (dn) when codon usage can be easily summarized in terms
of base composition. However, this is often not the
and synonymous (ds) substitution rates. Let us
as-sume that synonymous mutations are neutral; then case—for example,E. colihas strong synonymous codon
bias, which is not a simple function of base composition.
if we can definedn anddssuch that dn⫽ dswhen
all nonsynonymous mutations are neutral, adaptive For data of this sort, it is preferable to use a
codon-based model to estimate the number of substitutions
evolution can be inferred if dn ⬎ ds. Estimating
Yang(personal communication) has recently suggested and selection on synonymous codon use. The latter effect arises because a nonsynonymous mutation may
a measure,d4, which can be derived from the GY method.
The method estimates the number of synonymous sub- change the codon from being preferred to unpreferred,
or vice versa. For example, let us imagine that UUU is stitutions that have occurred between fourfold
degener-ate codons and then divides this by the current number the preferred codon for phenylalanine, and CUU is an
unpreferred codon for leucine; a U → C mutation at
of sites that are physically fourfold degenerate. It would
be possible to derive a similar estimate for the rate at the first codon position may be selected against because
CUU is a less optimal codon, in terms of translational twofold degenerate sites. For estimating the rate of
non-synonymous substitution we could estimate rates at zero- accuracy, for instance. So if selection on protein
struc-ture tends to be strongly positive or negative, or neutral fold and twofold degenerate sites.
Codon bias and the number of sites:Under the GY (i.e., no slightly deleterious and advantageous effects on protein structure), and a nonsynonymous mutation is method the proportion of sites that are synonymous is
correlated to the level of codon usage bias (Figures 4 as likely to change a preferred codon to an unpreferred
codon, or vice versa, as a synonymous mutation, then and 6). This is due to the fact that the GY method takes
into account not only the ts/tv ratio but also codon the GY method will remain valid. However, these
condi-tions are unlikely to be met in many organisms—for bias itself in calculating the number of sites that are
synonymous. The reason codon bias affects the number example, because most preferred codons are G or C in
Drosophila, most nonsynonymous mutations may have of sites that are synonymous is as follows. Imagine a
gene in which all codons are fourfold degenerate and weak synonymous effects, because they usually do not
change a preferred codon to an unpreferred codon, or in which there is strong bias in favor of G- and C-ending
codons. Let us assume for simplicity that this codon vice versa. So some caution should be used in using any
test for adaptive evolution that relies on thedn/dsratio;
bias is mutational in origin (the GY method implicitly
assumes this). A strong bias in favor of GC tells us that however, it should be remembered that the test is very
conservative. the mutation rate from AT to GC is stronger than the
rate from GC to AT. Since nonsynonymous sites have Other results:The GY method has been used to
exam-ine the relationship between the synonymous substitu-lower GC content than synonymous sites, because they
are subject to functional constraints, they will have a tion rate and codon usage bias in three other groups,
enteric bacteria (SmithandEyre-Walker2001),
coni-higher mutation rate (because they have more AT sites,
which have a high mutation rate). The proportion of fers (Kusumiet al.2002), andD. melanogaster-D. simulans
mutations that are nonsynonymous will therefore be (BetancourtandPresgraves2002). In enteric
bacte-relatively large, which will be reflected in a large value ria there is a negative correlation between codon usage
ofLGY
n and a small value ofLGYs . Genes with high synony- bias and the synonymous substitution rate even if the
mous codon bias therefore have a lower proportion of rate is measured using a variation of the Tajima-Nei
synonymous sites because a smaller proportion of muta- method (Eyre-WalkerandBulmer1995), so the
cor-tions are synonymous. As with the ts/tv ratio this can relation seems robust. In conifers the correlation
re-lead to anomalous results. Imagine two genes that have mains if the synonymous substitution rate per codon is
the same number of twofold and fourfold sites and the used instead of the rateper site(data not shown). InD.
same synonymous codon bias and have undergone ex- melanogaster-D. simulans there is a negative correlation
actly the same number of synonymous substitutions. between the frequency of optimal codons and the
synon-They have the same synonymous substitution rate per ymous substitution rateper codon, contrary to the results
physical site, but if their nonsynonymous sites differ in obtained byBetancourtandPresgraves(2002; our
composition, then the estimates of the number of synon- reanalysis of their data); the positive correlation they
ymous substitutions per site, under the GY method, will detected was an artifact produced using the GY method.
be different because the proportion of mutations, and Conclusions:We have shown that the basic
philoso-hence sites, that are synonymous will differ between the phy underlying the counting of sites in many methods
genes. for estimating substitution rates (i.e., the
mutational-Other issues with the GY method: The synonymous opportunity concept) is inappropriate in some contexts.
substitution rate estimated by the GY method can be used In particular, it is inappropriate for comparing rates
to detect positive selection at nonsynonymous sites: i.e., between genes. The GY method encapsulates this basic
adaptive evolution can be inferred when dGY
n /dsGY⬎1. philosophy better than most other methods since it
However, since selection acts upon synonymous muta- takes into account both the transition/transversion ratio
tions in many organisms (Sharpet al.1992), the ques- and synonymous codon bias. Ironically, it is the
sophisti-tion arises as to whether the method is still valid (i.e., cation of the GY method that has made the problem of
is dGY
n /dsGY ⬎1 only when positive selection has oc- counting sites apparent.
curred?). Under certain simple models one can imagine
We are very grateful to Andrea Betancourt, Katherine Dunn, Joe
that it is. For example, we can think of the selection Bielawski, Junko Kusumi, and Nick Smith for sharing their data and
upon a nonsynonymous mutation as being composed of results and to Nicolas Galtier and Laurence Hurst for useful
Li, W.-H., C.-IWuand C.-C.Luo, 1985 A new method of estimating by the Biotechnology and Biological Sciences Research Council and
synonymous and nonsynonymous rates of nucleotide substitution the Royal Society.
considering the relative likelihood of nucleotide and codon changes. Mol. Biol. Evol.2:150–174.
Miyata, T., andT. Yasunaga, 1980 Molecular evolution of mRNA: a method for estimating evolutionary rates of synonymous and
LITERATURE CITED
amino acid substitution from homologous sequences and its
ap-Akashi, H., 1994 Synonymous codon usage inDrosophila melanogas- plication. J. Mol. Evol.16:23–26.
ter: natural selection and translational accuracy. Genetics 136: Moriyama, E. N., andD. L. Hartl, 1993 Codon usage bias and
927–935. base composition of nuclear genes of Drosophila. Genetics134:
Berg, O. G., and M. Martelius, 1995 Synonymous substitution- 847–858.
rate constants in Escherichia coli and Salmonella typhimurium Muse, S. V., 1996 Estimating the synonymous and nonsynonymous and their relationship to gene expression and selection pressure. substitution rates. Mol. Biol. Evol.13:105–114.
J. Mol. Evol.41:449–456. Muse, S. V., andB. S. Gaut, 1994 A likelihood approach for
compar-Bernardi, G., D. MouchiroudandC. Gautier, 1993 Silent substi- ing synonymous and nonsynonymous nucleotide rates, with appli-tutions in mammalian genomes and their evolutionary implica- cation to the chloroplast genome. Mol. Biol. Evol.11:715–724. tions. J. Mol. Evol.37:583–589. Nei, M., andT. Gojobori, 1986 Simple methods for estimating the
Betancourt, A. J., andD. C. Presgraves, 2002 Linkage limits the number of synonymous and nonsynonymous nucleotide substitu-power of natural selection in Drosophila. Proc. Natl. Acad. Sci. tions. Mol. Biol. Evol.3:418–426.
USA99:13616–13620. Pamilo, P., and N. O. Bianchi, 1993 Evolution of Zfx and Zfy
Bielawski, J. P., K. A. DunnandZ. Yang, 2000 Rates of nucleotide genes—rates and interdependence between the genes. Mol. Biol. substitution and mammalian nuclear gene evolution: approxi- Evol.10:271–281.
mate and maximum-likelihood methods lead to different conclu- Perler, R., A. Efstratiadis, P. Lomedico, W. Gilbert, R. Klodner sions. Genetics156:1299–1308. et al., 1980 The evolution of genes: the chicken preproinsulin
Bulmer, M., 1991 Use of the method of generalized least squares gene. Cell20:555–566.
in reconstructing phylogenies from sequence data. Mol. Biol. Sharp, P. M., andW.-H. Li, 1987 The rate of synonymous
substitu-Evol.8:868–883. tion in enterobacterial genes is inversely related to codon usage
Bulmer, M., K. H. WolfeandP. M. Sharp, 1991 Synonymous substi- bias. Mol. Biol. Evol.4:222–230.
tution rates in mammalian genes: implications for the molecular Sharp, P. M., andW.-H. Li, 1989 On the rate of DNA sequence clock and the relationships of mammalian orders. Proc. Natl. evolution in Drosophila. J. Mol. Evol.28:398–402.
Acad. Sci. USA88:5974–5978. Sharp, P. M., C. J. Burgess, A. T. LloydandK. J. Mitchell, 1992
Comeron, J., 1995 A method for estimating the numbers of synony- Selective use of termination and variation in codon choice, pp. mous and nonsynonymous substitutions per site. J. Mol. Evol.41: 397–425 inTransfer RNA in Protein Synthesis, edited by D. L.
Hat-1152–1159. field, B. J.Leeand R. M.Pirtle. CRC Press, Boca Raton, FL.
Dunn, K. A., J. P. BielawskiandZ. Yang, 2001 Substitution rates Smith, N. G. C., and L. D. Hurst, 1999 The effect of tandem in Drosophila nuclear genes: implications for translational selec- substitutions on the correlation between synonymous and
non-tion. Genetics157:295–305. synonymous rates in rodents. Genetics153:1395–1402.
Eyre-Walker, A., andM. Bulmer, 1995 Synonymous substitution Smith, N. G. C., andA. Eyre-Walker, 2001 Nucleotide substitution rates in enterobacteria. Genetics140:1407–1412. rate estimation in enterobacteria: approximate and
maximum-Goldman, N., andZ. Yang, 1994 A codon-based model of nucleotide likelihood methods lead to similar conclusions. Mol. Biol. Evol. substitution for protein-coding sequences. Mol. Biol. Evol.11: 18:2124–2126.
725–736. Tajima, F., andM. Nei, 1984 Estimation of evolutionary distances
Hasegawa, M., H. KishinoandT. Yano, 1985 Dating of the human- between nucleotide sequences. Mol. Biol. Evol.1:269–285. ape splitting by a molecular clock of mitochondrial DNA. J. Mol. Tamura, K., 1992 Estimation of the number of nucleotide
substitu-Evol.22:160–174. tions when there are strong transition-transversion and G⫹
C-Ina, Y., 1995 New methods for estimating the numbers of synony- content biases. Mol. Biol. Evol.9:678–687.
nous and non-synonymous substitutions. J. Mol. Evol.40:190– Tamura, K., andM. Nei, 1993 Estimation of the number of
nucleo-226. tide substitutions in the control region of mitochondrial DNA
Jukes, T. H., andC. R. Cantor, 1969 Evolution of protein mole- in humans and chimpanzees. Mol. Biol. Evol.10:512–526. cules, pp. 121–123 in Mammalian Protein Metabolism, edited by Wolfe, K. H., P. M. SharpandW.-H. Li, 1989 Mutation rates differ
N. H. Munro. Academic Press, New York. among regions of the mammalian genome. Nature337:283–285.
Kimura, M., 1980 A simple method for estimating evolutionary rates Wright, F., 1990 The ‘effective number of codons’ used in a gene. of base substitutions through comparative studies of nucleotide Gene87:23–29.
sequences. J. Mol. Evol.16:111–120. Yang, Z., 1997 PAML: a program package for phylogenetic analysis
Kimura, M., 1983 The Neutral Theory of Molecular Evolution. Cam- by maximum likelihood. Comput. Appl. Biosci.13:555–556. bridge University Press, Cambridge, UK. Zuckerkandl, E., andL. Pauling, 1965 Evolutionary divergence
Kusumi, J., Y. Tsumura, H. YoshimaruandH. Tachida, 2002 Mo- and convergence in proteins, pp. 97–166 inEvolving Genes and lecular evolution of nuclear genes in Cupressacea, a group of Proteins, edited by V.Brysonand H. J.Vogel. Academic Press,
conifers. Mol. Biol. Evol.19:736–747. New York.
Li, W.-H., 1993 Unbiased estimation of the rates of synonymous and
non-synonymous substitution. J. Mol. Evol.36:96–99. Communicating editor: J.Hey
APPENDIX A: used currently. In this method the different pathways
MUTATIONAL-OPPORTUNITY METHODS between two codons, which differ by more than one
codon, are weighted equally. The correction of multiple Here we describe the major methods that are used
hits is achieved using the Jukes-Cantor (Jukesand
Can-to estimate rates of synonymous and nonsynonymous
tor1969) model of evolution in which all nucleotide
substitution.
changes are assumed to be equally likely (i.e., ts/tv ⫽
Nei and Gojobori (1986): Nei and Gojobori
sug-1). The methods assume that a twofold degenerate site gested two methods, which differ in the way they
com-is one-third synonymous, which com-is as one expects under pute the number of synonymous and nonsynonymous
the mutational-opportunity philosophy and the model changes between two codons that differ at more than
Li et al. (1985), Li (1993), Pamilo and Bianchi whereLis the length of the gene in codons (we could define it in nucleotides but the logic is a little clearer
(1993):The method of Liet al. (1985) differs from that
of Neiand Gojobori(1986) in two respects. First, the in codons). These equations simplify to
method does not assume that pathways between codons,
Ka⫽ (␣ ⫹2x) and Ks⫽ ␣ ⫹2x (A3)
with multiple differences, are equally likely. And second,
the correction for multiple hits is achieved using Ki- as expected. Note, however, that these equations are
ex-mura’s two-parameter method in which transitions can actly those given by the mutational-opportunity model in
have a different substitution rate to transversions. How- the Introduction (Equation 5). Although in the simple
ever, the model assumes that a twofold degenerate site model we assumed that all codons were twofold
degen-is one-third synonymous. The method degen-is therefore not erate, the conclusions remain unchanged if we include
strictly a mutational-opportunity method because the fourfold degenerate codons (results not shown).
model of nucleotide change allows transitions and trans- Comeron(1995):The method of Comeron is
essen-versions to occur at different rates while the number of tially that of Li(1993) and Pamiloand Bianchi(1993)
sites is calculated assuming that transitions and transver- but with one small alteration. The methods of Li(1993)
sions are equally likely. This discrepancy was removed and Pamiloand Bianchi(1993) treat all synonymous
in a later development of the method (Li1993). The changes at twofold sites as transitions whereas some
method of Li(1993) is very similar to the two methods of them are transversions.Comeron(1995) suggests a
of Pamiloand Bianchi(1993). These methods differ method to deal with this bias.
only in the way they treat the different pathways between Ina(1995):Ina suggests two methods. In each of his
codons with multiple differences—the method of Li methods the ts/tv ratio is estimated and this is used to
(1993) follows that of Liet al. (1985) and weights path- compute the number of synonymous and
nonsynony-ways according to their likelihood, while the methods mous sites—i.e., the method is a mutational-opportunity
of Pamiloand Bianchi(1993) either weight pathways method. The two methods differ in how the ts/tv ratio
equally or choose the pathways that maximize the num- is estimated. In the first approximate method the ts/tv
ber of synonymous relative to nonsynonymous changes. ratio estimated at the third codon position is used to
Both methods estimate the nonsynonymous and synony- calculate the number of sites; however, this will tend to
mous substitution ratesper siteas bias the ts/tv ratio upward because some of the third
codon-position sites are twofold degenerate. The second
Ka⫽A0⫹
(L0B0⫹L2B2)
(L0⫹L2)
method uses an iterative procedure to estimate the ts/ tv ratio. Pathways between codons with multiple substitu-tions are weighted equally.
Ks⫽
(L2A2 ⫹L4A4)
(L2 ⫹L4)
⫹ B4, (A1) GoldmanandYang(1994):The method of Goldman
and Yang(1994) is somewhat different from those
consid-where L0, L2, and L4 are the numbers of zero-, two-, ered so far in that it considers the substitution process
and fourfold degenerate sites, respectively (the methods between codons, not nucleotides. The rate of substitution
treat isoleucine as twofold degenerate), andAxandBx between two codons,iandj,is assumed to be
are the rates of transition and transversion substitution atx-fold degenerate sites, respectively. Note that we use the symbolsKaandKsrather thandnanddsto maintain
consistency with the original articles. qij⫽
0 if codons differ at more than one position j for a synonymous transversion
kj for a synonymous transition j for a nonsynonymous transversion j for a nonsynonymous transition,
In essence the methods are attempting to estimate the rate of substitution at zerofold and fourfold degenerate sites taking into account rates of evolution at twofold
where jis the equilibrium frequency of codonj, is
degenerate sites. This method is a
mutational-opportu-the nucleotide substitution rate per codon,kis the ts/
nity method but this is not obvious. To demonstrate
tv ratio, and is the nonsynonymous to synonymous
this let us assume that a fraction␥of codons are fourfold
substitution rate ratio (dn/ds). The method finds the
degenerate with a fraction (1⫺ ␥) being twofold
degen-values of , k, and that maximize the likelihood of
erate; for simplicity we assume that there are no
three-observing the data. The proportion of sites that are fold and sixfold degenerate codons. As in the simple
synonymous is estimated by using the
maximum-likeli-model above we assume that the transversion rate isx
hood value ofk, setting ⫽1 and evaluating the
expres-and that the ts/tv ratio is␣. Under this model we can
sions write Equations A1 as
s⫽
兺
iqij for all codons aai⫽aajKa⫽
冢
␣x⫹4␥Lx⫹2(1⫺ ␥)Lx
2␥L⫹ (1⫺ ␥)L
冣
n⫽
兺
iqij. for all codons aai⬆aai(A4)
Ks⫽
(1⫺ ␥)L␣x⫹ ␥L␣x
methods the nonsynonymous, or amino acid,
substitu-s⫽ s s⫹ n
and n⫽ 1⫺ s. (A5) tion rate per codon is estimated by calculating the
pro-portion of amino acid sites that differ between two
se-This is a mutational-opportunity method that takes into quences, p, and then using a correction for multiple
account not only the ts/tv ratio, but also codon usage hits. The simplest correction is
bias in its estimate of the proportion of sites that are
Kaa⫽ ⫺Ln(1⫺p) (B1)
synonymous.
(Zuckerkandland Pauling1965), butKimura(1983) suggested an empirically derived improvement on this,
APPENDIX B: PHYSICAL-SITES APPROACH which more closely reflects the actual pattern of amino
acid divergence,
Nucleotide site methods: Physical-site methods can
be divided into two categories—those that estimate rates K
aa⫽ ⫺Ln(1⫺ p⫺0.2p2). (B2)
per nucleotide site and those that estimate rates per
MuseandGaut(1994):One physical-site method is codon. Methods to estimate rates per nucleotide site
designed to estimate both the synonymous and nonsyn-have been largely concentrated on estimating the rate
onymous substitution rates per codon. This is the of synonymous substitution at fourfold degenerate sites,
method of Muse and Gaut (1994). They have
devel-a medevel-asure usudevel-ally given the symbol K4 or d4. The
ap-oped a model that uses the codon, as opposed to the
proach taken is the one we have used above—i.e.,
re-nucleotide, as the unit of evolution. The parameteriza-stricting the analysis to fourfold degenerate sites in
co-tion of the model of Muse and Gaut (1994) is very
dons that have not undergone any apparent amino acid
similar to the one of Goldmanand Yang(1994), with
substitution, and then using one of the many nucleotide
the exception that the ts/tv ratio parameter is removed. substitution models to correct for multiple hits: the most
The rate of substitution between two codons,iandj, is
widely used models, in order of complexity (i.e., number
assumed to be
of parameters), are the models ofJukesandCantor
(1969),Kimura(1980),TajimaandNei(1984),
Haseg-awa et al. (1985), Tamura (1992), and Tamura and
qij⫽
0 if codons differ at more than one position
␣j for synonymous mutations
j for nonsynonymous mutations.
Nei(1993). See Wolfeet al. (1989), andBulmeret al.
(1991) for examples of this approach.Bulmer(1991)and
Bulmeret al. (1991) also suggested a similar method to The synonymous and nonsynonymous substitution rates
estimate the synonymous substitution rate at twofold per codon, ␣ and , are estimated by maximum
likeli-degenerate sites. hood. Contrary to Goldman andYang (1994), Muse
Codon methods: We are not aware of any method andGaut(1994) did not attempt to compute
substitu-aimed at estimating the rate of nonsynonymous substitu- tion rates per site. Subsequently Muse (1996) has
dis-tion per physical nucleotide site, but there are physical- cussed at length the ambiguity surrounding the