DOI: 10.1534/genetics.109.104216
Does Gene Translocation Accelerate the Evolution of
Laterally Transferred Genes?
Weilong Hao*
,†and G. Brian Golding*
,1*Department of Biology, McMaster University, Hamilton, Ontario L8S 4K1, Canada and†Department of Biology, Indiana University, Bloomington, Indiana 47405
Manuscript received April 20, 2009 Accepted for publication May 18, 2009
ABSTRACT
Lateral gene transfer (LGT) and gene rearrangement are essential for shaping bacterial genomes during evolution. Separate attention has been focused on understanding the process of lateral gene transfer and the process of gene translocation. However, little is known about how gene translocation affects laterally transferred genes. Here we have examined gene translocations and lateral gene transfers in closely related genome pairs. The results reveal that translocated genes undergo elevated rates of evolution and gene translocation tends to take place preferentially in recently acquired genes. Translocated genes have a high probability to be truncated, suggesting that translocation followed by truncation/deletion might play an important role in the fast turnover of laterally transferred genes. Furthermore, more recently acquired genes have a higher proportion of genes on the leading strand, suggesting a strong strand bias of lateral gene transfer.
G
ENE insertions and deletions, together with gene translocations play important roles in bacterial genome evolution (Garcia-Vallve´ et al. 2000;Ochman and Jones 2000; Tillier and Collins
2000a; Fraser-Liggett 2005). Gene insertions and deletions, as the essential driving forces in influencing gene content (Kunin and Ouzounis 2003), have received a great deal of attention. Various methods have been employed to study gene insertions and deletions previously; for instance, there are studies of population dynamics (Nielsenand Townsend2004), such as a birth-and-death model of evolution (Berg and Kurland 2002; Novozhilovet al. 2005), phylog-eny-dependent studies including parsimony methods
(Daubin et al. 2003a,b; Mirkin et al. 2003; Hao and
Golding 2004), and maximum-likelihood methods
(Haoand Golding2006b, 2008b). It has been shown that recently laterally transferred genes have high evolutionary rates and high rates of gene turnover
(Daubinet al.2003b; Haoand Golding2004, 2006b).
Gene rearrangement has also been commonly stud-ied as another important driving force that shapes bacterial genomes (for a review, see Rocha2004). Gene order changes in genomes are history dependent; for instance, fewer gene rearrangements are expected among more closely related species. Gene order within genomes has therefore been used to reconstruct phy-logeny (Sankoffet al. 2000; Tamames2001; Rogozin et al. 2004; Belda et al. 2005). Previous studies have
focused mainly on lateral gene transfer (LGT) and gene rearrangement individually, but little is known about any association between laterally transferred genes and gene rearrangements. The study of gene order of laterally acquired genes might shed some light on the understanding of the LGT process.
In this study, we have examined gene translocations and lateral gene transfers in closely related genome pairs. It is shown that the proportion of translocated genes among recently acquired genes is always high, while the proportion of translocated genes is always low in ancient genes, suggesting that gene translocation tends to take place in recently transferred genes. The results also reveal that translocated genes have elevated rates of evolution compared with positionally conserved genes and gene truncation is more prevalent in located genes. These findings suggest that gene trans-location might accelerate the gene turnover of recently transferred genes and/or that genes likely to undergo translocation are those genes more likely to be laterally transferred and dispensable for the genome. Further-more, the proportion of recently acquired genes is higher on the leading strand, suggesting that laterally transferred genes are biased toward being on the leading strand. After lateral transfer, some genes could be trans-located to the lagging strand and some transtrans-located genes are likely to be eliminated during evolution.
METHODS
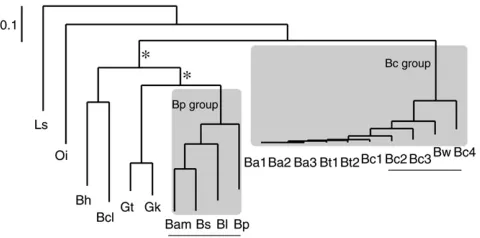
The Bacillaceae group was chosen in this study due to the abundance of completely sequenced congeneric species. Complete genome sequences (Table 1 and Supporting information is available online athttp://www.genetics.org/
cgi/content/full/genetics.109.104216/DC1.
1Corresponding author: Department of Biology, McMaster University, Hamilton, Ontario L8S 4K1, Canada. E-mail: [email protected]
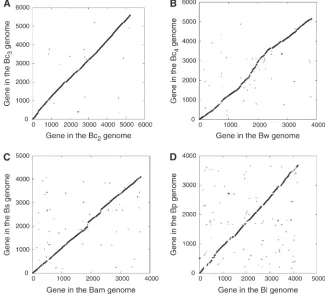
Figure 1) were downloaded from the NCBI database (ftp://ftp.ncbi.nlm.nih.gov/). Annotated protein se-quences were extracted from each complete genome. Four genome pairs (BlBp, BamBs, BwBc4, and Bc2Bc3) were examined for gene translocation because of the variation in gene content and the absence of large-scale genome rearrangement between each genome pair (Figure 2). The reciprocal best hit procedure has been commonly used for identifying orthologous pairs (Eisen 2000; Hirsh and Fraser 2001); in this study, orthologs were inferred from reciprocal best hits via a BLASTP search (Altschul et al. 1997). Significant matches are required to have an E-value ,105. To avoid the confounding effects of duplication during evolution (Guet al.2002; Zhanget al.2003), all paralogs in the analyzed genomes were excluded from further analysis. To do this, a TBLASTN search was conducted to search against both the query and the subject genomes with anE-value,105. If there was more than one significant hit in either genome, the query se-quence was removed from further analysis. To avoid the potential effect of nonorthologous matches, a series of different cutoff thresholds on protein identity (from 30 to 80%) were employed in addition to the existing criteria for identifying orthologs.
Genes were further categorized into group-specific genes and nonspecific genes. For instance, Bc group-specific (see Figure 1 for group definition) genes are present only in the Bc group but absent (with anE-value
.105) from any other Bacillaceae genomes. Similarly, Bp-specific genes are present only in the Bp group but absent from any other Bacillaceae genomes. Members of orthologous genes were sorted according to their physical location on the chromosomes in each genome. The pairs that do not show conserved location on the chromosomes were deemed as translocated genes. Gene truncation was also identified in each genome pair. Annotated gene sequences in one genome were used as query sequences to BLAST against another genome. Significant hits are required to have anE-value
,105. The match length of each hit was shown and the fraction of imperfect matches was used as an indicator for the degree of gene truncation as in Hao and
Golding (2008a). To avoid the potential effect of
nonorthologous matches, a series of more restrictive cutoff thresholds on E-values were examined (105, 1010, 1015, and 1020).
No large-scale genome rearrangement was observed in the four genome pairs (Figure 2), which makes it easier to study individual gene translocation. Among the four genome pairs, BlBp is the most diverse pair, and Bc2Bc3 is the least diverse pair (see supporting
in-formation, Figure S1). The lower ends of the 95% confidence interval on protein identity for BlBp, BamBs, BwBc4, and Bc2Bc3 are 38.1, 52.1, 58.5, and 80.1, respectively. When different cutoff thresholds were not used, the lower ends of the 95% confidence interval were used to avoid the potential effect of nonortholo-gous matches.
Regions associated with insertion sequences (ISs) and prophages were identified. ISs were identified by the IScan program (Wagner et al. 2007), using query sequences of 20 reference sequences from Wagner
TABLE 1
Strain information in the Bacillaceae group
Taxa Abbreviation
Accession No.
Bacillus anthracisstr. ‘‘Ames Ancestor’’
Ba1 NC_007530
B. anthracisstr. Ames Ba2 NC_003997 B. anthracisstr. Sterne Ba3 NC_005945 B. amyloliquefaciens Bam NC_009725
B. cereusE33L Bc1 NC_006274 B. cereusATCC 10987 Bc2 NC_003909 B. cereusATCC 14579 Bc3 NC_004722 B. cereussubsp. cytotoxis Bc4 NC_009674
B. clausii Bcl NC_006582
B. halodurans Bh NC_002570
B. licheniformisATCC 14580 Bl NC_006322
B. subtilis Bs NC_000964
B. thuringiensisserovar konkukian
Bt1 NC_005957
B. thuringiensisstr. Al Hakam Bt2 NC_008600
B. pumilus Bp NC_009848
B. weihenstephanensis Bw NC_010184
Geobacillus kaustophilus Gk NC_006510
G. thermodenitrificans Gt NC_009328
Lysinibacillus sphaericus Ls NC_010382
Oceanobacillus iheyensis Oi NC_004193
Listeria innocua Outgroup NC_003212
L. monocytogenes Outgroup NC_003210
Figure1.—Phylogeny of the Bacillaceae group.
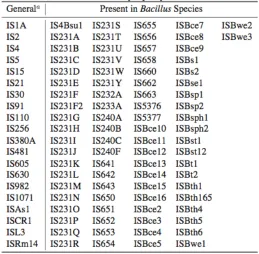
et al.(2007) and 82 additional IS sequences that have been discovered in Bacillus species (names are given in
Table S1). The sequences of all 102 ISs were obtained from the ISfinder website (Siguieret al.2006b). Genes present in the IS regions were deemed to be IS associated. Prophages in each genome were identified by the Prophinder web server (Lima-Mendez et al. 2008). Genes present in the prophage regions were deemed to be prophage associated.
The origins and termini of replication for all genomes were identified by GC skew as done in previous studies (Lobry 1996; Morton and Morton 2007). GC skew was computed from the function (G
C)/(G1C) on 1000-bp windows across each genome. Gene location together with its orientation was used to determine whether the gene is on the leading strand or not. The number of genes on the leading strand was counted (see Table S2). The proportion of genes on the leading strand was further analyzed at different phylogenetic depths in both the Bc group and the Bp group. In the Bc group, group-specific genes in the Ba1 genome were examined and classified according to their depth in the phylogeny. In brief, genes present in Bc4were categorized asn0, genes present in Bw but not present in Bc4 were categorized as n1, genes present in Bc3 but not present in Bw or Bc4 were categorized as n2, genes present in either Bc1 or Bc2 but not present in Bc4, Bw, or Bc3were categorized as n3, genes present in Bt genomes but not present in Bc4, Bw, Bc3, Bc2, or Bc1 were categorized as n4, and
genes present only in the Ba strains were categorized asn5.
Alignments of homologous sequences were con-structed using the MUSCLE program (Edgar 2004). Three hundred twenty-five nonduplicated genes that are universally present in all Bacillaceae genomes were used for phylogeny reconstruction. A maximum-likelihood tree and a neighbor-joining tree were generated on concatenated sequences of the 325 genes (335,380 characters), using the PHYLIP package (Felsenstein 1989) version 3.67, and the rate variation parameter alpha was estimated using the PUZZLE program
(Strimmer and von Haeseler 1996). The ratio of
nonsynonymous changes to synonymous changes (Ka/Ks ratio) was measured by the Yangand Nielsen (2000) method, using yn00 in the PAML package (Yang2007) based on nucleotide sequence alignments that were created from the corresponding protein alignments. To obtain a more reliable measurement of Ka/Ks, we excluded protein pairs that have protein identity
,50%, since in this case synonymous changes might be greatly saturated. Statistical analyses were conducted using the R package (R Development Core Team 2008).
RESULTS
Molecular evolution of translocated genes: Evolu-tionary distance of different genes was examined
Figure2.—Genome synteny. (A) Bc2vs.
Bc3; (B) Bwvs.Bc4; (C) Bamvs.Bs; (D) Bl vs.Bp. Homologous matches are taken to have an expected value ,105 between
separately in each genome pair (Figure 3, A–D). Strikingly, conserved specific genes have greater evolu-tionary distance than conserved nonspecific genes in all genome pairs. Ka/Ks values, as an indicator for the degree of functional constraints, were also examined for different gene groups (Figure 3, E–H). Conserved specific genes have greaterKa/Ksvalues than conserved nonspecific genes in all genome pairs. This is consistent with previous findings that recently transferred genes have faster rates of evolution (Hao and Golding 2006b). In nonspecific genes, translocated genes have faster rates of evolution over positionally conserved genes in the BlBp, BamBs, and BwBc4 genome pairs, suggesting that translocated genes tend to have greater rates of evolution over positionally conserved genes. Translocated nonspecific genes also show significantly higherKa/Ksvalues over positionally conserved genes in the BlBp and BamBs pairs. A MANOVA test (seeTable S3) also supports that both LGT and gene translocation
contribute to the elevated substitution rates andKa/Ks values.
Translocation in recently acquired genes: The pro-portion of translocated genes was calculated and is shown in Figure 4. The results reveal that recently transferred genes have a high proportion of trans-located genes in all four genome pairs, while a high proportion of translocated genes was not observed in ancient genes (nonspecific genes). In fact, the pro-portion of translocated genes in genes that are present in all Bacillaceae genomes is even lower than that in nonspecific genes (data not shown). Together, the data show that gene translocation tends to take place in recently transferred genes. If gene translocation is a constant process throughout bacterial genome evolu-tion, the results suggest that many translocated genes are deleted rapidly during evolution. These results are robust when different cutoff thresholds are used (pro-tein identity from 30 to 80%). In other words, the high
Figure3.—DNA distance [(A) BlBp; (B) BamBs; (C) BwBc4; (D) Bc2Bc3] andKa/Ksvalues [(E) BlBp; (F) BamBs; (G) BwBc4;
(H) Bc2Bc3] in each genome pair. Abbreviations: Bc (Bp), Bc (Bp) group-specific genes; nonBc (nonBp), gene not specific to the
Bc (Bp) group. The size of each class is shown. InKa/Ksestimation, gene pairs that have protein identity,50% were excluded.
proportion of translocated genes in recently transferred genes is not an artifact of relaxed cutoff thresholds used to identify orthologs.
This trend holds true in genes acquired at different evolutionary depths. Group-specific genes were further divided and analyzed in two types (‘‘A’’ and ‘‘B,’’ Figure 5). The A type of genes is present in a narrower spectrum of genomes than the B type of genes, and, very likely, the A type of genes is more recently acquired than the B type of genes. Figure 5A shows that the A type of genes yields a higher percentage of translocated genes than the B type of genes in both BamBs and Bc2Bc3genome pairs. To minimize the effect of xenol-ogous gene displacement (with the original copy missing), we excluded genes with exceptionally large phylogenetic distance in Figure 5, B and C. In brief, for a gene, if the DNA distance from a closely related strain is larger than the distance from a slightly more distantly related strain (e.g., Bam-Bs.Bs-Bl or Bam-Bs.Bs-Bp), the gene is excluded from further analysis. Figure 5B shows that the B type of genes has a higher proportion of translocated genes than nonspecific genes in both BamBs and Bc2Bc3genome pairs. We then expanded the same analysis on nonspecific genes in Figure 5C. It
shows that genes present in a broader spectrum have a higher proportion of translocated genes than those present in a narrower spectrum. In other words, the proportion of translocated genes is nicely associated
Figure4.—Higher proportion of translocation in
taxa-spe-cific genes than in nonspetaxa-spe-cific genes. A variety of protein identity cutoffs were used for ortholog identification, and genes associated with ISs and prophages were excluded. (A) The BwBc4 and Bc2Bc3 genome pairs; (B) the BlBp
and BamBs genome pairs. In each genome pair, the propor-tion of translocapropor-tion in taxa-specific genes is higher than that in nonspecific genes. In each panel, open triangles are higher than solid triangles and open squares are higher than solid squares (P-values of ax2-test are shown).
Figure5.—Translocated genes in recently acquired genes.
(A) Translocated genes at different phylogenetic depths. Group-specific genes (labeled as ‘‘specific’’ in Figure 4) in two genome pairs BamBs and Bc2Bc3were further examined
at different phylogenetic depths using reference genomes. Bp and Bl are a reference for the BamBs pair; Bw and Bc4are a
reference for the Bc2Bc3pair. The ‘‘A’’ types of genes are
with the phylogenetic depths. It is worth mentioning that the inverse relationship between the proportion of translocated genes and their gene age is not likely an artifact of different degrees of divergence among gene categories. Genes within some genome pairs are highly similar in terms of their protein identity. For instance,
.95% of gene pairs between Bc2Bc3 have protein identity.80.1% (see Figure S1). Divergent orthologs in these closely related genomes would still be able to be detected using low protein identities as cutoffs. In fact, the inverse relationship between the proportion of translocated genes and their gene age is robust in closely related pairs (and distantly related pairs) regard-less of cutoff thresholds (Figures 4 and 5). These data support that more recently acquired genes are more likely to be translocated.
Truncation in translocated genes:If gene truncation, as an imperfect form of gene deletion, takes place constantly as does gene deletion, different numbers of truncated genes might reflect different levels of gene deletions (Hao and Golding 2006a). Figure 6 shows the fraction of imperfect match length in a TBLASTN search after excluding genes associated with ISs and prophages. The results reveal that translocated genes have a higher proportion of truncated genes over positionally conserved ones in the BwBc4 pair. This trend is robust after more restrictive cutoff thresholds on E-values were used in identifying orthologs (from 105to 1020). To avoid the potential effect of frameshift mutation, a BLASTN search was conducted using the
DNA sequences of annotated genes as query sequences. The result is consistent that translocated genes have a higher proportion of truncated genes over positionally conserved ones (see Figure S2). Comparison was also conducted reciprocally within the BwBc4 pair and within each of the other three genome pairs, the trend holds true for all of them (data not shown). This suggests that the high proportion of gene truncation in translocated genes is not an artifact of the particular analyzed genome, but rather it is a general phenome-non in bacterial genome evolution.
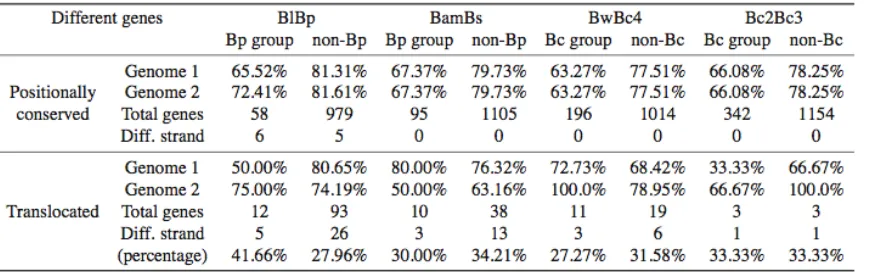
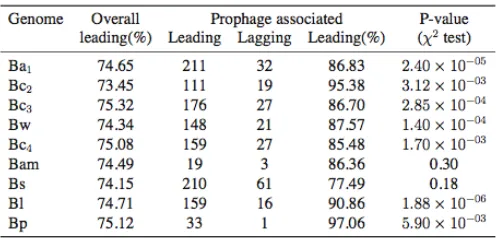
Dynamic strand bias: Among positionally conserved genes, group-specific genes have a lower proportion on the leading strand than nonspecific genes (Figure 7). Since it has been shown that essential genes tend to be more conserved on the leading strand (Rocha and
Danchin 2003; Fang et al. 2005), one should expect
that functionally important genes are more likely on the leading strand. Genes on leading/lagging strands were counted according to their COG classification
(Tatusovet al.2000). Poorly characterized genes and
genes not included in COG classification have a lower percentage of genes on the leading strand compared with other genes (data not shown). Genes could also be translocated to a different strand during evolution. Among the translocated genes, 30% of them have been translocated to a different strand (seeTable S2).
The proportion of genes on the leading strand was further examined at different phylogenetic depths in the Bc group (Figure 8). It is clear that more recently acquired genes have a higher proportion of genes on the leading strand. This trend is the opposite of the result that ancient genes have a higher proportion of genes on the leading strand than overall group specific genes (Figure 7). The result of more recently acquired genes on the leading strand could not be explained by
Figure6.—Fraction of homologous sequences that do not
have a perfect match length in a TBLASTN search using dif-ferent cutoffs forE-values. Annotated genes from the Bc4 ge-nome were used as query sequences to search against the Bw genome. Genes associated with ISs and prophages were ex-cluded. (A) Positionally conserved genes; (B) translocated genes.
Figure7.—Proportion of positionally conserved genes on
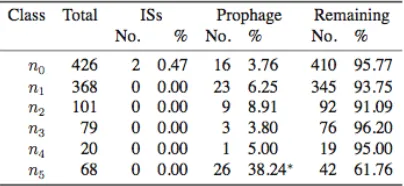
the essentiality of recently acquired genes, since pre-vious analyses have shown faster evolutionary rates and higher Ka/Ks ratios in more recently acquired genes (Hao and Golding 2006b). Genes and the ISs and prophage regions in the Ba1genome were mapped on the chromosome (see Figure S3). The most recently acquired classn5has a significantly higher proportion of genes associated with prophages (see Table S4). This might explain a small part of the higher pro-portion of genes on the leading strand in more recently acquired genes, since phages tend to integrate in such a way that most of their genes are coded on the leading strand (Campbell2002). The negative associ-ation between phylogenetic depth and proportion of genes on the leading strand, however, still holds after excluding genes associated with ISs and prophages (Figure 8).
DISCUSSION
Robustness: Inferring gene translocation relies heavily on the identification of orthologous pairs. Any
single threshold for ortholog identification might be problematic. We therefore made use of a series of cutoff thresholds to detect orthologs. Different threshold values caused some variation of the number of orthol-ogous pairs, such as a decrease in the numbers of orthologous pairs when using restrictive cutoffs and an increase in the numbers of orthologous pairs when using relaxed cutoffs. Importantly, the proportion of translocated genes in recently transferred genes is always higher than that in ancient genes when using different cutoff thresholds. The high frequency of gene translocation in recently acquired genes, therefore, is not likely an artifact of the methodology used in this study.
Gene duplication is very common during genome evolution and substitution rates are often accelerated following gene duplication (Zhang et al.2003). After gene duplication, duplicates may be retained and undergo neofunctionalization or subfunctionalization (Lynchand Force2000; Lynchet al.2001). There is a possibility that some orthologs inferred in this study were involved in differential loss after duplication. It has been shown that differential loss and gene conversion might happen after ancient duplication (Lathe and Bork2001), and gene duplication followed by differ-ential loss can always be invoked as an alternative to lateral gene transfer and vice versa (Gogarten and
Townsend 2005). Differential loss will result in a
relatively high level of divergence at the sequence level. In this study, the high proportion of translocated genes in recently acquired genes holds true even when the cutoff threshold for ortholog identification is very restrictive (up to 80% of protein identity). This supports the robustness of the concept that translocation tends to take place in recently acquired genes.
It is possible that some orthologous pairs detected in this study might be due to gene replacement via LGT. First, a distantly related gene copy could be introduced into a different location of the genome (lineage) and the original copy in the genome is deleted during evolution. This is the case of xenologous gene displace-ment. Second, it is also possible that the distantly related gene copy could be introduced to the same location of a genome and replace the original copy. This is known as gene displacement in situ (Omelchenko et al.2003). Third, it is possible that a distinct gene is introduced into one lineage and then laterally transferred to another lineage. The first scenario is similar to the case of differential loss after duplication. In Figure 5, B and C, we have excluded genes with exceptionally large DNA distance by comparing slightly more distantly related strains. The trends are consistent in both cases, even though no significantP-values were obtained in Figure 5B, which might be due to the small number of genes in comparison. The second scenario does not result in gene translocation since the diverged copy just replaced the original copyin situ. In fact, some genes were found
Figure8.—Proportion of genes on the leading strand
asso-ciated with phylogenetic depths. (A) Distribution of clade-specific genes at different phylogenetic depths in the Bc group (n0 ¼ 426, n1 ¼ 368, n2 ¼ 101, n3 ¼ 79, n4 ¼ 20,
to have conserved gene order but have significant levels of sequence divergence (data not shown). The third scenario is difficult to distinguish from gene trans-location. The likelihood of two successive transfers of one gene should be low, since closely related genomes are usually diverged due to niche separation but gene transfers are likely to take place among organisms that live in similar niches ( Jainet al.2003). Furthermore, the B types of genes in Figure 5 are not very likely subject to successive transfers because of their presence in a broader spectrum of genomes, and they also show a higher proportion of translocated genes than nonspe-cific genes (Figure 5B). Therefore, successive transfer events, if they happen, would not alter the conclusion that recently acquired genes tend to be translocated.
The evolution of translocated genes: Besides the high frequency of gene translocation in recently trans-ferred genes, this study reveals that translocated genes undergo faster rates of evolution compared with posi-tionally conserved genes (Figure 3). Since translocated genes are under faster rates of evolution than position-ally conserved genes, when more restrictive cutoff thresholds are used in identifying orthologs, the num-ber of identified translocated genes might decrease more dramatically than that of positionally conserved genes, which results in a decrease in the proportion of translocated genes with more restrictive cutoffs (Figures 4 and 5). Indeed, a fast rate of evolution has been reported to result in a failure to detect homologs in similarity searches (Haoand Golding2006a).
Previous studies have suggested that many recently transferred genes tend to be deleted rapidly (Haoand
Golding 2004, 2006b). Gene translocations tend to
take place in recently transferred genes that tend to be deleted rapidly; as a consequence, gene transloca-tion should be considered as a local phenomenon. Indeed, relatively high rates of gene rearrangements have been found in closely related Salmonella strains (Liuand Sanderson1998; Liuet al.2003; Kothapalli et al. 2005), whereas the genome structures between Escherichia coli and Salmonella remain highly similar
(Krawiecand Riley1990; Liuet al.1993). Furthermore,
most truncated genes were found in translocated genes and the proportion of truncated genes is much higher in translocated genes than in positionally conserved genes (Figure 5). This holds true in all four genome pairs (data not shown). In other words, after being translocated, many genes tend to be deleted rapidly.
Compared with ancient genes, recently transferred genes were shown to be under relaxed functional constraints and translocated genes might be under more relaxed functional constraints (Ka/Ksratios, Fig-ure 3). It is plausible that genes under relaxed con-straints are more likely to be translocated and tend to change more freely or even be deleted due to these relaxed functional constraints. On the other hand, some gene translocations might be considered as
adaptive. The host with translocated genes might be able to adapt to a new niche faster than if it depended solely on substitution. Indeed, it has been shown that large-scale genome rearrangements, such as gene in-version and gene translocation, alter gene expression
(Brinig et al. 2006) and might play roles in niche
adaptation (Colsonet al.2004; Kuwaharaet al.2004; Burgetzet al.2006; Colemanet al.2006; Liuet al.2006). The occurrence of gene translocation seems to be influenced by gene function. The distribution of COG classification was compared between translocated genes and positionally conserved genes (see Figure S4). A significant difference in distribution was observed in BlBp, BamBs, and BwBc4. Gene translocation is gener-ally rare in genes involved in translation, ribosomal structure, and biogenesis (‘‘J’’ class), while gene trans-location is more common in genes involved in carbo-hydrate transport and metabolism (‘‘G’’ class) and amino acid transport and metabolism (‘‘E’’ class) and in genes not included in COG (‘‘’’ class inFigure S4). In other words, besides the elevated evolutionary rates, translocated genes have a biased distribution of func-tional classification. This finding is a snapshot of the evolutionary process with the presence of selection. Gene translocation has deleterious effects on genes, and translocation that occurred in ancient genes or func-tionally essential genes is likely strongly deleterious, while translocation that has occurred in recently ac-quired genes is likely less deleterious or might be adaptive. Adaptive translocations are likely to be re-tained and slightly deleterious translocations could be retained in a population for some period of time, while strongly deleterious translocations should be extremely rare. The fate of many translocated genes in recently acquired genes is to be eliminated during evolution. Therefore, gene translocation serves as a factor that speeds up the turnover of laterally transferred genes.
Genes distributed on the leading strand: Genes on the leading strand were examined but different pictures were obtained at different levels of comparison. A large-scale comparison shows that ancient genes are more likely on the leading strand than group-specific genes (Figure 7). The proportion of genes on the leading strand is higher in genes universally present in all Bacillaceae genomes and further inflated in the universal genes in Bacillaceae also present in Listeria genomes (data not shown). A similar pattern has been found by Fanget al. (2005). The high proportion of genes on the leading strand in ancient genes is likely due to their functional essentiality, since essential genes tend to be on the leading strand (Rochaand Danchin 2003).
are coded on the leading strand (Campbell 2002). Genes associated with prophages do show a higher proportion of being on the leading strand (Table S5) and the most recently acquired class n5 has a signifi-cantly higher proportion of genes associated with prophages (Table S4). However, the removal of genes associated with ISs and prophages resulted in little change of the trend. One possible explanation is that recently acquired genes are of phage origin but have become difficult to identify. Indeed, most of the recently acquired genes have features similar to genes in lamb-doid phages (Daubinet al.2003a). Another possibility is that some foreign genes are from some nonphage sources, but like lambdoid phages, they also tend to be inserted into the leading strand of the host genome. The high proportion of newly transferred genes on the leading strand could also be explained by the fact that transfers to the lagging strand are likely less successful. The substantial difference between the large-scale com-parison and the fine-scale comcom-parison is that, in the short term, gene translocation is likely neutral or nearly neutral, whereas, in the long term, gene translocation could be deleterious and selected against.
It has been shown that genes evolve faster after shifting from one replicating strand to the other due to mutational biases (Tillier and Collins 2000b; Rocha and Danchin 2001). We have examined the translocated genes that shifted strand, but no significant difference in DNA distance was found between genes that shifted strand and those that did not shift strand (seeFigure S5). The trend, though not significant, that translocated genes that shifted strand evolve faster than those that did not shift strand was observed in BlBp and BamBs. It is possible that the test lacks statistical power due to the small number of translocated genes. Impor-tantly, translocated genes that did not shift strand have shown a significantly larger distance than positionally conserved genes. This suggests that the elevated rate of evolution in translocated genes is not mainly due to mutational bias after shifting strand.
Gene translocation mechanisms:Genome rearrange-ment can be the result of a number of specific molecular mechanisms (Arber 2003), initiated or aided by pro-phage, IS elements, and site-specific recombination. Prophages have been well documented to play an important role in large-scale genome rearrangements
(Canchayaet al.2004), and quite often prophages are
associated with insertions of a number of novel sequen-ces (Ivanovaet al.2003). Translocated genes identified in this study tend to be spatially dispersed rather than clustered together (Figure 2,Figure S6, andFigure S7). Therefore, bacterial phages might play a role in trans-location of several genes in a cluster, but it is not likely the main driving force for individual gene translocation during evolution.
Mobile elements (IS elements) have been known to play an important role in extensive genome
rearrange-ment, such as in Bordetella (Briniget al.2006). In this study, the results are robust even after excluding genes associated with ISs and prophages. However, the possi-bility that IS elements are involved in gene translocation cannot be ruled out since most of the IS elements in genomes are evolutionarily young and under fast rates of turnover (Siguier et al. 2006a; Wagner 2006a,b;
Touchon and Rocha 2007). It has been shown that
elements involved in gene transfer have undergone a decay process (Sirand-Pugnetet al.2007). Similarly, it might be possible that IS elements involved in gene translocation in this study have been deleted during evolution.
Site-specific recombination has also been reported to be involved in lateral gene transfer and deletion in bacterial genome evolution (Gillings et al. 2005;
MacDonald et al. 2006). Furthermore, short
palin-dromic sequences (Lewiset al.1999; Tobesand Pareja 2006) or short signature sequences (Robins et al. 2005) have been suggested to serve as a source of recombination sites for gene movement. However, detection of recombination sites requires more exper-imental evidence.
Conclusion: We have uncovered significant associa-tions between gene translocation and lateral gene transfer. Translocated genes have accelerated rates of evolution and gene translocation tends to be observed in recently acquired genes. Many translocated genes undergo gene truncation and will ultimately be deleted from the genome. Furthermore, there is a strong leading strand bias of lateral gene transfer and in the course of evolution the strand bias of the laterally transferred genes will be influenced by gene trans-location and many other factors. In conclusion, gene translocation plays an important role in shaping the evolution of laterally transferred genes.
The authors thank the reviewers for many useful suggestions. This work was supported by a Natural Sciences and Engineering Research Council of Canada grant to G.B.G.
LITERATURE CITED
Altschul, S. F., T. L. Madden, A. A. Schffer, J. Zhang, Z. Zhanget al., 1997 Gapped BLAST and PSI-BLAST: a new generation of pro-tein database search programs. Nucleic Acids Res.25:3389–3402. Arber, W., 2003 Elements for a theory of molecular evolution. Gene
317:3–11.
Belda, E., A. Moyaand F. J. Silva, 2005 Genome rearrangement distances and gene order phylogeny in gamma-proteobacteria. Mol. Biol. Evol.22:1456–1467.
Berg, O. G., and C. G. Kurland, 2002 Evolution of microbial ge-nomes: sequence acquisition and loss. Mol. Biol. Evol. 19:
2265–2276.
Brinig, M. M., C. A. Cummings, G. N. Sanden, P. Stefanelli, A. Lawrenceet al., 2006 Significant gene order and expression differences in Bordetella pertussis despite limited gene content variation. J. Bacteriol.188:2375–2382.
Canchaya, C., G. Fournousand H. Brussow, 2004 The impact of prophages on bacterial chromosomes. Mol. Microbiol.53:9–18. Coleman, M. L., M. B. Sullivan, A. C. Martiny, C. Steglich, K. Barryet al., 2006 Genomic islands and the ecology and evo-lution ofProchlorococcus.Science311:1768–1770.
Colson, I., D. Delneriand S. G. Oliver, 2004 Effects of reciprocal chromosomal translocations on the fitness ofSaccharomyces cerevi-siae.EMBO Rep.5:392–398.
Daubin, V., E. Leratand G. Perriere, 2003a The source of laterally transferred genes in bacterial genomes. Genome Biol.4:R57. Daubin, V., N. A. Moranand H. Ochman, 2003b Phylogenetics and
the cohesion of bacterial genomes. Science301:829–832. Edgar, R. C., 2004 MUSCLE: multiple sequence alignment with
high accuracy and high throughput. Nucleic Acids Res. 32:
1792–1797.
Eisen, J. A., 2000 Assessing evolutionary relationships among mi-crobes from whole-genome analysis. Curr. Opin. Microbiol. 3:
475–480.
Fang, G., E. Rochaand A. Danchin, 2005 How essential are non-essential genes? Mol. Biol. Evol.22:2147–2156.
Felsenstein, J., 1989 PHYLIP (phylogeny inference package). Ver-sion 3.2. Cladistics5:164–166.
Fraser-Liggett, C. M., 2005 Insights on biology and evolution from microbial genome sequencing. Genome Res. 15:1603– 1610.
Garcia-Vallve´, S., A. Romeuand J. Palau, 2000 Horizontal gene transfer in bacterial and archaeal complete genomes. Genome Res.10:1719–1725.
Gillings, M. R., M. P. Holley, H. W. Stokesand A. J. Holmes, 2005 Integrons inXanthomonas: a source of species genome di-versity. Proc. Natl. Acad. Sci. USA102:4419–4424.
Gogarten, J. P., and J. P. Townsend, 2005 Horizontal gene transfer, genome innovation and evolution. Nat. Rev. Microbiol.3:679– 687.
Gu, Z., D. Nicolae, H. H. Luand W. H. Li, 2002 Rapid divergence in expression between duplicate genes inferred from microarray data. Trends Genet.18:609–613.
Hao, W., and G. B. Golding, 2004 Patterns of bacterial gene move-ment. Mol. Biol. Evol.21:1294–1307.
Hao, W., and G. B. Golding, 2006a Asymmetrical evolution of cy-tochromebdsubunits. J. Mol. Evol.62:132–142.
Hao, W., and G. B. Golding, 2006b The fate of laterally transferred genes: life in the fast lane to adaptation or death. Genome Res.
16:636–643.
Hao, W., and G. B. Golding, 2008a High rates of lateral gene trans-fer are not due to false diagnosis of gene absence. Gene421:
27–31.
Hao, W., and G. B. Golding, 2008b Uncovering rate variation of lateral gene transfer during bacterial genome evolution. BMC Genomics9:235.
Hirsh, A. E., and H. B. Fraser, 2001 Protein dispensability and rate of evolution. Nature411:1046–1049.
Ivanova, N., A. Sorokin, I. Anderson, N. Galleron, B. Candelon et al., 2003 Genome sequence ofBacillus cereusand comparative analysis withBacillus anthracis.Nature423:87–91.
Jain, R., M. C. Rivera, J. E. Mooreand J. A. Lake, 2003 Horizontal gene transfer accelerates genome innovation and evolution. Mol. Biol. Evol.20:1598–1602.
Kothapalli, S., S. Nair, S. Alokam, T. Pang, R. Khakhriaet al., 2005 Diversity of genome structure in Salmonella enterica serovar Typhi populations. J. Bacteriol.187:2638–2650. Krawiec, S., and M. Riley, 1990 Organization of the bacterial
chro-mosome. Microbiol. Rev.54:502–539.
Kunin, V., and C. A. Ouzounis, 2003 The balance of driving forces during genome evolution in prokaryotes. Genome Res.13:1589– 1594.
Kuwahara, T., A. Yamashita, H. Hirakawa, H. Nakayama, H. Toh et al., 2004 Genomic analysis ofBacteroides fragilisreveals exten-sive DNA inversions regulating cell surface adaptation. Proc. Natl. Acad. Sci. USA101:14919–14924.
Lathe, 3rd, W. C., and P. Bork, 2001 Evolution oftufgenes: ancient duplication, differential loss and gene conversion. FEBS Lett.
502:113–116.
Lewis, S., E. Akgunand M. Jasin, 1999 Palindromic DNA and ge-nome stability. Further studies. Ann. N Y Acad. Sci.870:45–57.
Lima-Mendez, G., J. Van Helden, A. Toussaint and R. Leplae, 2008 Prophinder: a computational tool for prophage predic-tion in prokaryotic genomes. Bioinformatics24:863–865. Liu, G. R., K. Edwards, A. Eisenstark, Y. M. Fu, W. Q. Liuet al.,
2003 Genomic diversification among archival strains of Salmo-nella enterica serovar typhimuriumLT7. J. Bacteriol.185:2131–2142. Liu, G. R., W. Q. Liu, R. N. Johnston, K. E. Sanderson, S. X. Liet al., 2006 Genome plasticity and ori-ter rebalancing in Salmonella typhi.Mol. Biol. Evol.23:365–371.
Liu, S. L., and K. E. Sanderson, 1998 Homologous recombination betweenrrnoperons rearranges the chromosome in host-special-ized species ofSalmonella.FEMS Microbiol. Lett.164:275–281. Liu, S. L., A. Hesseland K. E. Sanderson, 1993 Genomic mapping
with I–Ceu I, an intron-encoded endonuclease specific for genes for ribosomal RNA, inSalmonellaspp.,Escherichia coli, and other bacteria. Proc. Natl. Acad. Sci. USA90:6874–6878.
Lobry, J. R., 1996 Asymmetric substitution patterns in the two DNA strands of bacteria. Mol. Biol. Evol.13:660–665.
Lynch, M., and A. Force, 2000 The probability of duplicate gene preservation by subfunctionalization. Genetics154:459–473. Lynch, M., M. O’Hely, B. Walshand A. Force, 2001 The
proba-bility of preservation of a newly arisen gene duplicate. Genetics
159:1789–1804.
MacDonald, D., G. Demarre, M. Bouvier, D. Mazeland D. N. Gopaul, 2006 Structural basis for broad DNA-specificity in in-tegron recombination. Nature440:1157–1162.
Mirkin, B. G., T. I. Fenner, M. Y. Galperin and E. V. Koonin, 2003 Algorithms for computing parsimonious evolutionary sce-narios for genome evolution, the last universal common ancestor and dominance of horizontal gene transfer in the evolution of prokaryotes. BMC Evol. Biol.3:2.
Morton, R. A., and B. R. Morton, 2007 Separating the effects of mutation and selection in producing DNA skew in bacterial chro-mosomes. BMC Genomics8:369.
Nielsen, K. M., and J. P. Townsend, 2004 Monitoring and model-ing horizontal gene transfer. Nat. Biotechnol.22:1110–1114. Novozhilov, A. S., G. P. Karevand E. V. Koonin, 2005
Mathe-matical modeling of evolution of horizontally transferred genes. Mol. Biol. Evol.22:1721–1732.
Ochman, H., and I. B. Jones, 2000 Evolutionary dynamics of full genome content inEscherichia coli.EMBO J.19:6637–6643. Omelchenko, M. V., K. S. Makarova, Y. I. Wolf, I. B. Rogozinand
E. V. Koonin, 2003 Evolution of mosaic operons by horizontal gene transfer and gene displacementin situ.Genome Biol.4:
R55.
R DevelopmentCoreTeam, 2008 R: A Language and Environment for Statistical Computing.R Foundation for Statistical Computing, Vienna.
Robins, H., M. Krasnitz, H. Barak and A. J. Levine, 2005 A relative-entropy algorithm for genomic fingerprinting captures host-phage similarities. J. Bacteriol.187:8370–8374.
Rocha, E. P., 2004 Order and disorder in bacterial genomes. Curr. Opin. Microbiol.7:519–527.
Rocha, E. P., and A. Danchin, 2001 Ongoing evolution of strand composition in bacterial genomes. Mol. Biol. Evol.18:1789–1799. Rocha, E. P., and A. Danchin, 2003 Gene essentiality determines chromosome organisation in bacteria. Nucleic Acids Res. 31:
6570–6577.
Rogozin, I. B., K. S. Makarova, Y. I. Wolf and E. V. Koonin, 2004 Computational approaches for the analysis of gene neigh-bourhoods in prokaryotic genomes. Brief. Bioinform.5:131–149. Sankoff, D., D. Bryant, M. Deneault, B. F. Langand G. Burger, 2000 Early eukaryote evolution based on mitochondrial gene order breakpoints. J. Comput. Biol.7:521–535.
Siguier, P., J. Fileeand M. Chandler, 2006a Insertion sequences in prokaryotic genomes. Curr. Opin. Microbiol.9:526–531. Siguier, P., J. Perochon, L. Lestrade, J. Mahillon and M.
Chandler, 2006b ISfinder: the reference centre for bacterial insertion sequences. Nucleic Acids Res.34:D32–D36.
Sirand-Pugnet, P., C. Lartigue, M. Marenda, D. Jacob, A. Barre et al., 2007 Being pathogenic, plastic, and sexual while living with a nearly minimal bacterial genome. PLoS Genet.3:e75. Strimmer, K., and A.vonHaeseler, 1996 Quartet puzzling: a
Tamames, J., 2001 Evolution of gene order conservation in prokar-yotes. Genome Biol.2:RESEARCH0020.
Tatusov, R. L., M. Y. Galperin, D. A. Nataleand E. V. Koonin, 2000 The COG database: a tool for genome-scale analysis of protein functions and evolution. Nucleic Acids Res.28:33–36. Tillier, E. R., and R. A. Collins, 2000a Genome rearrangement by
replication-directed translocation. Nat. Genet.26:195–197. Tillier, E. R., and R. A. Collins, 2000b Replication orientation
af-fects the rate and direction of bacterial gene evolution. J. Mol. Evol.51:459–463.
Tobes, R., and E. Pareja, 2006 Bacterial repetitive extragenic palin-dromic sequences are DNA targets for insertion sequence ele-ments. BMC Genomics7:62.
Touchon, M., and E. P. Rocha, 2007 Causes of insertion se-quences abundance in prokaryotic genomes. Mol. Biol. Evol.
24:969–981.
Wagner, A., 2006a Cooperation is fleeting in the world of transpos-able elements. PLoS Comput. Biol.2:e162.
Wagner, A., 2006b Periodic extinctions of transposable elements in bacterial lineages: evidence from intragenomic variation in mul-tiple genomes. Mol. Biol. Evol.23:723–733.
Wagner, A., C. Lewisand M. Bichsel, 2007 A survey of bacterial insertion sequences using IScan. Nucleic Acids Res.35:5284– 5293.
Yang, Z., 2007 PAML 4: phylogenetic analysis by maximum likeli-hood. Mol. Biol. Evol.24:1586–1591.
Yang, Z., and R. Nielsen, 2000 Estimating synonymous and nonsy-nonymous substitution rates under realistic evolutionary models. Mol. Biol. Evol.17:32–43.
Zhang, P., Z. Guand W. H. Li, 2003 Different evolutionary patterns between young duplicate genes in the human genome. Genome Biol.4:R56.
Supporting Information
http://www.genetics.org/cgi/content/full/genetics.109.104216/DC1
Does Gene Translocation Accelerate the Evolution
of Laterally Transferred Genes?
Weilong Hao and G. Brian Golding
W. Hao and G. B. Golding 2 SI
FIGURE S1.—Histogram of protein identity in each genome pair. From the most diverse to the least diverse, the genome pairs are BlBp, BamBs, BwBc4, and Bc2Bc3. The lower end of 95%
confidence interval on protein identity for each pair is 38.1, 52.1, 58.5, 80.1 respectively.
0 100 200 300 400 500 600 700
20 30 40 50 60 70 80 90 100
Frequency
Protein identity
38.1
52.158.5
80.1 BlBp
W. Hao and G. B. Golding 3 SI
FIGURE S2.—Fraction of homolgous sequences that do not have a perfect match length in a BLASTN search using different cutoffs for E-values. Genes associated with ISs and prophages were excluded. DNA sequences of annotated genes from the Bc4 genome were used as query sequences to search against the Bw genome (the BLASTN parameters are “-r 5 -q -4 -W 7 -G 8 -E 6”). A, positionally conserved genes; B, translocated genes.
A
0
20
40
60
80
100
0
10
20
30
40
50
60
70
80
90
100
Frequency (%)
Match length (in percentage)
10
-0510
-1010
-1510
-20B
0
20
40
60
80
100
0
10
20
30
40
50
60
70
80
90
100
Frequency (%)
Match length (in percentage)
10
-0510
-1010
-15W. Hao and G. B. Golding 4 SI
FIGURE S3.—Distribution of ISs and genes acquired at different evolutionary time in the Ba1 genome. Genome coordinate
starts from ori and increases clockwise. The outermost circle represents the location of prophage, and the second outermost circle represents the location of ISs. The number of genes associated with ISs and prophages is given in Table S4.
ori
ISs n5 n4 n3 n2
W. Hao and G. B. Golding 5 SI
FIGURE S4.—Functional classification of positionally conserved and translocated genes. Functional categories were following the COG classification. One genome as representive from each genome pair was shown, they are %The representive genomes are Bp for BlBp (A, B), Bs for BamBs (C, D), Bc4 for BwBc$_4$ (E, F), and Bc3 for Bc2Bc3 (G, H). In each genome, difference in
distribution between positionally conserved and translocated genes was tested in a χ2-test, and P values are shown (N/S for not
significant). Description for each COG category: ‘J’- Translation, ribosomal structure and biogenesis; ‘K’- Transcription; ‘L’- Replication, recombination and repair; ‘B’- Chromatin structure and dynamics; ‘D’- Cell cycle control, cell division, chromosome partitioning; ‘V’- Defense mechanisms; ‘T’- Signal transduction mechanisms; ‘M’- Cell wall/membrane/envelope biogenesis; ‘N’- Cell motility; ‘W’- Extracellular structures; ‘U’- Intracellular trafficking, secretion, and vesicular transport; ‘O’- Posttranslational modification, protein turnover, chaperones; ‘C’- Energy production and conversion; ‘G’- Carbohydrate transport and
metabolism; ‘E’- Amino acid transport and metabolism; ‘F’- Nucleotide transport and metabolism; ‘H’- Coenzyme transport and metabolism; ‘I’- Lipid transport and metabolism; ‘P’- Inorganic ion transport and metabolism; ‘Q’- Secondary metabolites biosynthesis, transport and catabolism; ‘R’- General function prediction only; ‘S’- Function unknown; ‘-’- Not in COG.
A
0 50 100 150 200 250 300J K L B D V T M N W U O C G E F H I P Q R S
-Number of Genes P=2.8x10-09
Conserved Translocated
B
0 5 10 15 20 25 30 35 40J K L B D V T M N W U O C G E F H I P Q R S
-Percentage of Genes
Conserved Translocated
C
0 50 100 150 200 250 300 350 400J K L B D V T M N W U O C G E F H I P Q R S
-Number of Genes P=0.047
Conserved Translocated
D
0 5 10 15 20 25 30J K L B D V T M N W U O C G E F H I P Q R S
-Percentage of Genes
Conserved Translocated
E
0 50 100 150 200 250 300 350 400 450J K L B D V T M N W U O C G E F H I P Q R S
-Number of Genes P=0.036
Conserved Translocated
F
0 5 10 15 20 25 30 35 40 45J K L B D V T M N W U O C G E F H I P Q R S
-Percentage of Genes
Conserved Translocated
G
0 100 200 300 400 500 600 700J K L B D V T M N W U O C G E F H I P Q R S
-Number of Genes N/S
Conserved Translocated
H
0 10 20 30 40 50 60J K L B D V T M N W U O C G E F H I P Q R S
-Percentage of Genes
W. Hao and G. B. Golding 6 SI
FIGURE S5.—DNA distance (A, BlBp; B, BamBs; C, BwBc4; D, Bc2Bc3) by separating translocated genes into
two categories; one has changed strand in translocation (‘diff’), the other did not change strand in translocation (‘same’). No significant difference in DNA distance was detected between the ‘same’ and ‘diff’ translocated genes, while translocated genes that did not change strand still show larger distance than positional conserved genes (‘cons’).
A
!"#$ $%&' ()** !"#$ $%&' ()**
+,-.,+
.,-/012()$3%#!'
34%#$5"!%3'(
#"#6! 6!
34%#$5"!%3'(
*
78.,+9.+
*
7:.,+9.+!;
!;
B
!"#$ $%&' ()** !"#$ $%&' ()**
+,+
+,<
+,=
+,>
+,?
.,+
/012()$3%#!'
34%#$5"!%3'(
#"#6! 6!
34%#$5"!%3'(
*
78+,+<<C
!"#$ $%&' ()** !"#$ $%&' ()**
+,+
+,.
+,<
+,@
+,=
+,-+,>
/012()$3%#!'
34%#$5"!%3'(
#"#6! 6!
34%#$5"!%3'(
*
78+,+++<
D
!"#$ $%&' ()** !"#$ $%&' ()**
+,++
+,+-+,.+
+,.-+,<+
+,<-/012()$3%#!'
34%#$5"!%3'(
#"#6! 6!
W. Hao and G. B. Golding 7 SI
FIGURE S6.—Distribution of translocated genes and ISs in the Bc group. The outermost circle represents the location of prophage, and the second outermost circle represents the location of ISs. The innermost circle represents the Bc specific translocated genes, and the second innermost circle represents the non specific translocated genes. There is no evidence that translocated genes are associated with IS elements. In Bw and Bc4, two Bc specific translocated genes and three non-Bc
translocated genes are associated with prophage.
ori
ori
ori
ori
Bc3
Bc4
Bc2
Bw
n=19n=3 n=3
n=19
n=3 n=3
W. Hao and G. B. Golding 8 SI
FIGURE S7.—Distribution of translocated genes and ISs in the Bp group. The outermost circle represents the location of prophage, and the second outermost circle represents the location of ISs. The innermost circle represents the Bp specific translocated genes, and the second innermost circle represents the non specific translocated genes. No genes are associated with IS elements in Bam and Bs genomes and only one gene pair is associated with IS elements in both Bl and Bp genomes. In Bl and Bp, two Bp specific translocated genes and 17 non-Bp translocated genes are associated with prophage.
ori
ori
ori
Bs
Bp
Bam
Bl
ori
n=38 n=38
n=93 n=93
n=10 n=10
W. Hao and G. B. Golding 9 SI
TABLE S1
W. Hao and G. B. Golding 10 SI
TABLE S2
Proportion of genes on the leading strand in different genome pairs
W. Hao and G. B. Golding 11 SI
TABLE S3
Multivariate analysis of variance (MANOVA) test results using Wilks’ λ
W. Hao and G. B. Golding 12 SI
TABLE S4
W. Hao and G. B. Golding 13 SI
TABLE S5
Leading strand bias in genes associated with prophage