DOI: 10.1534/genetics.107.072553
Origin and Evolution of Human microRNAs From Transposable Elements
Jittima Piriyapongsa,* Leonardo Marin
˜o-Ramı´rez
†and I. King Jordan*
,1*School of Biology, Georgia Institute of Technology, Atlanta, Georgia 30332 and†National Center for Biotechnology Information, National Institutes of Health, Bethesda, Maryland 20894
Manuscript received February 23, 2007 Accepted for publication April 12, 2007
ABSTRACT
We sought to evaluate the extent of the contribution of transposable elements (TEs) to human microRNA (miRNA) genes along with the evolutionary dynamics of TE-derived human miRNAs. We found 55 experimentally characterized human miRNA genes that are derived from TEs, and these TE-derived miRNAs have the potential to regulate thousands of human genes. Sequence comparisons revealed that TE-derived human miRNAs are less conserved, on average, than non-derived miRNAs. However, there are 18 TE-derived miRNAs that are relatively conserved, and 14 of these are related to the ancient L2 and MIR families. Comparison of miRNAvs. mRNA expression patterns for TE-derived miRNAs and their putative target genes showed numerous cases of anti-correlated expression that are consistent with regulation via mRNA degradation. In addition to the known human miRNAs that we show to be derived from TE sequences, we predict an additional 85 novel TE-derived miRNA genes. TE sequences are typically disregarded in genomic surveys for miRNA genes and target sites; this is a mistake. Our results indicate that TEs provide a natural mechanism for the origination miRNAs that can contribute to regulatory divergence between species as well as a rich source for the discovery of as yet unknown miRNA genes.
M
ICRORNAS (miRNAs) are small, 22-nt-long, noncoding RNAs that regulate gene expression(Ambros 2004). In animals, miRNA genes are
tran-scribed into primary miRNAs (pri-miRNAs) and processed by Drosha to yield70- to 90-nt pre-miRNA transcripts that form hairpin structures. Mature miRNAs are liber-ated from these longer hairpin structures by the RNase III enzyme Dicer (Bartel2004). Drosha acts in the nu-cleus, cleaving the pri-miRNA near the base of the hairpin stem to yield the pre-miRNA sequence. The pre-miRNA is then exported to the cytoplasm where the stem is cleaved by Dicer to produce a miRNA duplex. One strand of this duplex is rapidly degraded and only the mature22-nt miRNA sequence remains. The mature miRNA associates with the RNA-induced silencing complex (RISC), and together the miRNA–RISC targets mRNAs for regula-tion. miRNA target specificity is determined by partial complementarity with the 39-untranslated region (UTR) sequence of the mRNA, and regulation is achieved by translational repression and/or mRNA degrada-tion. miRNAs have been implicated in a variety of func-tions, including developmental timing (Leeet al. 1993; Reinhart et al. 2000), apoptosis (Brennecke et al. 2003), and hematopoetic differentiation (Chen et al. 2004).
miRNAs were first discovered inCaenorhabditis elegans through genetic analysis of developmental mutants
(Lee et al. 1993). The small RNA product of the lin-4 gene was found to negatively regulatelin-14expression via interaction with a complementary region in the lin-1439-UTR. This system appeared to be unique until a second example of a similar small regulatory RNA inC. elegans,let-7, was discovered 7 years later (Reinhartet al. 2000). Shortly thereafter,let-7homologs and transcripts were detected among a phylogenetically diverse set of animals (Pasquinelliet al. 2000). The realization that miRNAs represent a distinct, coherent, and abundant class of regulatory genes was finally crystallized in 2001 with the publication of three back-to-back articles in Science, reporting the discovery of numerous novel miRNA genes (Lagos-Quintanaet al. 2001; Lauet al. 2001; Leeand Ambros2001). These articles introduced the term miRNA to refer to all small RNAs with similar genomic features but unknown functions, and miRNAs have now been found in all metazoans surveyed for their presence (Bartel2004).
Given their relatively recent discovery and character-ization, a number of open questions concerning the function and evolution of miRNAs remain. In particu-lar, the evolutionary origins of miRNAs are not well ap-preciated. For instance, many miRNA genes were found to be evolutionarily conserved and this was thought to be a general characteristic of miRNAs. However, a number of nonconserved miRNAs have been recently discovered (Bentwichet al. 2005). The extent to which miRNA genes evolve as paralogous gene families is also unknown. Even the upper bound on the number of miRNA genes encoded by any given genome is not 1Corresponding author:School of Biology, Georgia Institute of
Technol-ogy, 310 Ferst Dr., Atlanta, GA 30332-0230. E-mail: [email protected]
known (Berezikovet al. 2006), and the number of new entries in the miRBase registry of miRNA genes con-tinues to grow steadily (Griffiths-Joneset al. 2006).
We sought to evaluate the contribution of transposable elements (TEs) to the origin and evolution of human miRNA genes. Another class of regulatory RNAs, small interfering RNAs (siRNAs), are known to be related to TEs. Interestingly, this has been pointed out as a distinction between miRNAs and siRNAs, which are closely related in terms of structure, function, and biogenesis. As opposed to siRNAs, miRNAs were thought to derive from loci distinct from other genes or TEs (Bartel2004). However, several examples of miRNA genes that are derived from TEs have been recently identified (Smalheiserand Torvik2005; Borchertet al. 2006; Piriyapongsaand Jordan2007). We wanted to look at this phenomenon more closely to identify the full extent of human miRNA genes that are related to TEs and to characterize how these genes evolve as well as their regulatory and functional potential.
TEs have several characteristics that make them in-teresting candidates for donating miRNA sequences. First of all, TEs are ubiquitous and abundant genomic sequences. Thus, they could provide for the emergence of paralogous miRNA gene families as well as multiple target sites dispersed throughout the genome. Since TEs tend to be among the most rapidly evolving of all genomic sequences, they may also provide a mechanism for the emergence of lineage-specific miRNA genes that could exert diversifying regulatory effects. Finally, the full contribution of TEs to miRNA sequences is likely to be underestimated due to ascertainment biases. This is because computational methods aimed at the detection of novel miRNAs tend to purposefully exclude TE se-quences (Bentwich et al. 2005; Lindow and Krogh 2005; Namet al. 2005; Liet al. 2006). This is often done for reasons of tractability, but also reflects the widely held notion that TEs are genomic parasites that do not play any functional role for their host species (Doolittle and Sapienza1980; Orgeland Crick1980). However, many studies have identified a variety ways in which TEs have been domesticated (Milleret al. 1992) to provide functions to their hosts (Kidwell and Lisch 2001). These cases include the donation of coding sequences (Volff 2006) as well as numerous instances of TE-derived regulatory sequences (Britten 1996; Jordan et al. 2003;van deLagemaatet al. 2003).
To evaluate the contribution of TEs to human miRNAs, we compared the genomic locations of TEs to the loca-tions of experimentally validated human miRNA sequences reported in the miRBase database (Griffiths-Joneset al. 2006). The evolutionary dynamics of TE-related miRNAs were evaluated by within- and between-genome sequence comparisons. The potential regulatory and functional significance of TE-derived miRNAs was explored by com-bining information on miRNA target-site prediction, ex-pression data for miRNA–mRNA pairs, and gene functional annotations. We also sought to discover putative cases of
novel TE-derived miRNA genes in the human genome throughab initioprediction.
MATERIALS AND METHODS
Detection:Human miRNA sequences and predicted target
sites were taken from version 8.2 of the miRBase database
(Griffiths-Joneset al. 2006). These data do not includeab
initiomiRNA gene predictions. The UCSC Genome Browser (Kentet al. 2002) and Table Browser (Karolchiket al. 2004) tools were used to search for miRNA genes colocated with TEs and to compare the evolutionary rates of miRNA genes. Human miRNA sequences were mapped to the hg18 (NCBI build 36.1) version of the human genome sequence and a generic feature format ‘‘custom track’’ was created (available upon request). Genomic locations of the miRNAs were com-pared to the locations of TEs annotated with the Repeat-Masker program (Smitet al. 1996–2004). For this purpose, precomputed RepeatMasker annotations of hg18 were com-bined with RepeatMasker-determined genomic locations of a set of 96 ‘‘conserved’’ TE families recently added to Repbase ( Jurkaet al. 2005). These conserved consensus sequences correspond to low-copy-number TEs that show anomalously low levels of between-genome orthologous sequence diver-gence and can be found by searching Repbase (http://www. girinst.org/) with the keyword ‘‘conserved.’’
Sequences of TE-derived miRNAs were compared to the human genome sequence using BLAT (Kent2002). The criteria used for genome sequence hits were (1) $80% sequence identity with the query miRNA sequence and (2) the genomic hit region must be$80% and#120% of the length of the miRNA query sequence. The latter requirement was used to ensure that long genomic insertions were not identified as putative paralogous miRNAs.
Evolution: Comparative genomic sequence data from the
UCSC Genome Browser were used to analyze the relative evolutionary rates of human miRNAs. Evolutionary rates were derived from multiple whole-genome sequence alignments between the human and 16 other vertebrate genomes (Kent et al. 2003; Blanchetteet al. 2004). Human miRNA evolu-tionary rates were calculated in two ways: (1) by evaluating the number of conserved sites per miRNA and (2) by evaluating the per-site conservation scores of miRNA sequences. Con-served human genome sites were predicted by the phastCons program, which uses a phylogenetic hidden Markov model to calculate the probabilities of sites being either conserved or nonconserved (Siepelet al. 2005). Conservation scores for human genome sites were also taken from the phastCons analysis of the vertebrate multiple genome sequence align-ment, and these scores correspond to the posterior probability that a site is conserved or nonconserved.
Regulation and function: Human miRNA target-site
Gene ontology (GO) analysis (Ashburneret al. 2000) was done using the GO Tree Machine program (Zhang et al. 2004). GO Tree Machine was used to identify significantly over-represented biological process GO terms from a set of genes predicted to be regulated by a particular miRNA and to plot the location of these GO terms along the GO-directed acyclic graph.
TE–miRNA prediction:TE locations in the human genome
were considered together with the output of the program EvoFold, which combines RNA secondary structure prediction with the evaluation of multiple sequence alignments to iden-tify conserved secondary structures (Pedersen et al. 2006). TE sequences that encode conserved hairpin structures with length$55 bp, a single terminal loop#20bp, and at least six paired bases in the stem region (Bentwichet al. 2005) were chosen for further analysis. For conserved TE-encoded hair-pins of ,55 bp that met all other criteria, the predicted secondary structure sequences were extended manually and rechecked for the ability to form hairpin structures using the program RNAfold from the Vienna RNA package (Hofacker et al. 1994). Sequences that were able to encode hairpins$55 bp after manual extension were chosen for further analysis. The potential for putative TE-derived miRNAs identified in this way to be expressed was evaluated using EST and mRNA data. Our TE–miRNA prediction protocol is represented in supplemental Figure 1 at http://www.genetics.org/supplemental/.
RESULTS
Transposable-element-derived miRNAs:miRBase is an online database of miRNA gene sequences and predicted target sites (Griffiths-Joneset al. 2006); version 8.2 of miRBase contained 462 human miRNA gene sequences. Of these human miRNA genes, 379 are defined on the basis of experimental information, cloning of mature miRNA sequences for the most part, while 83 are predic-tions on the basis of sequence similarity with miRNAs that have been experimentally characterized in related spe-cies. We mapped these human miRNA genes to the com-plete genome sequence and compared their locations to the locations of annotated TEs. A total of 68 human miRNA genes share sequences with TEs, and all but 7 of these correspond to miRNAs experimentally charac-terized from human samples. The absence ofab initio miRNA gene predictions in the miRBase data set ensures that we are uncovering bona fide TE–miRNA relation-ships. Of these TE-related miRNAs, 49 are found in in-tron sequences while 19 are intergenic.
TE-related miRNAs differ in terms of the extent of overlap with TE sequences and the number of distinct TE sequences from which they are derived. For each individual TE-related human miRNA, a schematic in supplemental Figure 2 (at http://www.genetics.org/ supplemental/) illustrates the identity of all colocated TE sequences along with the extent and position of the TE–miRNA overlap and the relationship between the strand-specific orientation of the TE and the miRNA. The majority (50 of 68) of TE-related miRNAs consist of .50% TE-derived positions (Figure 1A), and this figure is likely to be an underestimate since many TE sequen-ces are known to have diverged beyond the ability to be
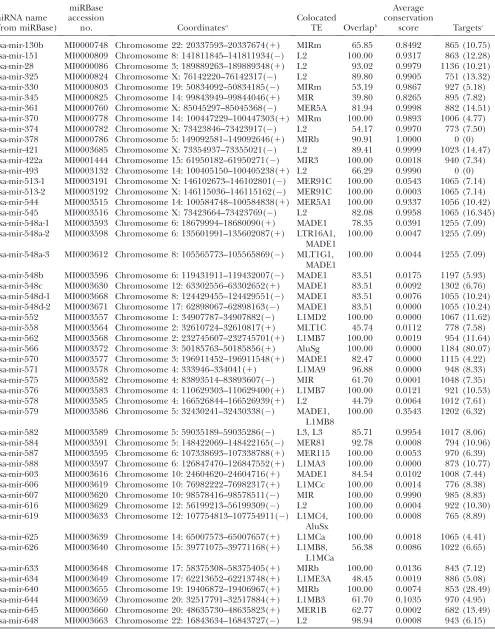
recognized by the RepeatMasker annotation software. The TE–miRNA overlap distribution for the region of the miRNA gene that corresponds to the processed (mature) regulatory sequence is even more bimodal (Figure 1B); 47 sequences have.95% of mature miRNA positions covered by TE sequence. Nevertheless, there are a handful (7 of 68) of TE-related miRNA genes that have ,20% of their sequences colocated with TE se-quence. These may represent spurious cases of TE–miRNA overlap. Visual inspection of the TE–miRNA alignments (supplemental Figure 2 at http://www.genetics.org/ supplemental/) was used to eliminate these unreliable cases. Only the 55 cases with at least 50% TE coverage of the pre-miRNA sequence and/or 100% TE coverage of the mature miRNA sequence were considered as ac-tual TE-derived miRNAs and used for further analysis (Table 1). These 55 TE-derived miRNAs represent12% (55/462) of all human miRNAs reported in miRBase version 8.2.
The TE-related miRNAs that we identified are derived from all four major classes of human TEs: long- and short- interspersed nuclear elements (LINE and SINE), long-terminal-repeat-containing elements (LTR) and DNA-type transposons (Table 1). Specific classes and families of TEs show marked over- or underrepresentation among
Figure 1.—Percentage of TE-derived residues in miRNA
TABLE 1
TE-derived human miRNAs
miRNA name (from miRBase)
miRBase accession
no. Coordinatesa
Colocated
TE Overlapb
Average conservation
score Targetsc
hsa-mir-130b MI0000748 Chromosome 22: 20337593–20337674(1) MIRm 65.85 0.8492 865 (10.75) hsa-mir-151 MI0000809 Chromosome 8: 141811845–141811934() L2 100.00 0.9317 863 (12.28) hsa-mir-28 MI0000086 Chromosome 3: 189889263–189889348(1) L2 93.02 0.9979 1136 (10.21) hsa-mir-325 MI0000824 Chromosome X: 76142220–76142317() L2 89.80 0.9905 751 (13.32) hsa-mir-330 MI0000803 Chromosome 19: 50834092–50834185() MIRm 53.19 0.9867 927 (5.18) hsa-mir-345 MI0000825 Chromosome 14: 99843949–99844046(1) MIR 39.80 0.8265 895 (7.82) hsa-mir-361 MI0000760 Chromosome X: 85045297–85045368() MER5A 81.94 0.9998 882 (14.51) hsa-mir-370 MI0000778 Chromosome 14: 100447229–100447303(1) MIRm 100.00 0.9893 1006 (4.77) hsa-mir-374 MI0000782 Chromosome X: 73423846–73423917() L2 54.17 0.9970 773 (7.50) hsa-mir-378 MI0000786 Chromosome 5: 149092581–149092646(1) MIRb 90.91 1.0000 0 (0) hsa-mir-421 MI0003685 Chromosome X: 73354937–73355021() L2 89.41 0.9999 1023 (14.47) hsa-mir-422a MI0001444 Chromosome 15: 61950182–61950271() MIR3 100.00 0.0018 940 (7.34) hsa-mir-493 MI0003132 Chromosome 14: 100405150–100405238(1) L2 66.29 0.9990 0 (0) hsa-mir-513-1 MI0003191 Chromosome X: 146102673–146102801() MER91C 100.00 0.0543 1065 (7.14) hsa-mir-513-2 MI0003192 Chromosome X: 146115036–146115162() MER91C 100.00 0.0003 1065 (7.14) hsa-mir-544 MI0003515 Chromosome 14: 100584748–100584838(1) MER5A1 100.00 0.9337 1056 (10.42) hsa-mir-545 MI0003516 Chromosome X: 73423664–73423769() L2 82.08 0.9958 1065 (16.345) hsa-mir-548a-1 MI0003593 Chromosome 6: 18679994–18680090(1) MADE1 78.35 0.0391 1255 (7.09) hsa-mir-548a-2 MI0003598 Chromosome 6: 135601991–135602087(1) LTR16A1,
MADE1
100.00 0.0047 1255 (7.09)
hsa-mir-548a-3 MI0003612 Chromosome 8: 105565773–105565869() MLT1G1, MADE1
100.00 0.0044 1255 (7.09)
hsa-mir-548b MI0003596 Chromosome 6: 119431911–119432007() MADE1 83.51 0.0175 1197 (5.93) hsa-mir-548c MI0003630 Chromosome 12: 63302556–63302652(1) MADE1 83.51 0.0092 1302 (6.76) hsa-mir-548d-1 MI0003668 Chromosome 8: 124429455–124429551() MADE1 83.51 0.0076 1055 (10.24) hsa-mir-548d-2 MI0003671 Chromosome 17: 62898067–62898163() MADE1 83.51 0.0000 1055 (10.24) hsa-mir-552 MI0003557 Chromosome 1: 34907787–34907882() L1MD2 100.00 0.0000 1067 (11.62) hsa-mir-558 MI0003564 Chromosome 2: 32610724–32610817(1) MLT1C 45.74 0.0112 778 (7.58) hsa-mir-562 MI0003568 Chromosome 2: 232745607–232745701(1) L1MB7 100.00 0.0019 954 (11.64) hsa-mir-566 MI0003572 Chromosome 3: 50185763–50185856(1) AluSg 100.00 0.0000 1184 (80.07) hsa-mir-570 MI0003577 Chromosome 3: 196911452–196911548(1) MADE1 82.47 0.0000 1115 (4.22) hsa-mir-571 MI0003578 Chromosome 4: 333946–334041(1) L1MA9 96.88 0.0000 948 (8.33) hsa-mir-575 MI0003582 Chromosome 4: 83893514–83893607() MIR 61.70 0.0001 1048 (7.35) hsa-mir-576 MI0003583 Chromosome 4: 110629303–110629400(1) L1MB7 100.00 0.0121 921 (10.53) hsa-mir-578 MI0003585 Chromosome 4: 166526844–166526939(1) L2 44.79 0.0064 1012 (7.61) hsa-mir-579 MI0003586 Chromosome 5: 32430241–32430338() MADE1,
L1MB8
100.00 0.3543 1202 (6.32)
hsa-mir-582 MI0003589 Chromosome 5: 59035189–59035286() L3, L3 85.71 0.9954 1017 (8.06) hsa-mir-584 MI0003591 Chromosome 5: 148422069–148422165() MER81 92.78 0.0008 794 (10.96) hsa-mir-587 MI0003595 Chromosome 6: 107338693–107338788(1) MER115 100.00 0.0053 970 (6.39) hsa-mir-588 MI0003597 Chromosome 6: 126847470–126847552(1) L1MA3 100.00 0.0000 873 (10.77) hsa-mir-603 MI0003616 Chromosome 10: 24604620–24604716(1) MADE1 84.54 0.0102 1008 (7.44) hsa-mir-606 MI0003619 Chromosome 10: 76982222–76982317(1) L1MCc 100.00 0.0014 776 (8.38) hsa-mir-607 MI0003620 Chromosome 10: 98578416–98578511() MIR 100.00 0.9990 985 (8.83) hsa-mir-616 MI0003629 Chromosome 12: 56199213–56199309() L2 100.00 0.0004 922 (10.30) hsa-mir-619 MI0003633 Chromosome 12: 107754813–107754911() L1MC4,
AluSx
100.00 0.0008 765 (8.89)
hsa-mir-625 MI0003639 Chromosome 14: 65007573–65007657(1) L1MCa 100.00 0.0018 1065 (4.41) hsa-mir-626 MI0003640 Chromosome 15: 39771075–39771168(1) L1MB8,
L1MCa
56.38 0.0086 1022 (6.65)
hsa-mir-633 MI0003648 Chromosome 17: 58375308–58375405(1) MIRb 100.00 0.0136 843 (7.12) hsa-mir-634 MI0003649 Chromosome 17: 62213652–62213748(1) L1ME3A 48.45 0.0019 886 (5.08) hsa-mir-640 MI0003655 Chromosome 19: 19406872–19406967(1) MIRb 100.00 0.0074 853 (28.49) hsa-mir-644 MI0003659 Chromosome 20: 32517791–32517884(1) L1MB3 61.70 0.1035 970 (4.95) hsa-mir-645 MI0003660 Chromosome 20: 48635730–48635823(1) MER1B 62.77 0.0002 682 (13.49) hsa-mir-648 MI0003663 Chromosome 22: 16843634–16843727() L2 98.94 0.0008 943 (6.15)
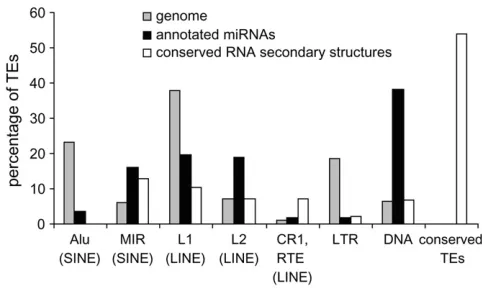
human miRNAs (Figure 2). The related L2 (LINE) and MIR (SINE) families, as well as DNA elements, show far more overlap with miRNA genes than is expected on the basis of their relative frequency in the genome (37 observedvs. 11 expected;x2¼30.74,P¼3.0 3108). Most of the DNA-type elements that contribute to miRNA genes are short nonautonomous derivatives of full-length transposons known as miniature inverted-repeat trans-posable elements (MITEs). This includes a group of seven closely related miRNA genes (hsa-mir-548), which are all derived from the Made1 family of MITEs (Piriyapongsa and Jordan 2007). Alu (SINE) elements and LTR type TEs are generally underrepresented among TE-derived miRNA genes. Most TE-related miRNA genes are derived from a single TE insertion, but there are several examples where nested insertion events have led to the origin of a single miRNA gene from two or even three TEs (supple-mental Figure 2 at http://www.genetics.org/supple(supple-mental/). For instance, there are two cases where a Made1 element inserted into an LTR element yielded a miRNA gene (examples 24 and 27 in supplemental Figure 2 at http:// www.genetics.org/supplemental/), and an insertion of an Alu into a L1 (LINE) sequence also gave rise to a
miRNA gene (example 46 in supplemental Figure 2 at http://www.genetics.org/supplemental/).
TE-derived human miRNA genes were used as queries in BLAT searches against the human genome sequence to search for putative paralogs. There are 19 cases of TE-derived miRNA genes with closely related paralogs in the human genome (Table 2). The number of paralogs per miRNA ranges from 1, for the L1-derived hsa-mir-552, to 145, for the Made1-derived hsa-mir-548d-2.
Evolution of TE-derived miRNAs: Comparative
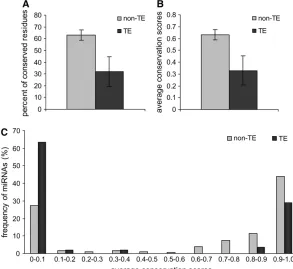
ge-nomic sequence data were used to assess the relative evolutionary rates of TE-derived miRNAs. This analysis was based on whole-genome sequence alignments be-tween humans and 16 other vertebrate species. Two re-lated approaches were used to evaluate the conservation of individual miRNA sequence sites across vertebrate genomes; the first approach results in a binary charac-terization of either conserved or nonconserved for each site, while the second rests on a more continuous score that relates the probability of a site being conserved. All genome sites for human miRNAs were considered using these two metrics, and the relative conservation levels for TE-derived vs. non-TE-derived miRNA genes were compared. A total of 32.1% of sites in TE-derived miRNAs map to the most conserved elements in the human genome. This is far greater than the 5% of conserved sites seen for the entire human genome but significantly less than seen for non-TE-derived miRNAs, which have 63.2% conserved sites (t¼4.39,P¼1.4e-5, Student’st-test) (Figure 3A). When the per-site conser-vation probabilities of human miRNAs were measured, a similar pattern was observed. The average conserva-tion score of TE-derived miRNAs was 0.33 compared to 0.63 for non-TE-derived miRNAs (t¼4.37,P¼1.5e-5, Student’st-test) (Figure 3B). In addition, the frequency distribution of the average conservation scores for all human miRNA genes reveals that, compared to non-TE-derived miRNAs, there are far more TE-non-TE-derived miRNAs that show little or no conservation and fewer that are highly conserved (Figure 3C). Thus, on the whole, TE-derived miRNAs are significantly less conserved than non-TE-derived miRNAs.
TABLE 1
(Continued)
miRNA name (from miRBase)
miRBase
accession no. Coordinatesa
Colocated
TE Overlapb
Average conservation
score Targetsc
hsa-mir-649 MI0003664 Chromosome 22: 19718465–19718561() L1M4, MER8, AluSx
100.00 0.0005 1033 (10.65)
hsa-mir-652 MI0003667 Chromosome X: 109185213–109185310(1) MER91C 100.00 0.9883 803 (39.36) hsa-mir-659 MI0003683 Chromosome 22: 36573631–36573727() Arthur1 46.39 0.0027 890 (8.20) hsa-mir-95 MI0000097 Chromosome 4: 8057928–8058008() L2 95.06 0.9862 847 (16.06)
a
Human genome (hg 18) coordinates of the miRNA. b
Percentage of miRNA overlapping with TE sequence. c
Total number of targets with the percentage derived from TEs in parentheses.
Figure2.—Percentage of TE sequences among different
We used the frequency distribution of average servation scores to divide TE-derived miRNAs into con-served ($0.8 average conservation probability) and nonconserved (,0.8 average conservation probability) groups. Using this criteria, there are 37 nonconserved and 18 conserved TE-derived miRNAs (Table 1). The
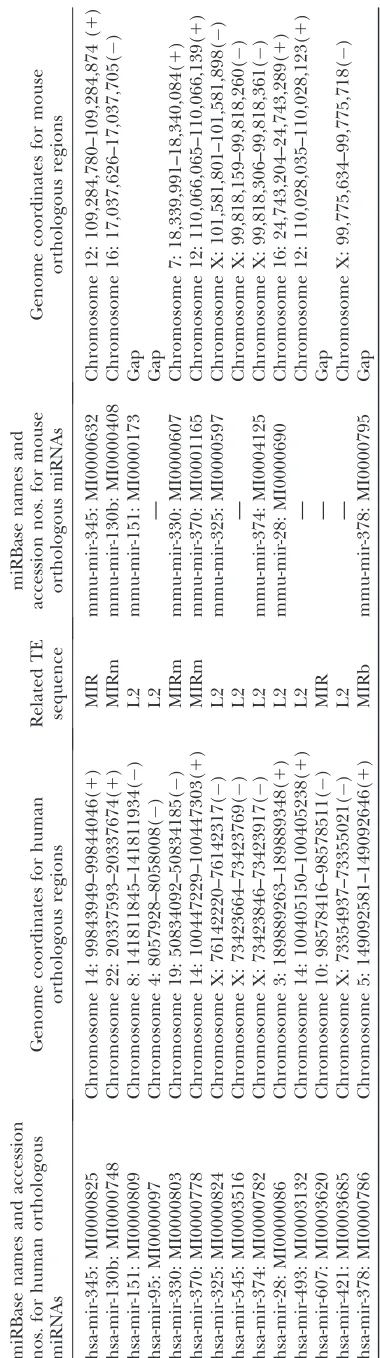
least-conserved TE-derived miRNAs are primate specific, having orthologous sequences in the chimpanzee only or both the chimpanzee and Rhesus genomes. Of 18 conserved miRNAs, 14 are derived from the L2 and MIR families; this is far more than would be expected on the basis of the overall frequency of L2 and MIR sequences among TE-derived miRNAs (x2¼17.8,P¼3.6e-5). The conservation of L2 and MIR TE-derived miRNAs is con-sistent with a previous study that found many anoma-lously conserved L2 and MIR sequences (Silva et al. 2003). Indeed, L2 and MIR are relatively ancient TE families with many sequences that inserted prior to the divergence of the human and mouse evolutionary line-ages. We observed 10 of the conserved L2- and MIR-derived miRNA sequences to have orthologous sequences in the mouse genome, and there are 9 orthologous mouse miRNAs in these regions that are annotated in miRBase (Table 3). All of the 8 conserved L2 miRNAs are derived from the same region near the 39-end of the L2 consensus sequence (approximately positions 3200–3400), while the 6 MIR-derived miRNAs are found in dispersed locations on the MIR consensus sequence. A frequency distribution of conserved vs. noncon-served TE-derived miRNA genes, compared to genome-wide relative TE frequencies, reveals distinct conservation levels for miRNAs derived from particular TE classes/ families (Figure 4). For instance, L2 and MIRs contrib-ute far more conserved than nonconserved miRNAs, and the fraction of conserved L2 and MIR elements in miRNAs is much higher than seen for these same elements in the genome as a whole. DNA-type elements show the opposite pattern. There is a higher fraction of
TABLE 2
Putative TE-derived miRNA paralogs
miRNA name (from miRBase)
miRBase
accession no. Colocated TE Paralogsa
hsa-mir-513-1 MI0003191 MER91C 3 hsa-mir-513-2 MI0003192 MER91C 3 hsa-mir-548a-1 MI0003593 MADE1 24 hsa-mir-548a-2 MI0003598 LTR16A1, MADE1 81 hsa-mir-548a-3 MI0003612 MLT1G1, MADE1 82 hsa-mir-548b MI0003596 MADE1 23 hsa-mir-548c MI0003630 MADE1 124 hsa-mir-548d-1 MI0003668 MADE1 71 hsa-mir-548d-2 MI0003671 MADE1 145 hsa-mir-552 MI0003557 L1MD2 1 hsa-mir-562 MI0003568 L1MB7 2 hsa-mir-566 MI0003572 AluSg 87 hsa-mir-570 MI0003577 MADE1 48 hsa-mir-571 MI0003578 L1MA9 4 hsa-mir-579 MI0003586 MADE1, L1MB8 3 hsa-mir-603 MI0003616 MADE1 30
hsa-mir-607 MI0003620 MIR 1
hsa-mir-649 MI0003664 L1M4, MER8, AluSx
4
hsa-mir-652 MI0003667 MER91C 4
aNumber of paralogous sequences in the human genome.
Figure 3.—Evolutionary conservation of
nonconserved DNA-type elements among miRNAs than is seen for the whole genome. All of the miRNAs derived from Alu and L1 elements are nonconserved.
Regulation and function:Given their high copy num-bers, there is a potential for TE-derived miRNAs to regulate multiple genes via homologous target sites dis-persed throughout genome. Using the miRBase target predictions, TE-derived miRNAs were found to have hun-dreds of putative target sites (Table 1; Figure 5A). How-ever, while many of these target sites are also derived from TEs, in most cases the proportion of TE-derived target sites is 10% (Table 1; Figure 5B). Thus, TE-derived miRNAs also have the potential to regulate host genes with non-derived targets. The relative paucity of TE-derived target sites can be attributed, in part, to the fact that target-site prediction methods employ conservation of 39-UTR sequences as one criteria and TEs tend to be lineage specific and nonconserved.
There are several outliers that have a substantially higher fraction of TE-derived target sites. For instance, hsa-mir-566 is derived from Alu and it has 1184 pre-dicted targets with 948 (80%) derived from TEs. Most of these TE-derived hsa-mir-566 target sites are related to Alu insertions and this is consistent with previous studies that have found numerous putative Alu-related miRNA target sites in the human genome (Daskalova et al. 2006; Smalheiserand Torvik2006).
The predicted target sites analyzed here are all puta-tive sites and it is difficult to know with certainty whether they are actually involved in miRNA-mediated gene regulation. Another way to evaluate the regulatory po-tential of miRNAs is to compare the expression patterns of miRNAs to the expression patterns of the genes they are thought to regulate (Farh et al. 2005; Starket al. 2005; Huanget al. 2006; Soodet al. 2006). The rationale behind the miRNA–mRNA expression pattern compar-ison is based on the mRNA degradation model of miRNA action. According to this model, miRNA binding to mRNA target sites causes the mRNA transcripts to be degraded.
T ABLE 3 Human–mouse or thologous miRNAs derived fr om L2 and MIR TEs miRBase names and accession nos. for human orthologous miRNAs Genome coordinates for human orthologous regions Related TE sequence miRBase names and accession nos. for mouse orthologous miRNAs Genome coordinates for mouse orthologous regions hsa-mir -345: MI0000825 Chromosome 14: 99843949–99844046( 1 ) MIR mmu-mir -345: MI0000632 Chromosome 12: 109,284,780–109,284,874 ( 1 ) hsa-mir -130b: MI0000748 Chromosome 22: 20337593–20337674( 1 ) MIRm mmu-mir -130b: MI0000408 Chromosome 16: 17,037,626–17,037,705( ) hsa-mir -151: MI0000809 Chromosome 8: 141811845–141811934( ) L 2 mmu-mir -151: MI0000173 Gap hsa-mir -95: MI0000097 Chromosome 4: 8057928–8058008( ) L 2 — Gap hsa-mir -330: MI0000803 Chromosome 19: 50834092–50834185( ) MIRm mmu-mir -330: MI0000607 Chromosome 7: 18,339,991–18,340,084( 1 ) hsa-mir -370: MI0000778 Chromosome 14: 100447229–100447303( 1 ) MIRm mmu-mir -370: MI0001165 Chromosome 12: 110,066,065–110,066,139( 1 ) hsa-mir -325: MI0000824 Chromosome X: 76142220–76142317( ) L 2 mmu-mir -325: MI0000597 Chromosome X: 101,581,801–101,581,898( ) hsa-mir -545: MI0003516 Chromosome X: 73423664–73423769( ) L 2 — Chromosome X: 99,818,159–99,818,260( ) hsa-mir -374: MI0000782 Chromosome X: 73423846–73423917( ) L 2 mmu-mir -374: MI0004125 Chromosome X: 99,818,306–99,818,361( ) hsa-mir -28: MI0000086 Chromosome 3: 189889263–189889348( 1 ) L 2 mmu-mir -28: MI0000690 Chromosome 16: 24,743,204–24,743,289( 1 ) hsa-mir -493: MI0003132 Chromosome 14: 100405150–100405238( 1 ) L 2 — Chromosome 12: 110,028,035–110,028,123( 1 ) hsa-mir -607: MI0003620 Chromosome 10: 98578416–98578511( ) MIR — Gap hsa-mir -421: MI0003685 Chromosome X: 73354937–73355021( ) L 2 — Chromosome X: 99,775,634–99,775,718( ) hsa-mir -378: MI0000786 Chromosome 5: 149092581–149092646( 1 ) MIRb mmu-mir -378: MI0000795 Gap ‘‘Gap’ ’ indicates no orthologous region.
Figure 4.—Percentage of TE sequences among different
This model predicts anti-correlations between expres-sion levels of miRNAs and the mRNAs of their target genes;i.e., high levels of miRNA would lead to decreased levels of targeted mRNA.
We sought to compare miRNA expression levels for TE-derived miRNA genes to mRNA expression levels of their target genes to look for anti-correlations that are consistent with regulation via mRNA degradation. miRNA expression data were taken from a microarray study of 150 human miRNAs across five tissue samples (Barad et al. 2004), and mRNA expression data were taken from the Novartis SymAtlas (Suet al. 2004). Pairs of miRNA– mRNA gene expression profile vectors were compared using the Pearson correlation coefficient (r). There were only three TE-derived miRNA genes with expression data available. Despite this small sample size and the fairly low resolution afforded by the comparison of only five tissues, we found numerous cases of strongly anti-correlated miRNA–mRNA pairs (Figure 6). Since this
Figure 5.—Target-site frequencies for TE-derived miRNAs.
(A) Frequency distribution showing the number of target sites per TE-derived miRNA. (B) Frequency distribution showing the percentage of TE-derived target sites per TE-derived miRNA.
Figure 6.—Anti-correlated expression patterns for
TE-derived miRNAs and their targeted mRNAs. Results for three TE-derived miRNAs with expression data are shown: hsa-mir-130b (A), hsa-mir-28 (B), and hsa-mir-95 (C). The top row in A–C shows the relative miRNA expression across five human tissues, and the subsequent rows show relative
anti-correlation is consistent with the mRNA degradation model of miRNA gene regulation, it provides an addi-tional source of support for putative miRNA target sites and the regulatory action of TE-derived miRNAs.
We also evaluated the GO biological process annota-tions of the anti-correlated gene sets to look for over-represented functional categories that may indicate specific functional roles for TE-derived miRNAs. The top 10% of anti-correlated mRNAs (i.e., those with the lowestr- values) for each of the three TE-derived miRNAs with expression data were evaluated for overrepresented GO terms. The miRNA hsa-mir-130b gave the strongest signal of GO term overrepresentation; 39 of 80 genes were found to correspond to significantly overrepresented GO terms (supplemental Table 1 at http://www.genetics. org/supplemental/). Many of these genes correspond to metabolism and transcriptional regulation in general as well as to several negative regulators of DNA metabo-lism (supplemental Figure 3 at http://www.genetics.org/ supplemental/). This negative regulation is achieved in part by chromatin remodeling, silencing, and hetero-chromatin formation. Thus, hsa-mir-130b may act to indi-rectly upregulate DNA metabolism by downregulating chromatin-based repressors.
Prediction of novel TE-derived miRNAs: The
func-tion of miRNAs, and of noncoding RNAs in general, is related to their secondary structure (Mattickand Makunin 2006). Selective constraint on such sequences often leads to compensatory mutations that maintain the base-pair interactions in the double-stranded regions of the struc-tures, such as miRNA stem regions. Sequence alignments can be evaluated for the signal of conserved base-pair interactions as well as compensatory mutations to identify conserved, and thus presumably functionally relevant, secondary structural elements. Recent application of such techniques has led to the discovery of many novel puta-tive regulatory RNA sequences (Washietl et al. 2005; Pedersen et al. 2006). It has even been shown that orthologous regions that are not constrained at the level of primary sequence may nevertheless encode conserved secondary structural elements (Torarinssonet al. 2006). Given the contribution of TEs to experimentally charac-terized miRNAs shown here and elsewhere (Smalheiser and Torvik2005; Borchertet al. 2006; Piriyapongsa and Jordan2007), we sought to evaluate human TE se-quences for the ability to form hairpin structures along with the signals of conserved base pairs and compensa-tory mutations that indicate putatively functional second-ary structures. This approach provides a way to predict further contributions of TEs to miRNAs.
Human genome TE sequences were evaluated for the potential to encode conserved secondary structures (Pedersenet al. 2006) that meet the criteria of miRNA genes (Bentwich et al. 2005). This approach is servative in the sense that it relies on sequence con-servation and most of the experimentally characterized TE-derived miRNAs that we observe (37 of 55) are not
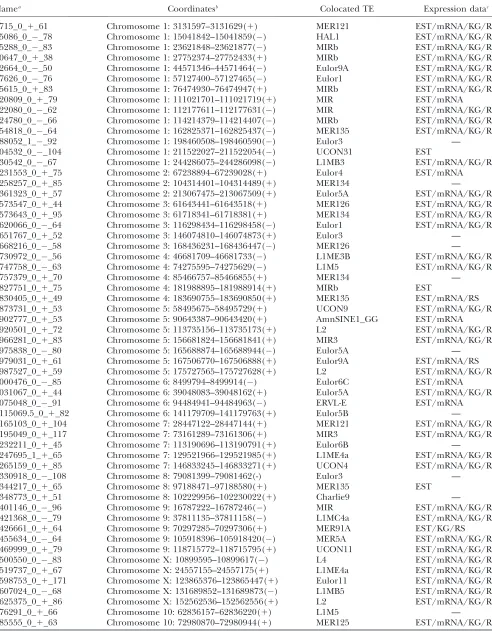
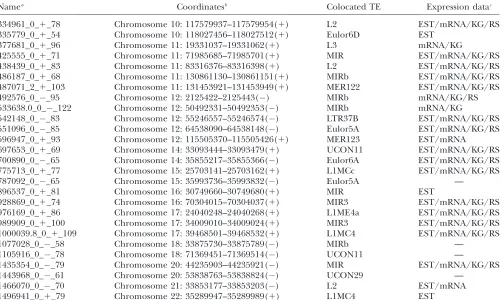
evolutionarily conserved. Using this conservative ap-proach, we found 587 human TEs with the potential to encode conserved secondary structures (supplemental Table 2 at http://www.genetics.org/supplemental/); 4 of these sequences corresponded to previously known human miRNAs annotated in miRBase. Evaluation of these conserved secondary structures was used to identify 85 TE-derived sequences that meet the structural cri-teria of putative miRNA genes, and 70 of these sequences also show evidence of being expressed (Table 4). These 70 putative TE-derived miRNA sequences meet the pre-viously defined biogenesis, conservation, and, at least in principle, expression criteria used for the identification of miRNA genes (Ambroset al. 2003).
An example of a predicted TE-derived miRNA gene is shown in Figure 7. The MER135 sequence shown is a member of a family of recently characterized nonau-tonomous DNA-type elements, i.e., MITEs, with 500 copies in the human genome ( Jurka2006). Since MITEs have palindromic structures with terminal inverted re-peats that flank short internal regions, their expression as RNA results in the formation of the kinds of hairpins seen for pre-miRNAs. Indeed, MITEs have previously been shown to contribute miRNA genes in the Arabidopsis and human genomes (Metteet al. 2002; Piriyapongsa and Jordan2007).
DISCUSSION
Abundance of TE-derived miRNAs: Noncoding
reg-ulatory RNAs, such as miRNAs, are a recently discovered class of genes, and the number of miRNA genes that exist among eukaryotic genomes is very much an open question (Berezikov et al. 2006). Sustained efforts at high-throughput characterization of miRNA genes, based on both experimental and computational ap-proaches, continue to result in the discovery of many novel miRNAs (Bentwich et al. 2005; Cummins et al. 2006). This can be appreciated by examining the release statistics of miRBase (ftp://ftp.sanger.ac.uk/pub/mirbase/ sequences/CURRENT/README). Plotting the num-ber of miRNA gene entries against the miRBase release dates suggests that the number of known miRNA genes has experienced two distinct phases of linear increase, before and after the June 2005 release, and the current rate of increase in known miRNA genes is even greater than for the initial phase (supplemental Figure 4 at http://www.genetics.org/supplemental/).
TABLE 4
Predicted TE-derived miRNA genes
Namea Coordinatesb Colocated TE Expression datac
3715_0_1_61 Chromosome 1: 3131597–3131629(1) MER121 EST/mRNA/KG/RS 15086_0__78 Chromosome 1: 15041842–15041859() HAL1 EST/mRNA/KG/RS 25288_0__83 Chromosome 1: 23621848–23621877() MIRb EST/mRNA/KG/RS 30647_0_1_38 Chromosome 1: 27752374–27752433(1) MIRb EST/mRNA/KG/RS 52664_0__50 Chromosome 1: 44571346–44571464() Eulor9A EST/mRNA/KG/RS 67626_0__76 Chromosome 1: 57127400–57127465() Eulor1 EST/mRNA/KG/RS 85615_0_1_83 Chromosome 1: 76474930–76474947(1) MIRb EST/mRNA/KG/RS 120809_0_1_79 Chromosome 1: 111021701–111021719(1) MIR EST/mRNA 122080_0__62 Chromosome 1: 112177611–112177631() MIR EST/mRNA/KG/RS 124780_0__66 Chromosome 1: 114214379–114214407() MIRb EST/mRNA/KG/RS 154818_0__64 Chromosome 1: 162825371–162825437() MER135 EST/mRNA/KG/RS 188052_1__92 Chromosome 1: 198460508–198460590() Eulor3 —
204532_0__104 Chromosome 1: 211522027–211522054() UCON31 EST
230542_0__67 Chromosome 1: 244286075–244286098() L1MB3 EST/mRNA/KG/RS 1231553_0_1_75 Chromosome 2: 67238894–67239028(1) Eulor4 EST/mRNA 1258257_0_1_85 Chromosome 2: 104314401–104314489(1) MER134 —
1361323_0_1_57 Chromosome 2: 213067475–213067509(1) Eulor5A EST/mRNA/KG/RS 1573547_0_1_44 Chromosome 3: 61643441–61643518(1) MER126 EST/mRNA/KG/RS 1573643_0_1_95 Chromosome 3: 61718341–61718381(1) MER134 EST/mRNA/KG/RS 1620066_0__64 Chromosome 3: 116298434–116298458() Eulor1 EST/mRNA/KG/RS 1651767_0_1_52 Chromosome 3: 146074810–146074873(1) Eulor3 —
1668216_0__58 Chromosome 3: 168436231–168436447() MER126 —
1730972_0__56 Chromosome 4: 46681709–46681733() L1ME3B EST/mRNA/KG/RS 1747758_0__63 Chromosome 4: 74275595–74275629() L1M5 EST/mRNA/KG/RS 1757379_0_1_70 Chromosome 4: 85466757–85466855(1) MER134 —
1827751_0_1_75 Chromosome 4: 181988895–181988914(1) MIRb EST
1830405_0_1_49 Chromosome 4: 183690755–183690850(1) MER135 EST/mRNA/RS 1873731_0_1_53 Chromosome 5: 58495675–58495729(1) UCON9 EST/mRNA/KG/RS 1902777_0_1_53 Chromosome 5: 90643387–90643420(1) AmnSINE1_GG EST/mRNA 1920501_0_1_72 Chromosome 5: 113735156–113735173(1) L2 EST/mRNA/KG/RS 1966281_0_1_83 Chromosome 5: 156681824–156681841(1) MIR3 EST/mRNA/KG/RS 1975838_0__80 Chromosome 5: 165688874–165688944() Eulor5A —
1979031_0_1_61 Chromosome 5: 167506770–167506888(1) Eulor9A EST/mRNA/RS 1987527_0_1_59 Chromosome 5: 175727565–175727628(1) L2 EST/mRNA/KG/RS 2000476_0__85 Chromosome 6: 8499794–8499914() Eulor6C EST/mRNA 2031067_0_1_44 Chromosome 6: 39048083–39048162(1) Eulor5A EST/mRNA/KG/RS 2075048_0__91 Chromosome 6: 94484941–94484963() ERVL-E EST/mRNA 2115069.5_0_1_82 Chromosome 6: 141179709–141179763(1) Eulor5B —
2165103_0_1_104 Chromosome 7: 28447122–28447144(1) MER121 EST/mRNA/KG/RS 2195049_0_1_117 Chromosome 7: 73161289–73161306(1) MIR3 EST/mRNA/KG/RS 2232211_0_1_45 Chromosome 7: 113190696–113190791(1) Eulor6B —
2247695_1_1_65 Chromosome 7: 129521966–129521985(1) L1ME4a EST/mRNA/KG/RS 2265159_0_1_85 Chromosome 7: 146833245–146833271(1) UCON4 EST/mRNA/KG/RS 2330918_0__108 Chromosome 8: 79081399–79081462(-) Eulor3 —
2344217_0_1_65 Chromosome 8: 97188471–97188580(1) MER135 EST 2348773_0_1_51 Chromosome 8: 102229956–102230022(1) Charlie9 —
2401146_0__96 Chromosome 9: 16787222–16787246() MIR EST/mRNA/KG/RS 2421368_0__79 Chromosome 9: 37811135–37811158() L1MC4a EST/mRNA/KG/RS 2426661_0_1_64 Chromosome 9: 70297285–70297306(1) MER91A EST/KG/RS 2455634_0__64 Chromosome 9: 105918396–105918420() MER5A EST/mRNA/KG/RS 2469999_0_1_79 Chromosome 9: 118715772–118715795(1) UCON11 EST/mRNA/KG/RS 2500550_0__83 Chromosome X: 10899595–10899617() L4 EST/mRNA/KG/RS 2519737_0_1_67 Chromosome X: 24557155–24557175(1) L1ME4a EST/mRNA/KG/RS 2598753_0_1_171 Chromosome X: 123865376–123865447(1) Eulor11 EST/mRNA/KG/RS 2607024_0__68 Chromosome X: 131689852–131689873() L1MB5 EST/mRNA/KG/RS 2625375_0_1_86 Chromosome X: 152562536–152562556(1) L2 EST/mRNA/KG/RS
276291_0_1_66 Chromosome 10: 62836157–62836220(1) L1M5 —
285555_0_1_63 Chromosome 10: 72980870–72980944(1) MER125 EST/mRNA/KG/RS
prediction do not consider TE-derived miRNAs (Bentwich et al. 2005; Lindowand Krogh2005; Namet al. 2005; Li et al. 2006). This is because, mainly for reasons of tractability, one of the first steps in computational anal-ysis of eukaryotic genome sequences is the exclusion of repetitive DNA by RepeatMasking. TEs will also tend to be excluded from predictions based solely on conserva-tion between species because they are rapidly evolving and lineage-specific genomic elements. This is under-scored by the fact that the set of TE-derived human miRNAs that we identify here is enriched for genes ex-perimentally characterized in humans (93% for TE-derivedvs. 81% for non-TE-derived miRNAs;x2¼4.76, P¼0.03).
The factors described above that suggest the exclu-sion of TE-derived miRNAs led us to speculate as to how many more miRNA genes would be discovered if TE sequences were not eliminated from consideration a priori. To investigate this, we employed our ownab initio computational approach to try and predict TE-derived miRNA sequences. Application of this method to the human genome revealed 587 cases of human TE se-quences that encode conserved RNA secondary struc-tures, 85 of which are most likely to representbona fide
miRNA genes. Fifteen of the TE-derived miRNA genes that we predicted using this approach overlap with pre-vious miRNA computational predictions (Berezikovet al. 2005; Pedersenet al. 2006) as well as experimentally char-acterized miRNAs from miRBase.
Conservation of TE-derived miRNAs: Many miRNA
genes are evolutionarily conserved and may have func-tional orthologs in multiple species. Indeed, sequence conservation is one of the criteria used to aid the com-putational discovery of miRNAs. While the TE-derived miRNA genes analyzed here are less conserved, on average, than non-TE-derived miRNAs, there are a num-ber of well-conserved miRNAs that evolved from TE sequences (Table 1). The majority of these conserved miRNAs are related to the ancient L2 and MIR TE families, and some of these sequences have been previously identified (Smalheiser and Torvik2005). This is particularly interesting because numerous L2 and MIR sequences have been shown to be anomalously conserved between the human and mouse genomes (Silvaet al. 2003). Specifically, Silvaet al. (2003) dem-onstrated that many L2 and MIR sequences found in orthologous human–mouse intergenic regions were present in the common ancestor of the two species and,
TABLE 4
(Continued)
Namea Coordinatesb Colocated TE Expression datac
334961_0_1_78 Chromosome 10: 117579937–117579954(1) L2 EST/mRNA/KG/RS 335779_0_1_54 Chromosome 10: 118027456–118027512(1) Eulor6D EST
377681_0_1_96 Chromosome 11: 19331037–19331062(1) L3 mRNA/KG
425555_0_1_71 Chromosome 11: 71985685–71985701(1) MIR EST/mRNA/KG/RS 438439_0_1_83 Chromosome 11: 83316376–83316398(1) L2 EST/mRNA/KG/RS 486187_0_1_68 Chromosome 11: 130861130–130861151(1) MIRb EST/mRNA/KG/RS 487071_2_1_103 Chromosome 11: 131453921–131453949(1) MER122 EST/mRNA/KG/RS 492576_0__95 Chromosome 12: 2125422–2125443() MIRb mRNA/KG/RS 533638.0_0__122 Chromosome 12: 50492331–50492353() MIRb mRNA/KG
542148_0__83 Chromosome 12: 55246557–55246574() LTR37B EST/mRNA/KG/RS 551096_0__85 Chromosome 12: 64538090–64538148() Eulor5A EST/mRNA/KG/RS 596947_0_1_93 Chromosome 12: 115505370–115505426(1) MER123 EST/mRNA 697653_0_1_69 Chromosome 14: 33093444–33093479(1) UCON11 EST/mRNA/KG/RS 700890_0__65 Chromosome 14: 35855217–35855366() Eulor6A EST/mRNA/KG/RS 775713_0_1_77 Chromosome 15: 25703141–25703162(1) L1MCc EST/mRNA/KG/RS 787092_0__65 Chromosome 15: 35993736–35993832() Eulor5A —
896537_0_1_81 Chromosome 16: 30749660–30749680(1) MIR EST
928869_0_1_74 Chromosome 16: 70304015–70304037(1) MIR3 EST/mRNA/KG/RS 976169_0_1_86 Chromosome 17: 24040248–24040268(1) L1ME4a EST/mRNA/KG/RS 989909_0_1_100 Chromosome 17: 34009010–34009024(1) MIR3 EST/mRNA/KG/RS 1000039.8_0_1_109 Chromosome 17: 39468501–39468532(1) L1MC4 EST/mRNA/KG/RS 1077028_0__58 Chromosome 18: 33875730–33875789() MIRb —
1105916_0__78 Chromosome 18: 71369451–71369514() UCON11 —
1435354_0__79 Chromosome 20: 44235903–44235921() MIR EST/mRNA/KG/RS 1443968_0__61 Chromosome 20: 53838763–53838824() UCON29 —
1466070_0__70 Chromosome 21: 33853177–33853203() L2 EST/mRNA 1496941_0_1_79 Chromosome 22: 35289947–35289989(1) L1MC4 EST
aName of the EvoFold locus from the hg18 UCSC Genome Browser annotation. The last field in the name corresponds to the EvoFold score.
bGenome coordinates and strand of the EvoFold locus. c
following their divergence, evolved under strong selec-tive constraint. From this, they reasoned that these selectively constrained sequences probably play some role related to gene regulation, although no specific functional role was ascribed to them. Here, we show that at least some of these conserved L2 and MIR fragments provide miRNA sequences with the potential to regulate numerous human genes.
As in the case of L2 and MIR (Silva et al. 2003), comparative genomic approaches are used to infer func-tionally important genomic regions, particularly noncod-ing regions, by virtue of their high sequence conservation
(Zhangand Gerstein2003). It is becoming increasingly apparent that a number of such highly conserved genomic sequences correspond to TEs (Bejeranoet al. 2006; Kamal et al. 2006; Nishiharaet al. 2006; Xieet al. 2006). While enhancer activity has been demonstrated for one of these conserved TEs (Bejeranoet al. 2006), for the most part, the specific function encoded by conserved TE sequences remains unknown. The collection of conserved TE se-quences recently assembled by Repbase corresponds to ,1% of all human genome TEs, but these sequences contribute.50% of all TE-encoded conserved secondary structures that we detected (Figure 2). Thus, our results
Figure7.—Ab initioprediction of human TE-derived miRNA genes. (A) Multiple sequence alignment of the MER135 consensus
sequence with the human genome sequence and orthologous genomic regions from 11 other vertebrate genomes. The predicted secondary structure is shown below the alignment with paired and unpaired positions indicated by parentheses and dots, respec-tively. Residues are colored according to the annotated secondary structure base pairs and their substitutions: gray, unpaired and no substitution; purple, unpaired and substitution; black, paired and no substitution; blue, paired and single substitution; green, paired and double substitution; red, not compatible with annotated pair. (B) Phylogenetic tree of the aligned species showing the double substitutions that maintain the secondary structure. Paired double substitutions are indicated with brackets and their po-sitions in the alignment are shown. (C) Secondary structure of the predicted miRNA gene. Popo-sitions of the double substitutions are indicated by red arrows.
suggest that many conserved TE sequences may encode miRNAs or perhaps other noncoding regulatory or struc-tural RNAs.
Lineage-specific effects of TE-derived miRNAs:Most of the TE-derived miRNAs analyzed here are not evolu-tionarily conserved (Table 1). This is not surprising when you consider that TEs are the most lineage-specific and nonconserved elements found in eukaryotic genomes (Lander et al. 2001). The overrepresentation of non-conserved sequences among TE-derived miRNAs is also consistent with previous work that has shown TE-derived cis-regulatory binding sites to be more divergent than non-TE-derivedcissites (Marin˜ o-Ramirezet al. 2005). From a practical perspective, this means that computa-tional discovery methods that employ conservation as a criterion will necessarily overlook many TE-derived reg-ulatory sequences. In terms of evolution, this means that the greatest differences between eukaryotic genomes will correspond to TE sequences. In this sense, TEs can be considered as drivers of genome diversification. This may be uninteresting if TEs serve only to replicate them-selves and do not play any role for their host genomes as the selfish DNA theory of TEs holds (Doolittle and Sapienza 1980; Orgel and Crick 1980). However, if some TEs are in fact functionally relevant to their hosts, as we have shown here for the case of TE-derived miRNAs, then their divergence may have important evolutionary implications. Indeed, TE-derived regulatory sequences may be particularly prone to contribute to regulatory differences among species that lead to lineage-specific phenotypes. This has been shown for the case of TE-derived regulatory sequences that are associated with high levels of expression divergence between humans and mice (Marin˜ o-Ramirezand Jordan2006).
While most computational efforts to discover non-coding regulatory sequences have focused on conserved genomic elements, recent studies have begun to em-phasize rapidly evolving regions as well (Pollardet al. 2006a,b; Prabhakaret al. 2006). The rationale behind this is the notion that rapidly evolving regulatory regions may yield species-specific differences. An emphasis on the discovery of TE-derived regulatory sequences would complement current approaches to the discovery of rapidly evolving regulatory regions that are likely to contribute to the phenotypic divergence among species.
Genome defense and global gene regulatory mech-anisms:Finally, we speculate that our results point to a connection between genome defense mechanisms ne-cessitated by TEs and the emergence of global gene regulatory systems that may have allowed for the com-plex regulatory phenotypes characteristic of multicellu-lar eukaryotes. TE insertions are highly deleterious and, as a consequence, a number of global gene-silencing mechanisms, including methylation (Yoderet al. 1997), imprinting (McDonald et al. 2005), and heterochro-matin (Lippmanet al. 2004), may have evolved originally as TE defense mechanisms. siRNAs are also thought
to have evolved as a defense mechanism against TEs (Matzkeet al. 2000; Vastenhouwand Plasterk2004; Slotkinet al. 2005), and the results reported here and elsewhere (Smalheiser and Torvik 2005; Borchert et al. 2006; Piriyapongsa and Jordan 2007) indicate that miRNAs can emerge from TEs as well. More recently, an analogous TE defense mechanism based on small RNAs complementary to TEs in Drosophila has been reported (Brenneckeet al. 2007). Apparently, different RNA interference systems may have evolved conver-gently on multiple occasions to help silence TEs. Later, these regulatory mechanisms could have been co-opted to exert controlling effects over thousands of host genes as is the case for miRNAs. The evolution of such com-plex gene regulatory systems can be considered non-adaptive (Lynch2007) in the sense that they did not evolve by virtue of selection for the role that they play now. However, neither did these global regulatory mech-anisms evolve passively since they were swept to fixation by selective pressure to defend against TEs. Therefore, the emergence of TE-related global regulatory systems, exemplified by RNA interference, can be considered to be exaptations (Gouldand Vrba1982) driven by the internal mutational dynamics (Stoltzfus2006) of the genome.
The authors thank Nalini Polavarapu and Ahsan Huda for technical support and helpful comments. Jittima Piriyapongsa is supported by the Ministry of Science and Technology of Thailand. I. King Jordan is supported by the School of Biology at the Georgia Institute of Technology. This research was supported in part by the intramural research program of the National Center for Biotechnology Informa-tion, National Library of Medicine, National Institutes of Health.
LITERATURE CITED
Ambros, V., 2004 The functions of animal microRNAs. Nature431:
350–355.
Ambros, V., B. Bartel, D. P. Bartel, C. B. Burge, J. C. Carrington
et al., 2003 A uniform system for microRNA annotation. RNA9:
277–279.
Ashburner, M., C. A. Ball, J. A. Blake, D. Botstein, H. Butler
et al., 2000 Gene ontology: tool for the unification of biology. The Gene Ontology Consortium. Nat. Genet.25:25–29. Barad, O., E. Meiri, A. Avniel, R. Aharonov, A. Barzilaiet al.,
2004 MicroRNA expression detected by oligonucleotide micro-arrays: system establishment and expression profiling in human tissues. Genome Res.14:2486–2494.
Bartel, D. P., 2004 MicroRNAs: genomics, biogenesis, mechanism,
and function. Cell116:281–297.
Bejerano, G., C. B. Lowe, N. Ahituv, B. King, A. Siepelet al.,
2006 A distal enhancer and an ultraconserved exon are derived from a novel retroposon. Nature441:87–90.
Bentwich, I., A. Avniel, Y. Karov, R. Aharonov, S. Giladet al.,
2005 Identification of hundreds of conserved and noncon-served human microRNAs. Nat. Genet.37:766–770.
Berezikov, E., V. Guryev, J. van de Belt, E. Wienholds, R. H.
Plasterk et al., 2005 Phylogenetic shadowing and
compu-tational identification of human microRNA genes. Cell 120:
21–24.
Berezikov, E., E. Cuppenand R. H. Plasterk, 2006 Approaches to
microRNA discovery. Nat. Genet.38(Suppl.): S2–S7.
Blanchette, M., W. J. Kent, C. Riemer, L. Elnitski, A. F. Smitet al.,
Borchert, G. M., W. Lanierand B. L. Davidson, 2006 RNA
poly-merase III transcribes human microRNAs. Nat. Struct. Mol. Biol.
13:1097–1101.
Brennecke, J., D. R. Hipfner, A. Stark, R. B. Russelland S. M.
Cohen, 2003 bantam encodes a developmentally regulated
microRNA that controls cell proliferation and regulates the proa-poptotic gene hid in Drosophila. Cell113:25–36.
Brennecke, J., A. A. Aravin, A. Stark, M. Dus, M. Kellis et al.,
2007 Discrete small RNA-generating loci as master regulators of transposon activity in Drosophila. Cell128:1089–1103. Britten, R. J., 1996 DNA sequence insertion and evolutionary
varia-tion in gene regulavaria-tion. Proc. Natl. Acad. Sci. USA93:9374–9377. Chen, C. Z., L. Li, H. F. Lodishand D. P. Bartel, 2004 MicroRNAs
modulate hematopoietic lineage differentiation. Science 303:
83–86.
Cummins, J. M., Y. He, R. J. Leary, R. Pagliarini, L. A. Diaz, Jr.et al.,
2006 The colorectal microRNAome. Proc. Natl. Acad. Sci. USA
103:3687–3692.
Daskalova, E., V. Baev, V. Rusinovand I. Minkov, 2006 39
UTR-located Alu elements: donors of potential miRNA target sites and mediators of network miRNA-based regulatory interactions. Evol. Bioinform. Online2:99–116.
Doolittle, W. F., and C. Sapienza, 1980 Selfish genes, the
pheno-type paradigm and genome evolution. Nature284:601–603. Enright, A. J., B. John, U. Gaul, T. Tuschl, C. Sander et al.,
2003 MicroRNA targets in Drosophila. Genome Biol.5:R1. Farh, K. K., A. Grimson, C. Jan, B. P. Lewis, W. K. Johnstonet al.,
2005 The widespread impact of mammalian MicroRNAs on mRNA repression and evolution. Science310:1817–1821. Gould, S. J., and E. S. Vrba, 1982 Exaptation: a missing term in the
science of form. Paleobiology8:4–15.
Griffiths-Jones, S., R. J. Grocock, S.vanDongen, A. Batemanand
A. J. Enright, 2006 miRBase: microRNA sequences, targets
and gene nomenclature. Nucleic Acids Res.34:D140–D144. Hofacker, I. L., W. Fontana, P. F. Stadler, S. Bonhoeffer, M.
Tackeret al., 1994 Fast folding and comparison of RNA
second-ary structures. Monatsh. Chem.125:167–188.
Huang, J. C., Q. D. Morrisand B. J. Frey, 2006 Detecting
micro-RNA targets by linking sequence, micromicro-RNA and gene ex-pression data, pp. 114–129 in RECOMB 2006, edited by A. Apostolico, C. Guerra, S. Istrail, P. A. Pevznerand M. S.
Waterman. Springer-Verlag, Venice, Italy.
Jordan, I. K., I. B. Rogozin, G. V. Glazko and E. V. Koonin,
2003 Origin of a substantial fraction of human regulatory se-quences from transposable elements. Trends Genet.19:68–72. Jurka, J., 2006 MER135: conserved mammalian repeat, probably
derived from a non-autonomous DNA transposon. Repbase Rep.
6:388.
Jurka, J., V. V. Kapitonov, A. Pavlicek, P. Klonowski, O. Kohany
et al., 2005 Repbase Update, a database of eukaryotic repetitive elements. Cytogenet. Genome Res.110:462–467.
Kamal, M., X. Xieand E. S. Lander, 2006 A large family of ancient
repeat elements in the human genome is under strong selection. Proc. Natl. Acad. Sci. USA103:2740–2745.
Karolchik, D., A. S. Hinrichs, T. S. Furey, K. M. Roskin, C. W.
Sugnetet al., 2004 The UCSC Table Browser data retrieval tool.
Nucleic Acids Res.32:D493–D496.
Kent, W. J., 2002 BLAT: the BLAST-like alignment tool. Genome
Res.12:656–664.
Kent, W. J., C. W. Sugnet, T. S. Furey, K. M. Roskin, T. H. Pringle
et al., 2002 The human genome browser at UCSC. Genome Res.
12:996–1006.
Kent, W. J., R. Baertsch, A. Hinrichs, W. Millerand D. Haussler,
2003 Evolution’s cauldron: duplication, deletion, and rear-rangement in the mouse and human genomes. Proc. Natl. Acad. Sci. USA100:11484–11489.
Kidwell, M. G., and D. R. Lisch, 2001 Perspective: transposable
elements, parasitic DNA, and genome evolution. Evolution Int. J. Org. Evolution55:1–24.
Lagos-Quintana, M., R. Rauhut, W. Lendeckeland T. Tuschl,
2001 Identification of novel genes coding for small expressed RNAs. Science294:853–858.
Lander, E. S., L. M. Linton, B. Birren, C. Nusbaum, M. C. Zody
et al., 2001 Initial sequencing and analysis of the human ge-nome. Nature409:860–921.
Lau, N. C., L. P. Lim, E. G. Weinsteinand D. P. Bartel, 2001 An
abundant class of tiny RNAs with probable regulatory roles in Caenorhabditis elegans. Science294:858–862.
Lee, R. C., and V. Ambros, 2001 An extensive class of small RNAs in
Caenorhabditis elegans. Science294:862–864.
Lee, R. C., R. L. Feinbaumand V. Ambros, 1993 The C. elegans
het-erochronic gene lin-4 encodes small RNAs with antisense com-plementarity to lin-14. Cell75:843–854.
Li, S. C., C. Y. Panand W. C. Lin, 2006 Bioinformatic discovery of
microRNA precursors from human ESTs and introns. BMC Genomics7:164.
Lindow, M., and A. Krogh, 2005 Computational evidence for
hun-dreds of non-conserved plant microRNAs. BMC Genomics6:119. Lippman, Z., A. V. Gendrel, M. Black, M. W. Vaughn, N. Dedhia
et al., 2004 Role of transposable elements in heterochromatin and epigenetic control. Nature430:471–476.
Lynch, M., 2007 The Origins of Genome Architecture. Sinauer
Associ-ates, Sunderland, MA.
Marin˜ o-Ramirez, L., and I. K. Jordan, 2006 Transposable element
derived DNaseI-hypersensitive sites in the human genome. Biol. Direct1:20.
Marin˜ o-Ramirez, L., K. C. Lewis, D. Landsmanand I. K. Jordan,
2005 Transposable elements donate lineage-specific regulatory sequences to host genomes. Cytogenet. Genome Res.110:333–341. Mattick, J. S., and I. V. Makunin, 2006 Non-coding RNA. Hum.
Mol. Genet. 15 Spec. No. 1: R17–R29.
Matzke, M. A., M. F. Metteand A. J. Matzke, 2000 Transgene
si-lencing by the host genome defense: implications for the evolu-tion of epigenetic control mechanisms in plants and vertebrates. Plant Mol. Biol.43:401–415.
McDonald, J. F., M. A. Matzkeand A. J. Matzke, 2005 Host
de-fenses to transposable elements and the evolution of genomic imprinting. Cytogenet. Genome Res.110:242–249.
Mette, M. F., J.van derWinden, M. Matzkeand A. J. Matzke,
2002 Short RNAs can identify new candidate transposable ele-ment families in Arabidopsis. Plant Physiol.130:6–9.
Miller, W. J., S. Hagemann, E. Reiterand W. Pinsker, 1992
P--element homologous sequences are tandemly repeated in the ge-nome of Drosophila guanche. Proc. Natl. Acad. Sci. USA 89:
4018–4022.
Nam, J. W., K. R. Shin, J. Han, Y. Lee, V. N. Kimet al., 2005 Human
microRNA prediction through a probabilistic co-learning model of sequence and structure. Nucleic Acids Res.33:3570–3581. Nishihara, H., A. F. Smitand N. Okada, 2006 Functional
noncod-ing sequences derived from SINEs in the mammalian genome. Genome Res.16:864–874.
Orgel, L. E., and F. H. Crick, 1980 Selfish DNA: the ultimate
par-asite. Nature284:604–607.
Pasquinelli, A. E., B. J. Reinhart, F. Slack, M. Q. Martindale, M. I.
Kurodaet al., 2000 Conservation of the sequence and temporal
expression of let-7 heterochronic regulatory RNA. Nature408:
86–89.
Pedersen, J. S., G. Bejerano, A. Siepel, K. Rosenbloom, K.
Lindblad-Tohet al., 2006 Identification and classification of
conserved RNA secondary structures in the human genome. PLoS Comput. Biol.2:e33.
Piriyapongsa, J., and I. K. Jordan, 2007 A family of human
micro-RNA genes from miniature inverted-repeat transposable ele-ments. PLoS ONE2:e203.
Pollard, K. S., S. R. Salama, B. King, A. D. Kern, T. Dreszeret al.,
2006a Forces shaping the fastest evolving regions in the human genome. PLoS Genet.2:e168.
Pollard, K. S., S. R. Salama, N. Lambert, M. A. Lambot, S. Coppens
et al., 2006b An RNA gene expressed during cortical develop-ment evolved rapidly in humans. Nature443:167–172. Prabhakar, S., J. P. Noonan, S. Paaboand E. M. Rubin, 2006
Ac-celerated evolution of conserved noncoding sequences in hu-mans. Science314:786.
Reinhart, B. J., F. J. Slack, M. Basson, A. E. Pasquinelli, J. C.
Bettingeret al., 2000 The 21-nucleotide let-7 RNA regulates
developmental timing in Caenorhabditis elegans. Nature 403:
901–906.
Siepel, A., G. Bejerano, J. S. Pedersen, A. S. Hinrichs, M. Houet al.,
2005 Evolutionarily conserved elements in vertebrate, insect, worm, and yeast genomes. Genome Res.15:1034–1050.
Silva, J. C., S. A. Shabalina, D. G. Harris, J. L. Spougeand A. S.
Kondrashovi, 2003 Conserved fragments of transposable
ele-ments in intergenic regions: evidence for widespread recruit-ment of MIR- and L2-derived sequences within the mouse and human genomes. Genet. Res.82:1–18.
Slotkin, R. K., M. Freelingand D. Lisch, 2005 Heritable
transpo-son silencing initiated by a naturally occurring transpotranspo-son in-verted duplication. Nat. Genet.37:641–644.
Smalheiser, N. R., and V. I. Torvik, 2005 Mammalian microRNAs
derived from genomic repeats. Trends Genet.21:322–326. Smalheiser, N. R., and V. I. Torvik, 2006 Alu elements within
hu-man mRNAs are probable microRNA targets. Trends Genet.22:
532–536.
Smit, A. F. A., R. Hubleyand P. Green, 1996–2004
RepeatMas-ker Open-3.0 (http://www.repeatmasRepeatMas-ker.org).
Sood, P., A. Krek, M. Zavolan, G. Macino and N. Rajewsky,
2006 Cell-type-specific signatures of microRNAs on target mRNA expression. Proc. Natl. Acad. Sci. USA103:2746–2751. Stark, A., J. Brennecke, N. Bushati, R. B. Russelland S. M. Cohen,
2005 Animal MicroRNAs confer robustness to gene expression and have a significant impact on 39UTR evolution. Cell 123:
1133–1146.
Stoltzfus, A., 2006 Mutationism and the dual causation of
evolu-tionary change. Evol. Dev.8:304–317.
Sturn, A., J. Quackenbushand Z. Trajanoski, 2002 Genesis:
clus-ter analysis of microarray data. Bioinformatics18:207–208. Su, A. I., T. Wiltshire, S. Batalov, H. Lapp, K. A. Chinget al.,
2004 A gene atlas of the mouse and human protein-encoding transcriptomes. Proc. Natl. Acad. Sci. USA101:6062–6067. Torarinsson, E., M. Sawera, J. H. Havgaard, M. Fredholmand J.
Gorodkin, 2006 Thousands of corresponding human and
mouse genomic regions unalignable in primary sequence con-tain common RNA structure. Genome Res.16:885–889.
van de Lagemaat, L. N., J. R. Landry, D. L. Mager and
P. Medstrand, 2003 Transposable elements in mammals
pro-mote regulatory variation and diversification of genes with spe-cialized functions. Trends Genet.19:530–536.
Vastenhouw, N. L., and R. H. Plasterk, 2004 RNAi protects the
Caenorhabditis elegans germline against transposition. Trends Genet.20:314–319.
Volff, J. N., 2006 Turning junk into gold: domestication of
trans-posable elements and the creation of new genes in eukaryotes. BioEssays28:913–922.
Washietl, S., I. L. Hofackerand P. F. Stadler, 2005 Fast and
re-liable prediction of noncoding RNAs. Proc. Natl. Acad. Sci. USA
102:2454–2459.
Xie, X., M. Kamaland E. S. Lander, 2006 A family of conserved
noncoding elements derived from an ancient transposable ele-ment. Proc. Natl. Acad. Sci. USA103:11659–11664.
Yoder, J. A., C. P. Walshand T. H. Bestor, 1997 Cytosine
methyl-ation and the ecology of intragenomic parasites. Trends Genet.
13:335–340.
Zhang, B., D. Schmoyer, S. Kirovand J. Snoddy, 2004 GOTree
Machine (GOTM): a web-based platform for interpreting sets of interesting genes using Gene Ontology hierarchies. BMC Bio-informatics5:16.
Zhang, Z., and M. Gerstein, 2003 Of mice and men: phylogenetic
footprinting aids the discovery of regulatory elements. J. Biol.
2:11.