Genotype-Environment Interactions at Quantitative Trait Loci Affecting
Inflorescence Development in
Arabidopsis thaliana
Mark C. Ungerer,
1Solveig S. Halldorsdottir, Michael D. Purugganan and Trudy F. C. Mackay
Department of Genetics, North Carolina State University, Raleigh, North Carolina 27695 Manuscript received November 4, 2002
Accepted for publication May 5, 2003
ABSTRACT
Phenotypic plasticity and genotype-environment interactions (GEI) play a prominent role in plant morphological diversity and in the potential functional capacities of plant life-history traits. The genetic basis of plasticity and GEI, however, is poorly understood in most organisms. In this report, inflorescence development patterns inArabidopsis thalianawere examined under different, ecologically relevant photope-riod environments for two recombinant inbred mapping populations (Ler⫻Col and Cvi⫻Ler) using a combination of quantitative genetics and quantitative trait locus (QTL) mapping. Plasticity and GEI were regularly observed for the majority of 13 inflorescence traits. These observations can be attributable (at least partly) to variable effects of specific QTL. Pooled across traits, 12/44 (27.3%) and 32/62 (51.6%) of QTL exhibited significant QTL⫻ environment interactions in the Ler ⫻ Col and Cvi ⫻ Ler lines, respectively. These interactions were attributable to changes in magnitude of effect of QTL more often than to changes in rank order (sign) of effect. Multiple QTL⫻environment interactions (in Cvi⫻Ler) clustered in two genomic regions on chromosomes 1 and 5, indicating a disproportionate contribution of these regions to the phenotypic patterns observed. High-resolution mapping will be necessary to distinguish between the alternative explanations of pleiotropy and tight linkage among multiple genes.
I
NFLORESCENCE is a major component of flow- is typically depicted by the norm of reaction ( Schmal-hausen1949), which is simply a plot of measurements ering plant morphology (Weberling1989;Tuckerfor the same trait in different environments. The differ-and Grimes 1999). Composed of the flower-bearing
ence between measurements in different environments shoots and branches, this structure is critically involved
is referred to as environmental sensitivity (Falconer in reproduction, and the timing of initiation and
devel-1990). Not all genotypes respond similarly to environ-opmental progression are important determinants of
mental signals, however, and variation in response (vari-plant life history and reproductive ecology (Rathcke
ation in norms of reaction or environmental sensitivi-andLacey1985;FishbeinandVenable1996;Diggle
ties) is manifested as genotype-environment interaction 1999). In the model plant speciesArabidopsis thaliana,
(GEI). the basic blueprint of inflorescence development is
gen-Phenotypic plasticity and GEI are of considerable in-erally understood (discussed in Grbic and Bleecker
terest from both ecological and evolutionary genetic 1996;Simpsonet al.1999). However, the timing of
in-perspectives (ViaandLande1985;Schlichting1986; florescence developmental events and overall
architec-West-Eberhard1989;Scheiner 1993;Viaet al.1995; ture can be influenced to a great extent by
environmen-SchlichtingandPigliucci1998;Sultan2000; Pigli-tal factors such as nutrient availability (Zhang and
ucci2001). For populations that regularly experience Lechowicz1994;Van Tienderenet al.1996;Pigliucci
heterogeneous environments, plasticity may be adaptive 1997;BonserandAarssen2001), light quality (Dorn
because alternative phenotypes can be expressed in dif-et al.2000), drought stress (Meyreet al.2001), density
ferent environments. In sessile organisms such as plants, (OrbovicandTarasjev1999), photoperiod (Clarke
this phenomenon may be of special significance; the et al. 1995;Jansen et al. 1995; Reevesand Coupland
inability of plants to escape changing environmental 2000), and vernalization (Clarkeet al.1995;Jansenet
conditions leaves developmental plasticity as the only al.1995; Simpson et al. 1999; Reeves and Coupland
means of response (Bradshaw 1965). A number of 2000).
theoretical models have been developed, describing The ability of a genotype to modify phenotypic
expres-conditions under which adaptive plasticity might evolve sion in response to different environmental conditions
(Via and Lande 1985; Lively 1986a; De Jong 1990, is referred to as phenotypic plasticity. This phenomenon
1995; Gomulkiewicz and Kirkpatrick 1992; Van Tienderen1997), and numerous empirical tests of the adaptive plasticity hypothesis have been conducted
1Corresponding author: Department of Genetics, Box 7614, North
(Lively 1986b; Greene 1989; Bronmark and Miner
Carolina State University, Raleigh, NC 27695.
E-mail: [email protected] 1992; Schmitt et al. 1999). Theoretical models have
also implicated GEI as a factor that could contribute to upon those results by examining the same traits and mapping populations in a second, short-day (10-hr) the maintenance of genetic variation in natural
popula-tions, especially if the genetic basis of GEI is such that photoperiod and conducting a joint analysis on the com-bined data (long day plus short day) to determine the alternative alleles at a locus are favored in different
environments (Hedrick1986;GillespieandTurelli extent to which inflorescence development exhibits plasticity and GEI to photoperiod and to explore the 1989; but seeGimelfarb1990).
Despite the importance of phenotypic plasticity and genetic basis of these phenomena. Photoperiod is a reliable environmental cue that predicts seasonal GEI in ecological and evolutionary processes, empirical
study of the genetic basis of these phenomena has been change and is thus of ecological relevance for plants; it is known to affect many aspects of plant growth and difficult because most traits of ecological and
evolution-ary relevance are polygenic and the environment-spe- development (Evans 1975; Thomas and Vince-Prue 1997).
cific expression of such traits is generally not well
under-stood. Two classes of genetic models have been specified In this report, it is shown that most inflorescence development traits exhibit plasticity and GEI in re-to explain plasticity and GEI (Viaet al.1995): (1) the
allelic sensitivity model holds that plasticity and GEI sponse to different photoperiod environments and that these phenotypic responses are attributable (at least in arise from differential effects of loci directly
contribut-ing to variation in plastic traits (i.e., allele substitutions part) to variable effects of specific QTL. Further, it is shown that QTL for environmental sensitivity (the stan-affect the phenotypic mean, but differently, in different
environments), whereas (2) the gene regulation model dardized difference between traits measured in differ-ent photoperiod environmdiffer-ents) often co-localize with posits that specific loci may enhance (or suppress)
ex-pression of other genes (only the latter affect the pheno- QTL exhibiting variable effects, although additional QTL for environmental sensitivity map to unique geno-typic mean) in an environment-specific fashion. These
models are not mutually exclusive, nor do they make mic regions. These findings provide insights into how genomes and environmental factors interact to deter-restrictions regarding the types of genes expected to be
acting under each model. mine phenotypes.
Quantitative trait locus (QTL) mapping provides an excellent means for exploring the genetic basis of
phe-MATERIALS AND METHODS notypic plasticity and GEI. Although initial applications
had some shortcomings (seeLynch andWalsh1998
Mapping populations and plant-growing conditions: Charac-for a review), more recent efCharac-forts have proven far more terization of plasticity and GEI and QTL⫻environment map-effective, largely due to the incorporation of a QTL⫻ ping of inflorescence development traits were conducted in two sets of recombinant inbred (RI) lines. The first set (Ler⫻ environment interaction component, either by
combin-Col, 96 lines) is derived from a cross between ecotypes Lands-ing QTL mappLands-ing results with analysis of variance
(AN-bergerectaand Columbia (Lister andDean 1993) and the OVA) models or by integrating this interaction
compo-second set (Cvi⫻Ler, 158 lines) is derived from a cross be-nent into actual mapping algorithms (JiangandZeng tween ecotypes Cape Verde Islands and Landsberg erecta 1995;Wanget al.1999). Additionally, QTL mapping can (Alonso-Blancoet al.1998a). These represent the same lines used inUngereret al.(2002). Although the Lerecotype is a also be performed on environmental sensitivity scores
parent in both sets of RI lines, different accessions of this (standardized differences in trait values measured in
ecotype were used in the construction of the two sets (Ler-0 different environments). These approaches have pro- [NW20] for Ler⫻Col and Ler-2 [N8581] for Cvi⫻Ler; see vided much better quantitative evaluations of QTL ⫻ http://nasc.nott.ac.uk/catalogue.html).
environment interactions and have been used success- The experimental design and growing conditions followed those of Ungerer et al. (2002). The long-day photoperiod fully to investigate plasticity and GEI in animal life span
treatment consisted of 14-hr days (20⬚) and 10-hr nights (18⬚) (Shook andJohnson 1999;Leips andMackay2000;
whereas the short-day treatment consisted of 10-hr days (20⬚) Vieiraet al.2000), Drosophila sensory bristle number and 14-hr nights (18⬚). These photoperiods were chosen to (Gurganuset al.1998), reproductive performance (Fry coincide with those experienced by natural plant populations et al. 1998; Shook and Johnson 1999), agriculturally in late fall and late spring as part of a larger experiment comparing inflorescence development under growth chamber relevant crop traits (Jianget al.1999), flowering time
and field conditions. All plants were housed in environmen-(Clarkeet al.1995;Jansenet al.1995;Stratton1998;
tally regulated growth chambers at the North Carolina State Alonso-Blancoet al.1998b), seed dormancy (Van Der
University Phytotron Facility. Growth chambers were main-Schaaret al.1997), plant secondary metabolite produc- tained at near-ambient CO
2(350–400 ppm) with
photosyn-tion (Kliebensteinet al.2002), and pollen competitive thetically active radiation (PAR)⫽500–540mol m⫺2s⫺1. A
procedural manual for the Phytotron Facility is available at ability (Sari-Gorlaet al.1997).
http://www2.ncsu.edu/ncsu/research_outreach_extension/ In a previous report (Ungereret al.2002),
quantita-centers/phyto/index.html. Because of the size of this experi-tive genetic analyses and QTL mapping of 13
inflores-ment, the different sets of RI lines (and their parental lines) cence development traits were conducted for two sets were not grown concurrently but rather were staggered in of recombinant inbred (RI) lines grown under a long- time.
andUngereret al.2002) reflecting various aspects of inflo- Mapping of QTL associated with plasticity and GEI for in-florescence development was conducted using multiple-trait rescence development were measured for 15 replicate
individ-uals of each line (for both sets of RI lines) in each photoperiod composite interval mapping (multiple-trait CIM; Jiangand
Zeng 1995), which is part of a suite of programs in QTL environment. Because plants were occasionally lost during the
experiment and because some seeds failed to germinate,⬍15 Cartographer 1.13 (Bastenet al.1994, 1999). Measuring the same trait in more than one environment is statistically equiva-replicate individuals were measured for a small number of
lines. No fewer than 11 replicates, however, were scored for lent to measuring multiple genetically correlated traits in the same environment (Falconer 1952). Multiple-trait CIM any one line. Results for bolting time (in Ler ⫻ Col) are
described elsewhere (Weiniget al.2002). allows for the dissection of genetic variation and covariation by estimating the positions and differential effects of QTL for
Quantitative genetic analysis of plasticity and GEI:
Mixed-model ANOVAs were used to partition variance in inflores- correlated traits (or for the same trait in different environ-ments;Jiangand Zeng1995). This procedure is similar to cence development traits in the mapping populations into
sources attributable to RI line, photoperiod, and their corre- conventional CIM in which tests are conducted sequentially along each chromosome to determine whether intervals sponding interaction. For each trait, the model
flanked by molecular markers contain a QTL while statistically y⫽ ⫹G⫹P⫹G⫻P⫹R accounting for other QTL segregating in the genetic back-ground outside the tested interval. Multiple-trait CIM is differ-was evaluated, whereGrepresents genotype (i.e., RI line,
ran-ent, however, in that QTL mapping is performed jointly on dom effect),Prepresents photoperiod (fixed effect),G⫻P
measurements of the same trait in different environments. represents GEI (random effect), andR represents residual
The hypotheses tested are error. A significant effect of RI line (G) was interpreted as
genetic differences among RI lines for the traits measured, a
H0:a1⫽0,a2⫽0,
significant effect of photoperiod (P) was interpreted as the
presence of phenotypic plasticity, and a significant interaction H1: at least one of them is not zero,
(G⫻P) was interpreted as significant GEI.
wherea1anda2represent additive effects of QTL in
environ-Significant GEI can arise from two sources: (1) deviation
ments 1 and 2. At test positions where the null hypothesis is from unity of the cross-environment genetic correlation (rGE⬍
rejected, tests of QTL ⫻ environment interaction are per-1; see below) and (2) differences in among-line variance in
formed. The hypotheses tested are the separate environments. The contributions of these sources
can be determined from the equation H
0:a1⫽a2
VG⫻E⫽[2E1E2(1⫺rGE)⫹(E1⫺ E2)2]/2 H
1:a1⬆a2.
(Robertson1959), where VG⫻Eis the GEI variance
compo-Both sets of hypotheses are tested with the likelihood-ratio nent,E1andE2are square roots of the among-line variance
(LR) test statistic,⫺2 ln(L0/L1) (whereL0/L1is the ratio of
components in different photoperiods, andrGEis the
cross-likelihoods of hypotheses). Two sets of LR scores (one for the environment genetic correlation. The first term corresponds
joint analysis and one for the QTL⫻environment analysis) to lack of perfect correlation (rGE⬍1) and the second term
are thus evaluated. Note that in the current study it was not corresponds to differences in among-line variance.
possible to estimate dominance effects due to the absence of The cross-environment genetic correlation (rGE) is the
ge-heterozygotes in RI lines. netic correlation of measurements of the same trait in
differ-The identity (and number) of markers selected for genetic ent environments and here reflects the degree to which the
background control was determined independently for each same genes control trait expression across photoperiods.rGE
trait by forward selection, backward elimination stepwise re-was estimated for each trait as covE1E2/E1E2, where covE1E2is
gression. For each trait, markers were selected separately in the covariance of RI line means measured in different
photo-each environment and then used jointly in multiple-trait CIM. period environments andE1andE2are square roots of the
A 10-cM scan window was used for all analyses and the LR among-line variance components in different environments.
test statistic was calculated every 0.5 cM. All statistical analyses were conducted using software packages
Experiment-wide significance thresholds for QTL identifi-SAS (GLM and VARCOMP procedures; identifi-SASInstitute1988)
cation were determined for each trait by permutation analysis and/or STATVIEW (SASInstitute1999).
(Churchill and Doerge 1994; Doerge and Churchill
Linkage maps: Genotype data for these lines are publicly
1996). The permutation procedure yields different signifi-available and were obtained on the web at http://nasc.nott.ac.
cance thresholds for the joint and QTL⫻environment LRs. uk/. The Ler⫻Col and Cvi⫻LerRI lines have been genotyped
One thousand permutations were performed for each trait. for largely different sets of markers and thus different maps
Because multiple-trait CIM differs slightly from conven-were generated for each set of lines. Maps conven-were constructed
tional CIM with respect to model evaluation and marker cofac-using Mapmaker/EXP 3.0 (Lander et al. 1987). Details of
tor selection, a two-step procedure was conducted to qualita-marker selection and map construction are described
else-tively compare the two approaches. First, conventional CIM where (Ungereret al.2002). Briefly, the Ler⫻Col map spans
(Zeng1994) was performed for each trait separately in each 576.52 cM and is composed of 222 markers spaced, on average,
environment. This procedure allowed confirmation of QTL every 2.61 cM (Figure 1). The Cvi⫻Ler map spans 458.45
positions in separate environments. Second, the marker near-cM and consists of 138 markers spaced, on average, every 3.35
est each QTL peak (detected in either or both environments) cM (Figure 1).
was selected and collectively fitted to the model
QTL analyses:ANOVA results from analyses of phenotypes
can indicate whether genetic differences exist among RI lines y⫽ ⫹P⫹
兺
Mi⫹
兺
(Mi⫻P)⫹R,for inflorescence development traits and whether there are
plasticity and GEI for these traits. ANOVA results cannot, where Pand Rare defined as above, Mirepresents the ith
marker detected by conventional CIM in either or both photo-however, provide any information regarding the actual genetic
factors responsible for these patterns. QTL mapping strategies periods, and Mi ⫻ P represents the interaction of the ith
marker with photoperiod (i.e., QTL⫻environment interac-are an appropriate means of further exploring these statistical
in these full-ANOVA models were then compared to corre- org/supplemental, Tables 1–3) in combination with the sponding results from the multiple-trait CIM analysis (con- previously reported LD data.
ducted within QTL Cartographer). The two approaches
pro-In mixed-model ANOVAs with main effects of RI line duced near-identical results: QTL exhibiting QTL ⫻
and photoperiod and their corresponding interaction, environment interaction as determined by multiple-trait CIM
almost always had a significant QTL⫻environment interac- significance of main effects and the interaction term tion term (or near significant) in full-ANOVA models and was observed for the majority of traits in both sets of RI QTL not exhibiting QTL⫻environment interactions as deter- lines (Table 1). This result indicates that (1) there are mined by multiple-trait CIM typically did not. Only results
genetic differences among RI lines for the traits speci-from multiple-trait CIM are reported here.
fied, (2) there is plasticity in inflorescence development Tests for epistasis among QTL were conducted using
ANO-VAs to examine interaction effects of QTL with established patterns across photoperiods, and (3) there is variation additive effects (Longet al.1995; Leipsand Mackay2000; in plastic response among individual RI lines (there is
Ungereret al.2002). Tests for epistasis were first performed GEI). Only one inflorescence trait (elongated axils in
separately in each environment. The markers selected to
con-Ler⫻Col) failed to exhibit a plastic response to photo-duct these tests, however, were those detected in the
multiple-period (in the full-ANOVA model,F⫽3.29,P⫽0.07). trait CIM joint analysis. It was therefore possible for markers
to be tested for epistasis in an environment where main effects This trait did, however, exhibit significant GEI (Table of that marker (QTL) were not detected. To determine 1). Traits that did not exhibit significant GEI include whether epistatic interactions contribute to plasticity and GEI rosette diameter (in both Ler ⫻ Col and Cvi ⫻ Ler), for inflorescence development traits, the full-ANOVA model
main inflorescence fruits (Ler ⫻ Col only), and total y⫽ ⫹P⫹
兺
Mi⫹(Mj⫻Mk)⫹(Mj⫻Mk⫻P)⫹R fruits (Ler ⫻ Col only). Axillary fruits (in Ler ⫻ Col)exhibited marginally significant GEI (Table 1). The fail-was evaluated, whereP,Mi, andRare defined as above and
ure to detect GEI for some inflorescence development Mj and Mk are markers involved in significant epistasis. A
traits may be associated with a lack of statistical power significant three-way interaction term (Mj⫻Mk⫻P) indicates
that the nature of epistasis differs across photoperiods and given the low estimated heritability for some traits (sup-thus may contribute to observations of plasticity and GEI. plemental data Table 2).
Where it was necessary to evaluate multiple models for a given GEI can arise from the lack of perfect correlation trait, significance thresholds were adjusted using a sequential
across environments (rGE ⬍ 1) and from differences
Bonferroni procedure. All analyses of epistasis were conducted
in among-line variance for the same trait measured in using the GLM procedure of SAS (SASInstitute1988).
Finally, for each individual RI line and for each trait, an separate environments. Lack of perfect correlation indi-environmental sensitivity score was estimated as (E1i⫺E2i)/D cates changes in rank order of reaction norms. On
aver-(Falconer1990), whereDis the difference of the means of age, the majority of GEI variance in both sets of RI lines
all RI lines reared in the two photoperiod environments and
was attributable to this source (averaged over all traits, E1iandE2iare the means of replicate individuals of the same
71.7% in Ler⫻Col and 68.8% in Cvi⫻ Ler). Interest-RI line in the two different photoperiod environments, where
ingly, despite these similar averages, the relative parti-irefers to 1–96 (Ler ⫻Col) or 1–158 (Cvi ⫻ Ler) RI lines.
QTL for sensitivity scores for all traits were then mapped using tioning ofVG⫻Efor the same trait often differed
substan-conventional CIM and significance thresholds determined by tially between the two sets of RI lines (Table 1). For permutation.
example, for rosette leaves at bolting the relative contri-Comparing this latter analysis to results from the
multiple-butions of changes in rank ordervs.changes in variance trait CIM analysis allowed for evaluation of evidence
support-of reaction norms were 0.97 and 0.03, respectively, in ing the two classes of genetic models for plasticity and GEI.
If the allelic sensitivity model explains most plasticity and GEI, the Ler ⫻ Col lines but 0.16 and 0.84, respectively, in then QTL for environmental sensitivity scores are expected the Cvi⫻Lerlines (Table 1).
to co-localize with QTL affecting inflorescence development Variable-effect QTL:Results of multiple-trait CIM are traits directly (QTL detected by multiple-trait CIM), and these
depicted graphically in Figure 1 and are listed in supple-QTL are expected to exhibit supple-QTL⫻environment interactions.
mental data Tables 4 and 5 (http://www.genetics.org/ Conversely, if the gene regulation model explains most
plastic-ity and GEI, then QTL for environmental sensitivplastic-ity scores supplemental). Overall, 44 and 62 QTL for inflores-are expected to map to unique genomic regions and there is cence development were identified in the Ler ⫻ Col no expectation of positional overlap with QTL affecting traits and Cvi ⫻ Ler mapping populations, respectively. In directly (LeipsandMackay2000;Kliebensteinet al.2002).
the Ler ⫻ Col lines, 12 of 44 QTL (27.3%) exhibited significant QTL ⫻ environment interaction. In the Cvi⫻Lerlines, 32 of 62 QTL (51.6%) exhibited signifi-RESULTS
TABLE 1
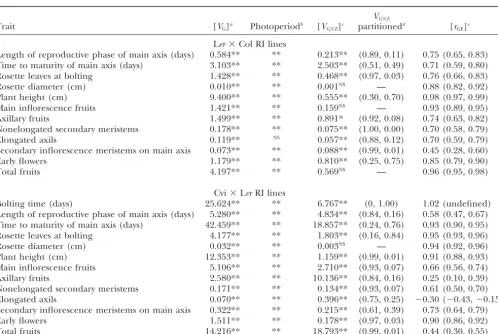
Quantitative genetic statistics of plasticity and GEI for 13 inflorescence development traits measured in short-day (10-hr) and long-day (14-hr) photoperiods
VG⫻E
Trait [VG]a Photoperiodb [VG⫻E]c partitionedd [rGE]e
Ler⫻Col RI lines
Length of reproductive phase of main axis (days) 0.584** ** 0.213** (0.89, 0.11) 0.75 (0.65, 0.83) Time to maturity of main axis (days) 3.103** ** 2.503** (0.51, 0.49) 0.71 (0.59, 0.80)
Rosette leaves at bolting 1.428** ** 0.468** (0.97, 0.03) 0.76 (0.66, 0.83)
Rosette diameter (cm) 0.010** ** 0.001NS — 0.88 (0.82, 0.92)
Plant height (cm) 9.400** ** 0.555** (0.30, 0.70) 0.98 (0.97, 0.99)
Main inflorescence fruits 1.421** ** 0.159NS — 0.93 (0.89, 0.95)
Axillary fruits 1.499** ** 0.891* (0.92, 0.08) 0.74 (0.63, 0.82)
Nonelongated secondary meristems 0.178** ** 0.075** (1.00, 0.00) 0.70 (0.58, 0.79)
Elongated axils 0.119** NS 0.057** (0.88, 0.12) 0.70 (0.59, 0.79)
Secondary inflorescence meristems on main axis 0.073** ** 0.088** (0.99, 0.01) 0.45 (0.28, 0.60)
Early flowers 1.179** ** 0.810** (0.25, 0.75) 0.85 (0.79, 0.90)
Total fruits 4.197** ** 0.569NS — 0.96 (0.95, 0.98)
Cvi⫻LerRI lines
Bolting time (days) 25.624** ** 6.767** (0, 1.00) 1.02 (undefined)
Length of reproductive phase of main axis (days) 5.280** ** 4.834** (0.84, 0.16) 0.58 (0.47, 0.67) Time to maturity of main axis (days) 42.459** ** 18.857** (0.24, 0.76) 0.93 (0.90, 0.95)
Rosette leaves at bolting 4.177** ** 1.803** (0.16, 0.84) 0.95 (0.93, 0.96)
Rosette diameter (cm) 0.032** ** 0.003NS — 0.94 (0.92, 0.96)
Plant height (cm) 12.353** ** 1.159** (0.99, 0.01) 0.91 (0.88, 0.93)
Main inflorescence fruits 5.106** ** 2.710** (0.93, 0.07) 0.66 (0.56, 0.74)
Axillary fruits 2.580** ** 10.136** (0.84, 0.16) 0.25 (0.10, 0.39)
Nonelongated secondary meristems 0.171** ** 0.134** (0.93, 0.07) 0.61 (0.50, 0.70)
Elongated axils 0.070** ** 0.396** (0.75, 0.25) ⫺0.30 (⫺0.43,⫺0.15)
Secondary inflorescence meristems on main axis 0.322** ** 0.215** (0.61, 0.39) 0.73 (0.64, 0.79)
Early flowers 1.511** ** 0.178** (0.97, 0.03) 0.90 (0.86, 0.92)
Total fruits 14.216** ** 18.793** (0.99, 0.01) 0.44 (0.30, 0.55)
NS, not significant; *Pⱕ0.05; **Pⱕ0.0001.
aAmong-line variance component from full-ANOVA model; significance indicates genetic differences among RI lines. bFixed effect of photoperiod from full-ANOVA model; significance indicates plasticity for photoperiod.
cRI line by photoperiod interaction variance component from full-ANOVA model; significant interaction indicates genotype⫻
environment interaction (GEI).
dProportion ofV
G⫻Eattributable to the departure of the cross-environment genetic correlation from unity (first term) and to
changes in among-line variance in different photoperiod environments (second term).
eCross-environment genetic correlation calculated as cov
E1E2/E1E2; parentheses indicate 95% confidence intervals.
effect across the two photoperiods). For QTL exhibiting discussion). QTL positions, support limits, and addi-tive effects in each photoperiod environment are given significant interaction effects, changes in magnitude
were substantially more common than changes in rank in supplemental data Tables 4 and 5.
Epistatic interactions contribute to plasticity and GEI: order in both sets of RI lines (Figure 2).
Multiple QTL clustered near the erectamutation on Significant epistasis was detected in both sets of RI lines and in both photoperiods [Figure 3, supplemental data chromosome II (Figure 1). Clustering of QTL also was
observed at the top of chromosome 1 and top, middle, Tables 6 and 7 (http://www.genetics.org/supplemental)]. In the Ler⫻Col lines, five interactions were detected, and bottom of chromosome 5. Some of these regions
of clustering [e.g., top of chromosome 1 and top and affecting four traits (Figure 3A, supplemental data Table 6). None of the five interactions were found to be sig-middle of chromosome 5 (Cvi⫻ Ler)] harbored QTL
that consistently exhibited variable effects across photo- nificant in both photoperiods when tests were con-ducted separately (supplemental data Table 6). The periods (QTL⫻environment interactions), indicating
that specific genomic regions may disproportionately more relevant tests of three-way interaction among marker pairs (QTL) and photoperiod (i.e., marker⫻ contribute to observed plasticity and GEI across multiple
traits. Of course, clustering of QTL may represent a far marker ⫻ photoperiod) revealed three of five signifi-cant tests (Figure 3A, supplemental data Table 6), indi-smaller number of actual segregating loci (or a single
Figure1.—Arabidopsis thalianagenetic linkage maps constructed from the Ler⫻Col (left chromosomes) and Cvi⫻Ler(right chromosomes) RI lines and QTL positions for 13 inflorescence development traits. QTL for different traits are depicted with different symbols and vertical lines associated with each QTL indicate 2 LOD support limits. Dashed vertical lines (support limits) indicate that QTL exhibits GEI. Colors of QTL are associated with trait subcategories as follows (Ungereret al.2002): black, inflorescence developmental timing; green, basal rosette morphology; blue, inflorescence architecture; and red, fitness. Map positions of genetic markers are depicted as circles on chromosomes. Markers represented as open symbols did not map to unique intervals given the mapping criteria specified and are placed here in the interval of highest likelihood. Markers that did not map to unique intervals were not used in QTL analyses. Genetic markers connected by lines were mapped in both sets of RI lines and represent landmarks for map comparisons. Units of map length are in centimorgans.
differs significantly across photoperiods for some inter- detected affecting nine traits (Figure 3B, supplemental data Table 7), with some interactions affecting multiple actions. The majority of markers (QTL) involved in
these interactions had larger additive effects in the envi- traits (e.g., the AXR-1 ⫻ BH.325L interaction had sig-nificant effects on bolting time, length of reproductive ronment in which the significant epistasis was detected
Figure2.—Summary of QTL behavior types for 13 inflores-cence development traits in the Ler ⫻ Col (top bars) and Cvi⫻Ler(bottom bars) RI lines. Trait abbreviations: BOLT, bolting time; LR, length of reproductive phase of main axis; TM, time to maturity of main axis; RLN, rosette leaves at bolting; RD, rosette diameter; PH, plant height; NMF, main inflorescence fruits; TAF, axillary fruits; NEC, nonelongated secondary meristems; TEA, elongated axils; TIM, secondary meristems on main axis; TEF, early fruits; and TF, total fruits.
Figure1.—Continued. plemental data Table 5). In instances where epistasis
was found to be significant in both photoperiod environ-ments, additive effects of QTL involved in interactions actions (marker ⫻ marker ⫻ photoperiod) were sig- were larger in the photoperiod in which the epistatic nificant, indicating that the nature of epistasis was sig- effect was larger.
nificantly different across photoperiods for all pairwise QTL for environmental sensitivity:The positions and marker combinations in the Cvi⫻LerRI lines. In con- effects of QTL for environmental sensitivity are given trast to the Ler⫻ Col lines, approximately one-half of in Tables 2 and 3 for the Ler ⫻ Col and Cvi ⫻ Ler interactions were significant in both photoperiods when mapping populations, respectively. Also provided in tests were conducted separately in each photoperiod these tables is whether 2 LOD support limits for these environment. This is noteworthy because even though QTL overlap with support limits for QTL identified by some of the same interactions were found to be signifi- multiple-trait CIM. Eleven of 20 (55%) and 30 of 36 cant under both SD and LD photoperiods, the strength (ⵑ83%) sensitivity QTL overlapped in position with of the interaction differed significantly across photope- declared [or marginally significant (P ⬍ 0.10)] QTL riods—the tests of three-way interaction (marker ⫻ from multiple-trait CIM in the Ler⫻Col and Cvi⫻Ler marker⫻photoperiod) were significant (supplemental mapping populations, respectively. In these regions of data Table 7). Consistent with interactions detected in overlap, declared QTL from multiple-trait CIM dispro-portionately exhibited QTL⫻environment interactions the Ler ⫻ Col lines, however, the additive effects of
(sup-Figure3.—Epistatic interactions detected in the Ler⫻Col (A) and Cvi⫻Ler(B) RI lines. Lines connect pairs of markers (QTL) with significant epistatic effects. Dashed lines indicate that the magnitude of the interaction was significantly different across photoperiods (significant marker⫻ marker ⫻ photoperiod term, see section inmaterials and methods for testing epistasis) whereas solid lines indicate that three-way interaction was not significant. Positions of QTL involved in interactions are shown to the left (A) or right (B) of the chromosomes (notation is the same as in Figure 1). MarkersGH.473CandGH.117C on chromosome 5 (B) are 0.97 cM apart and are indicated by the same enlarged symbol.
noted that many QTL for environmental sensitivity across photoperiods being a less common contributor. mapped to similar genomic regions and may indeed GEI variance that is attributable to crossing of reaction represent the same genetic factor(s). norms may have important ecological relevance as it suggests that different genotypes may be favored in dif-ferent environments.
DISCUSSION Between two and seven QTL were detected by
multi-ple-trait CIM for each inflorescence development trait. Phenotypic plasticity, GEI, and variable effect QTL:
For a substantial percentage of QTL, expression was We examined plasticity and GEI in response to variation
highly sensitive to photoperiod environment—there in photoperiod length for 13 inflorescence
develop-was QTL ⫻ environment interaction. Combined over ment traits in two sets of RI lines using a combination
all traits, 27.3 and 51.6% of QTL exhibited significant of quantitative genetic and QTL mapping approaches.
QTL⫻environment interactions in the Ler⫻Col and The majority of inflorescence development traits
exhib-Cvi⫻Lerlines, respectively. These percentages are simi-ited strong plasticity and GEI when reared under
photo-lar to those found in other plant studies that have as-periods of different length. Most of the GEI variance
sessed QTL⫻environment interactions across distinct was found to be attributable to changes in rank order
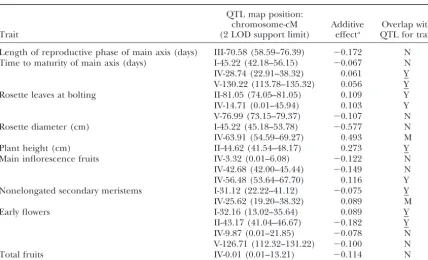
TABLE 2
QTL for photoperiod sensitivity in Ler⫻Col RI lines
QTL map position:
chromosome-cM Additive Overlap with
Trait (2 LOD support limit) effecta QTL for traitb
Length of reproductive phase of main axis (days) III-70.58 (58.59–76.39) ⫺0.172 N
Time to maturity of main axis (days) I-45.22 (42.18–56.15) ⫺0.067 N
IV-28.74 (22.91–38.32) 0.061 Y
V-130.22 (113.78–135.32) 0.056 Y
Rosette leaves at bolting II-81.05 (74.05–81.05) 0.109 Y
IV-14.71 (0.01–45.94) 0.103 Y
V-76.99 (73.15–79.37) ⫺0.107 N
Rosette diameter (cm) I-45.22 (45.18–53.78) ⫺0.577 N
IV-63.91 (54.59–69.27) 0.493 M
Plant height (cm) II-44.62 (41.54–48.17) 0.273 Y
Main inflorescence fruits IV-3.32 (0.01–6.08) ⫺0.122 N
IV-42.68 (42.00–45.44) ⫺0.149 N
IV-56.48 (53.64–67.70) 0.116 Y
Nonelongated secondary meristems I-31.12 (22.22–41.12) ⫺0.075 Y
IV-25.62 (19.20–38.32) 0.089 M
Early flowers I-32.16 (13.02–35.64) 0.089 Y
II-43.17 (41.04–46.67) ⫺0.182 Y
IV-9.87 (0.01–21.85) ⫺0.078 N
V-126.71 (112.32–131.22) ⫺0.100 N
Total fruits IV-0.01 (0.01–13.21) ⫺0.114 N
aThe additive effect is defined as (Q
1Q1⫺Q2Q2)/2, whereQ1Q1andQ2Q2represent the mean environmental
sensitivity of RI lines homozygous for alternative genotypes at a QTL position. The sign of the additive effect corresponds to the direction of effect of the Columbia allele on the phenotype.
bWhether sensitivity QTL overlap in position with QTL detected by multiple-trait CIM: Y, yes; N, no; M,
QTL detected by multiple-trait CIM is marginally significant (P⬍0.10). Underlining indicates that QTL exhibit QTL⫻environment interaction.
1997;Van Der Schaaret al.1997;Alonso-Blancoet al. detected for these four traits but only one (8.3%) exhib-ited QTL⫻environment interaction. In contrast, the 1998b;Borevitzet al.2002;Kliebensteinet al.2002).
Further, the finding that QTL⫻environment interac- eight remaining traits all displayed highly significant GEI at the phenotypic level, and 11/32 [34.4%] of corre-tions demonstrate changes in magnitude of effects more
often than changes in rank order is also consistent with sponding QTL exhibited QTL⫻environment interac-tion (Figure 2, supplemental data Table 4). In the Cvi⫻ previous studies distinguishing between these QTL
be-havior types (Sari-Gorla et al. 1997; Fry et al. 1998; Lerlines, only one trait (rosette diameter) failed to ex-hibit significant GEI at the phenotypic level (Table 1). Stratton 1998;Jianget al. 1999). It is interesting to
note that whereas changes in rank order were common Although 2 of 7 QTL for this trait exhibited interaction with the environment, their effects were of similar mag-among reaction norms, they were rare mag-among QTL
ef-fects. Although this might appear contradictory, changes nitude but opposite in sign (in both photoperiods). Given that phenotypes are determined by the summa-in rank order of reaction norms need not require
con-gruent patterns of QTL effects. Rather, changes in rank tion of effects of all relevant loci, the combined effects of these two QTL may have canceled, resulting in no order of reaction norms can be explained by changes
in magnitude of QTL effects alone (Fry1993; Fryet GEI detected at the phenotypic level.
In addition to differences in individual QTL effects al.1998).
QTL⫻environment interactions were not found for across photoperiod environments, differences in inter-action effects of QTL also were observed in the form of all traits, and the distribution of these interactions across
traits was generally consistent with the corresponding significant three-way interactions (marker ⫻marker⫻ photoperiod; Figure 3, supplemental data Tables 6 and quantitative genetic analyses: inflorescence traits that
did not exhibit GEI at the phenotypic level (or that did 7). This was true even when the same interaction was found to be significant separately in each photoperiod so only marginally) harbored fewer QTL⫻environment
interactions. For instance, in the Ler⫻Col lines, three environment (supplemental data Table 7). Significant marker⫻marker⫻photoperiod interactions were not traits failed to exhibit GEI at the phenotypic level and
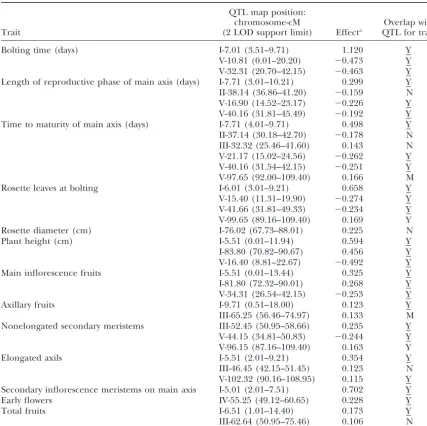
sig-TABLE 3
QTL for photoperiod sensitivity in Cvi⫻LerRI lines
QTL map position:
chromosome-cM Overlap with
Trait (2 LOD support limit) Effecta QTL for traitb
Bolting time (days) I-7.01 (3.51–9.71) 1.120 Y
V-10.81 (0.01–20.20) ⫺0.473 Y
V-32.31 (20.70–42.15) ⫺0.463 Y
Length of reproductive phase of main axis (days) I-7.71 (3.01–10.21) 0.299 Y
II-38.14 (36.86–41.20) ⫺0.159 N
V-16.90 (14.52–23.17) ⫺0.226 Y
V-40.16 (31.81–45.49) ⫺0.192 Y
Time to maturity of main axis (days) I-7.71 (4.01–9.71) 0.498 Y
II-37.14 (30.18–42.70) ⫺0.178 N
III-32.32 (25.46–41.60) 0.143 N
V-21.17 (15.02–24.56) ⫺0.262 Y
V-40.16 (31.54–42.15) ⫺0.251 Y
V-97.65 (92.00–109.40) 0.166 M
Rosette leaves at bolting I-6.01 (3.01–9.21) 0.658 Y
V-15.40 (11.31–19.90) ⫺0.274 Y
V-41.66 (31.81–49.33) ⫺0.234 Y
V-99.65 (89.16–109.40) 0.169 Y
Rosette diameter (cm) I-76.02 (67.73–88.01) 0.225 N
Plant height (cm) I-5.51 (0.01–11.94) 0.594 Y
I-83.80 (70.82–90.67) 0.456 Y
V-16.40 (8.81–22.67) ⫺0.492 Y
Main inflorescence fruits I-5.51 (0.01–13.44) 0.325 Y
I-81.80 (72.32–90.01) 0.268 Y
V-34.31 (26.54–42.15) ⫺0.253 Y
Axillary fruits I-9.71 (0.51–18.00) 0.123 Y
III-65.25 (56.46–74.97) 0.133 M
Nonelongated secondary meristems III-52.45 (50.95–58.66) 0.235 Y
V-44.15 (34.81–50.83) ⫺0.244 Y
V-96.15 (87.16–109.40) 0.163 Y
Elongated axils I-5.51 (2.01–9.21) 0.354 Y
III-46.45 (42.15–51.45) 0.123 N
V-102.32 (90.16–108.95) 0.115 Y
Secondary inflorescence meristems on main axis I-5.01 (2.01–7.51) 0.702 Y
Early flowers IV-55.25 (49.12–60.65) 0.228 Y
Total fruits I-6.51 (1.01–14.40) 0.173 Y
III-62.64 (50.95–75.46) 0.106 N
aThe additive effect is defined as (Q
1Q1⫺Q2Q2)/2, whereQ1Q1andQ2Q2represent the mean environmental
sensitivity of RI lines homozygous for alternative genotypes at a QTL position. The sign of the additive effect corresponds to the direction of effect of alleles of the Landsbergerectaecotype.
bWhether sensitivity QTL overlap in position with QTL detected by multiple-trait CIM: Y, yes; N, no; M,
QTL detected by multiple-trait CIM is marginally significant (P⬍0.10). Underline indicates that QTL exhibit QTL⫻environment interaction.
nificant GEI at the phenotypic level, a result consistent CIM) exhibited interaction effects with photoperiod en-vironment, indicating that environmental sensitivity with the distribution of QTL ⫻ environment
interac-tions. QTL disproportionately map to regions with differential
effects across photoperiods. These observations are Environmental sensitivity QTL: In the Cvi ⫻ Ler RI
lines, the positions of QTL for environmental sensitivity largely consistent with expectations under the allelic sensitivity model of phenotypic plasticity and GEI, but were in general agreement with those for QTL affecting
inflorescence development traits directly. Thirty of 36 suggest that other genetic mechanisms may be acting as well. The same comparison in the Ler⫻Col RI lines sensitivity QTL (ⵑ83%) overlapped in position with
either declared QTL or regions in which QTL signal was less clear, however, as only 55% of sensitivity QTL overlapped with those detected by multiple-trait CIM. was detected but significance thresholds were not quite
QTL (96 and 158 RI lines in Ler⫻Col and Cvi⫻Ler, hr light), and long-day ⫹ vernalization treatments in respectively) or could reflect real biological differences the Cvi⫻ Ler lines. For relevant trait comparisons in and underlying genetic mechanisms of GEI between the relevant environments, all of the same QTL were de-two mapping populations. tected in the two studies with the exception of one small-Comparisons to previous reports:In a previous report effect QTL for rosette leaf number (on chromosome 1 (Ungerer et al. 2002) the same sets of RI lines and atⵑ40 cM) detected inAlonso-Blancoet al.(1998b) traits were evaluated under a long-day photoperiod only. but not in our study. Furthermore, all of the same QTL⫻ Although mapping methods differed between these two environment interactions detected inAlonso-Blanco studies (CIMvs. multiple-trait CIM), a large degree of et al.(1998b) were also found in our study. Congruence overlap of QTL positions was expected and was also in QTL positions was also observed between our study observed. The majority of QTL detected inUngereret and that of Alonso-Blanco et al. (1999), in which a al.(2002) also were detected in this study. Discrepancies different set of partially overlapping inflorescence devel-(presence/absence of QTL) between the previous and opment traits were mapped, although inAlonso-Blanco this study result almost exclusively from likelihood-ratio et al. (1999) mapping populations were grown under tests being near, but not exceeding significance thresh- long days only.
olds in one or the other study. Differences may also be Molecular mechanisms of plasticity and GEI: Charac-attributable to the selection of marker cofactors in CIM terizing how QTL effects differ across environments is vs.multiple-trait CIM. In the latter, markers are selected an important first step in elucidating how genetic and separately in each environment and then used collec- environmental factors interact to determine pheno-tively in the joint analysis. types. To understand the molecular basis of plasticity Similarly, many of the significant epistatic interactions and GEI for inflorescence development, however, it is previously detected inUngereret al.(2002) also were necessary to identify genes underlying natural variation detected in this study. Additional interactions depicted in inflorescence development traits and determine how in Figure 3 that were not detected in Ungerer et al. expression/protein activity differs across ecologically (2002) were (1) found only under the SD photoperiod, relevant environments.
(2) not tested inUngereret al.(2002) because one or The genes underlying two flowering-time QTL de-both markers (QTL) previously were not significant, or scribed in this study (both exhibiting QTL⫻ environ-(3) indeed tested but were not found to be significant
ment interaction) have recently been identified. The in the previous report. This last category is most likely
flowering-time QTL at the top of chromosome 1 (in Cvi⫻ attributable to slightly different ANOVA models
(num-Ler) is attributable to a single-amino-acid substitution bers and identities of main-effect markers used) and
(Valine→Methionine) in the blue-light photoreceptor differences in significance thresholds set by the
sequen-CRY2(in the Cape Verde ecotype;El-Assalet al.2001). tial Bonferroni correction, which is based on the
num-It is particularly interesting (and perhaps not surpris-ber of tests necessary to examine all pairwise
combina-ing) that a light sensing photoreceptor underlies differ-tions of main-effect markers (QTL) in the model.
ential phenotypic responses across photoperiod envi-Results from this study can also be compared with
ronments. The hypothesis that this same molecular other previous studies examining these same lines (some
polymorphism corresponds to the multiple additional of which also examined QTL ⫻ environment
interac-QTL in this region (via pleiotropic effects) seems plausi-tions). Jansenet al. (1995) mapped QTL (and tested
ble, but will require high-resolution mapping to test. for QTL ⫻ environment interactions) for rosette ⫹
The flowering-time QTL at the top of chromosome cauline leaf number (as a measure of flowering time)
5 (detected in Cvi⫻Ler) could correspond to the MADS-using the Ler⫻Col RI lines. These authors conducted
box transcription factor FLC (Michaels and Ama-their study under short days (10 hr light), long days (16
sino1999;Sheldonet al.1999). The Landsbergerecta hr light), and continuous light, all with and without
(Ler) ecotype possesses a loss-of-function allele at FLC vernalization treatment. Of the 12 QTL detected in that
(Koornneefet al.1994;Leeet al.1994;Michaelsand study, 7 appear to have been detected in our study
Amasino1999;Sheldonet al.1999), which segregates although direct comparisons of QTL positions are made
in both sets of RI lines analyzed here. Analysis of theFLC difficult by large differences in map resolution (average
coding sequence among the Landsbergerecta, Columbia, of ⵑ7 markers/chromosome in Jansen et al.1995 vs.
and Cape Verde Island ecotypes revealed a single-amino-ⵑ44 markers/chromosome in our study). In addition,
acid substitution in the first exon in Landsbergerecta(data whereasJansenet al.(1995) measured combined rosette
not shown). This substitution (Arginine → Lysine) is a and cauline leaf number, we measured rosette leaves
conservative amino acid replacement, however, and is only.
not likely to result in loss of function. Another differenti-A greater degree of similarity was observed between
ating genetic feature among these ecotypes is the pres-our study and that of Alonso-Blanco et al. (1998b),
ence of a 1.2-kb insertion in the first intron of the Land-which mapped QTL for flowering time and leaf number
Bonser, S. P., and L. W. Aarssen, 2001 Allometry and plasticity
insertion results in loss of function has not been
deter-of meristem allocation throughout development inArabidopsis
mined. thaliana.J. Ecol.89:72–79.
As with CRY2 at the top of chromosome 1, high- Borevitz, J. O., J. N. Maloof, J. Lutes, T. Dabi, J. L. Redfernet al., 2002 Quantitative trait loci controlling light and hormone
resolution mapping is required to address the extent
response in two accessions ofArabidopsis thaliana.Genetics160:
to whichFLCmay have pleiotropic effects on multiple 683–696.
additional inflorescence traits and the extent to which Bradshaw, A. D., 1965 Evolutionary significance of phenotypic plas-ticity in plants. Adv. Genet.13:115–155.
multiple linked genes with independent effects on each
Bronmark, C., and J. G.Miner,1992 Predator-induced
phenotypi-trait segregate in these mapping populations. This will cal change in body morphology in crucian carp. Science258: have clear relevance to the underlying genetics of plas- 1348–1350.
Churchill, G. A., andR. W. Doerge, 1994 Empirical threshold
ticity and GEI, as a great deal of the positional overlap
values for quantitative trait mapping. Genetics138:963–971.
between sensitivity QTL and those detected by multiple- Clarke, J. H., R. Mithen, J. K. M. BrownandC. Dean, 1995 QTL trait CIM occurs in the genomic regions where these analysis of flowering time inArabidopsis thaliana.Mol. Gen. Genet.
248:278–286.
two genes are located.
De Jong, G., 1990 Quantitative genetics of reaction norms. J. Evol.
In conclusion, it should be noted that this study has
Biol.3:447–468.
considered only two distinct environments differing by De Jong, G., 1995 Phenotypic plasticity as a product of selection in a variable environment. Am. Nat.145:493–512.
a single factor. This factor (photoperiod length) has
Diggle, P. K., 1999 Heteroblasty and the evolution of flowering
ecological relevance in that it is a principal determinant
phenologies. Int. J. Plant Sci.160(Suppl): 123–124.
of seasonal change and can be a cue to initiate (or Doerge, R. W., andG. A. Churchill, 1996 Permutation tests for
multiple loci affecting a quantitative character. Genetics142:
delay) reproduction (Evans1975;ThomasandVince
-285–294.
Prue1997). Natural environments are assuredly much
Dorn, L. A., E. H. PyleandJ. Schmitt, 2000 Plasticity to light cues
more complex, however, with far more environmental and resources inArabidopsis thaliana: testing for adaptive value
and costs. Evolution54:1982–1994.
factors varying both spatially and temporally. It is likely
El-Assal, S. E.-D., C. Alonso-Blanco, A. J. M. Peeters, V. Razand
that natural environments will amplify the complexity
M. Koornneef, 2001 A QTL for flowering time in Arabidopsis
of GEI and its genetic underpinnings. QTL mapping reveals a novel allele ofCRY2.Nat. Genet.29:435–440. studies that have examined multiple environments and/ Evans, L. T., 1975 Daylength and the Flowering of Plants.W. A.
Benja-min, Menlo Park, CA.
or included sex-specific effects (Fryet al. 1998; Jiang
Falconer, D. S., 1952 The problem of environment and selection.
et al.1999;LeipsandMackay2000;Vieiraet al.2000) Am. Nat.86:293–298.
have found higher proportions of QTL exhibiting inter- Falconer, D. S.,1990 Selection in different environments: effects on environmental sensitivity (reaction norm) and on mean
per-actions with the environment. Nevertheless, it is clear
formance. Genet. Res.56:57–70.
that genetic and environmental factors are inextricably Fishbein, M., andD. L. Venable, 1996 Evolution of inflorescence linked and phenotypic expression is determined by design: theory and data. Evolution50:2165–2177.
Fry, J. D., 1993 The “general vigor” problem: Can antagonistic
plei-their joint effects.
otropy be detected when genetic covariances are positive? Evolu-We thank the North Carolina State University Phytotron Facility tion47:327–333.
for use of growth space. This work was supported by a National Science Fry, J. D., S. V. Nuzhdin, E. G. PasyukovaandT. F. C. Mackay, 1998 QTL mapping of genotype-environment interaction for Foundation Integrative Research Challenges in Environmental
Biol-fitness inDrosophila melanogaster. Genet. Res.71:133–141. ogy grant to M.D.P., T.F.C.M., and Johanna Schmitt.
Gillespie, J. H., andM. Turelli, 1989 Genotype-environment inter-actions and the maintenance of polygenic variation. Genetics
121:129–138.
Gimelfarb, A., 1990 How much genetic variation can be maintained
LITERATURE CITED by genotype-environment interactions? Genetics124:443–445. Gomulkiewicz, R., andM. Kirkpatrick, 1992 Quantitative genetics
Alonso-Blanco, C., A. J. M.Peeters, M.Koornneef, C.Lister, C.
and the evolution of reaction norms. Evolution46:390–411.
Deanet al., 1998a Development of an AFLP based linkage map
Grbic, V., andA. B. Bleecker, 1996 An altered body plan is con-of Ler, Col and CviArabidopsis thalianaecotypes and construction
ferred on Arabidopsis plants carrying dominant alleles of two of a Ler/Cvi recombinant inbred line population. Plant J. 14:
genes. Development122:2395–2403. 259–271.
Greene, E., 1989 A diet-induced developmental polymorphism in
Alonso-Blanco, C., S. E.-D. El-Assal, G. CouplandandM.
Koorn-a cKoorn-aterpillKoorn-ar. Science243:643–646.
neef, 1998b Analysis of natural allelic variation at flowering
Gurganus, M. C., J. D. Fry, S. V. Nuzhdin, E. G. Pasyukova, R. F.
time loci in the Landsbergerectaand Cape Verde Islands ecotypes
Lymanet al., 1998 Genotype-environment interaction at quanti-ofArabidopsis thaliana.Genetics149:749–764.
tative trait loci affecting sensory bristle number inDrosophila
mela-Alonso-Blanco, C., H. Blankestijn-De Vries, C. J. Hanhartand
nogaster.Genetics149:1883–1898.
M. Koornneef, 1999 Natural allelic variation at seed size loci
Hedrick, P. W., 1986 Genetic polymorphism in heterogeneous envi-in relation to other life history traits ofArabidopsis thaliana.Proc.
ronments: a decade later. Annu. Rev. Ecol. Syst.17:535–566. Natl. Acad. Sci. USA96:4710–4717.
Jansen, R. C., J. W. Van Ooijen, P. Stam, C. ListerandC. Dean,
Basten, C. J., B. S. WeirandZ-B. Zeng, 1994 Zmap—a QTL
cartog-1995 Genotype-by-environment interaction in genetic mapping rapher, pp. 65–66 inProceedings of the 5th World Congress on Genetics
of multiple quantitative trait loci. Theor. Appl. Genet.91:33–37.
Applied to Livestock Production: Computing Strategies and Software,
Jiang, C., andZ-B. Zeng, 1995 Multiple trait analysis of genetic Vol. 22, edited by C.Smith, J. S.Gavora, B.Benkel, J.Chesnais,
mapping for quantitative trait loci. Genetics140:1111–1127. W.Fairfullet al.Organizing Committee, 5th World Congress
Jiang, C., G. O. Edmeades, I. Armstead, H. R. Lafitte, M. D.
Hay-on Genetics Applied to Livestock ProductiHay-on, Guelph, Ontario,
ward et al., 1999 Genetic analysis of adaptation differences Canada.
between highland and lowland tropical maize using molecular
Basten, C. J., B. S. WeirandZ-B. Zeng, 1999 QTL Cartographer,
markers. Theor. Appl. Genet.99:1106–1119. Version 1.13. Department of Statistics, North Carolina State
architecture of plastic methyl jasmonate responses inArabidopsis Schmalhausen, I. I., 1949 Factors of Evolution: The Theory of Stabilizing Selection. Blakiston, Philadelphia.
thaliana.Genetics161:1685–1696.
Koornneef, M., H. Blankestijn-De Vries, C. Hanhart, W. Soppe Schmitt, J., S. A. DudleyandM. Pigliucci, 1999 Manipulative approaches to testing adaptive plasticity: phytochrome-mediated andT. Peeters, 1994 The phenotype of some late-flowering
mutants is enhanced by a locus on chromosome 5 that is not shade-avoidance responses in plants. Am. Nat.154(Suppl.): S43– S54.
effective in the Landsbergerectawild-type. Plant J.6:911–919.
Lander, E. S., P. Green, J. Abrahamson, A. Barlow, M. J. Daly Sheldon, C. C., J. E. Burn, P. P. Perez, J. Metzger, J. A. Edwards
et al., 1999 TheFLFMADS box gene: a repressor of flowering
et al., 1987 MAPMAKER: an interactive computer package for
constructing primary genetic linkage maps of experimental and in Arabidopsis regulated by vernalization and methylation. Plant Cell11:445–458.
natural populations. Genomics1:174–181.
Lee, I., S. D. Michaels, A. S. MasshardtandR. M. Amasino, 1994 Shook, D. R., andT. E. Johnson, 1999 Quantitative trait loci affect-ing survival and fertility-related traits inCaenorhabditis elegansshow The late-flowering phenotype of FRIGIDA and mutations in
LUMINIDEPENDENSis suppressed in the Landsbergerectastrain genotype-environment interactions, pleiotropy and epistasis. Ge-netics153:1233–1243.
ofArabidopsis.Plant J.6:903–909.
Leips, J., andT. F. C. Mackay, 2000 Quantitative trait loci for life- Simpson, G. G., A. R. GendallandC. Dean, 1999 When to switch to flowering. Annu. Rev. Cell Dev. Biol.15:519–531.
span inDrosophila melanogaster: interactions with genetic
back-ground and larval density. Genetics155:1773–1788. Stratton, D. A., 1998 Reaction norm functions and QTL-environ-ment interactions for flowering time inArabidopsis thaliana.
He-Lister, C., andC. Dean, 1993 Recombinant inbred lines for
map-ping RFLP and phenotypic markers inArabidopsis thaliana.Plant redity81:144–155.
Sultan, S. E., 2000 Phenotypic plasticity for plant development, J.4:745–750.
Lively, C. M., 1986a Canalization versus developmental conversion function, and life history. Trends Plant Sci.5:537–542.
Thomas, B., andD. Vince-Prue, 1997 Photoperiodism in Plants. Aca-in a spatially variable environment. Am. Nat.128:561–572.
Lively, C. M., 1986b Predator-induced shell dimorphism in the demic Press, San Diego.
Tucker, S. C., andJ. Grimes, 1999 The inflorescence. Bot. Rev.65:
acorn barnacleChthamalus anisopoma.Evolution67:858–864.
Long, A. D., S. L. Mullaney, L. A. Reid, J. D. Fry, C. H. Langley 303–316.
Ungerer, M. C., S. S. Halldorsdottir, J. L. Modliszewski, T. F. C.
et al., 1995 High resolution mapping of genetic factors affecting
abdominal bristle number in Drosophila melanogaster. Genetics MackayandM. D. Purugganan, 2002 Quantitative trait loci for inflorescence development in Arabidopsis thaliana.Genetics
139:1273–1291.
Lynch, M., andB. Walsh, 1998 Genetics and Analysis of Quantitative 160:1133–1151.
Van Der Schaar, W., C. Alonso-Blanco, K. M. Leon-Kloosterziel,
Traits. Sinauer Associates, Sunderland, MA.
Meyre, D., A. Leonardi, G. Brisson and N. Vartanian, R. C. Jansen, J. W. Van Ooijenet al., 1997 QTL analysis of seed dormancy in Arabidopsis using recombinant inbred lines and 2001 Drought-adaptive mechanisms involved in the
escape/tol-MQM mapping. Heredity79:190–200. erance strategies of Arabidopsis Landsbergerectaand Columbia
Van Tienderen, P. H., 1997 Generalists, specialists, and the evolu-ecotypes and their F1 reciprocal progeny. J. Plant Physiol.158:
tion of phenotypic plasticity in sympatric populations of distinct 1145–1152.
species. Evolution51:1372–1380.
Michaels, S. D., andR. M. Amasino, 1999 FLOWERING LOCUS C
Van Tienderen, P. H., I. HammadandF. C. Zwaal, 1996 Pleiotropic encodes a novel MADS domain protein that acts as a repressor
effects of flowering time genes in the annual cruciferArabidopsis
of flowering. Plant Cell11:949–956.
thaliana(Brassicaceae). Am. J. Bot.83:169–174.
Orbovic, V., andA. Tarasjev, 1999 Genetic differences in plastic
Via, S., andR. Lande, 1985 Genotype-environment interactions and responses to density between ecotypes of Arabidopsis thaliana.
the evolution of phenotypic plasticity. Evolution39:505–522. Russ. J. Genet.35:528–536.
Via, S., R. Gomulkiewicz, G. De Jong, S. M. Scheiner, C. D. Schlict-Pigliucci, M., 1997 Ontogenetic phenotypic plasticity during the
inget al., 1995 Adaptive phenotypic plasticity: consensus and reproductive phase inArabidopsis thaliana(Brassicaceae). Am. J.
controversy. Trends Ecol. Evol.10:212–217. Bot.84:887–895.
Vieira, C., E. G. Pasyukova, Z-B. Zeng, J. B. Hackett, R. F. Lyman Pigliucci, M., 2001 Phenotypic Plasticity.Johns Hopkins University
et al., 2000 Genotype-environment interaction for quantitative Press, Baltimore.
trait loci affecting life span inDrosophila melanogaster. Genetics
Rathcke, B., and E. P.Lacey, 1985 Phenological patterns of
terres-154:213–227. trial plants. Annu. Rev. Ecol. Syst.16:179–214.
Wang, D. L., J. Zhu, Z. K. LiandA. H. Paterson, 1999 Mapping
Reeves, P. H., andG. Coupland, 2000 Response of plant
develop-QTLs with epistatic effects and QTL⫻environment interactions ment to environment: control of flowering by daylength and
by mixed linear model approaches. Theor. Appl. Genet.99:1255– temperature. Curr. Opin. Plant Biol.3:37–42.
1264.
Robertson, A., 1959 The sampling variance of the genetic
correla-Weberling, F., 1989 Morphology of Flowers and Inflorescences. Cam-tion coefficient. Biometrics15:469–485. bridge University Press, Cambridge, UK.
Sari-Gorla, M., T. Calinski, Z. KaczmarekandP. Krajewski, 1997
Weinig, C., M. C. Ungerer, L. A. Dorn, N. C. Kane, S. S.
Halldors-Detection of QTL⫻environment interaction in maize by a least dottiret al., 2002 Novel loci control variation in reproductive squares interval mapping method. Heredity78:146–157. timing inArabidopsis thalianain natural environments. Genetics SASInstitute, 1988 SAS/STAT User’s Guide, Release 6.03. SAS Insti- 162:1875–1884.
tute, Cary, NC. West-Eberhard, M. J., 1989 Phenotypic plasticity and the origins SASInstitute, 1999 Statview Reference Manual.SAS Institute, Cary, of diversity. Annu. Rev. Ecol. Syst.20:249–278.
NC. Zeng, Z-B., 1994 Precision mapping of quantitative trait loci.
Genet-Scheiner, S. M., 1993 Genetics and evolution of phenotypic plastic- ics136:1457–1468.
ity. Annu. Rev. Ecol. Syst.24:35–68. Zhang, J., andM. J. Lechowicz, 1994 Correlation between time of
Schlichting, C. D., 1986 The evolution of phenotypic plasticity in flowering and phenotypic plasticity inArabidopsis thaliana.Am. plants. Annu. Rev. Ecol. Syst.17:667–693. J. Bot.81:1336–1342.
Schlichting, C. D., andM. Pigliucci, 1998 Phenotypic Evolution: A